Interstellar Ices
Abstract
Currently 36 different absorption bands have been detected in the infrared spectra of cold, dense interstellar and circumstellar environments. These are attributed to the vibrational transitions of 17 different molecules frozen on dust grains. We review identification issues and summarize the techniques required to extract information on the physical and chemical evolution of these ices. Both laboratory simulations and line of sight studies are essential. Examples are given for ice bands observed toward high mass protostars, fields stars and recent work on ices in disks surrounding low mass protostars. A number of clear trends have emerged in recent years. One prominent ice component consists of an intimate mixture between H2O, CH3OH and CO2 molecules. Apparently a stable balance exists between low temperature hydrogenation and oxidation reactions on grain surfaces. In contrast, an equally prominent ice component, consisting almost entirely of CO, must have accreted directly from the gas phase. Thermal processing, i.e. evaporation and crystallization, proves to be readily traceable in both these ice components. The spectroscopic signatures of energetic processing by cosmic rays and high energy photons from nearby protostars are weaker and not as well understood. A fundamental limitation in detecting complex, energetically produced (and also some simple) species is blending of weak features in the spectra of protostars. Sophisticated techniques are required to extract information from blended features. We conclude with a summary of key goals for future research and prospects for observations of ices using future instrumentation, including SIRTF/IRS.
California Institute of Technology, MS 105-24, Pasadena, CA 91125; acab@astro.caltech.edu
Leiden Observatory, P. O. Box 9513, 2300 RA Leiden, the Netherlands
1. Introduction
The infrared spectra of continuum emitting sources (stars, protostars, evolved stars, active galactic nuclei) extincted by large columns of cold dust in molecular clouds, protostellar envelopes, disks, shells, or circumnuclear rings, show a wealth of absorption features. Most of these are attributed to the vibrational modes of volatile solid state molecules ( K). Over half a century ago (Bates & Spitzer 1951) it was realized that the formation of ’ices’ is catalyzed by the cold surfaces of silicate and carbon-based dust particles originating from the outflows of novae, supernovae, and stars on the asymptotic giant branch (see reviews by Patzer et al., Jura et al., and Clayton et al. in these proceedings). When such particles enter the dense interstellar medium, atoms and molecules strike and stick to the surfaces of these cold dust grains. At average molecular cloud densities (), atoms and molecules accrete from the gas at the rate of about one per day (e.g., Tielens & Allamandola 1987). The sticking coefficients for most of these species at 10 K are close to unity with the exception of He and H2. Atoms (such as H, D, C, O) are mobile on the surface and are able to find a compatible reaction partner. Hydrogen atoms migrate rapidly across the surface by quantum-mechanical tunneling (Manico et al. 2001). Heavy atoms (e.g., C and O) can diffuse by thermal hopping (e.g., Tielens & Allamandola 1987). Efficient adsorption and diffusion of species allows chemical reactions on the surface to occur and to form simple and complex molecular species by, for example, exothermic hydrogenation reactions (e.g. Tielens & Hagen 1982; Charnley et al. 1992).
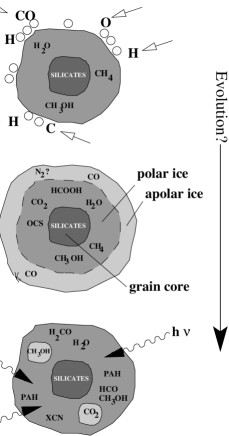
At high atomic abundances, for example early in the cloud life time or at cloud edges, an H2O–rich ice mantle is thus rapidly formed. Since hydrogenated species like H2O, and also CH3OH and NH3 have large dipole moments, these types of ices, including trace species diluted in them, are referred to as ‘polar’ ices in the literature (Fig. 1a). At low atomic abundances and low temperatures, i.e. deeper in the cloud, the accreting gas is primarily molecular and an ‘apolar’ ice, rich in CO and possibly N2 or O2 is formed. Depending on the ice formation history (e.g. increasing densities and molecular abundances as a function of time, or migration of grains in a turbulent cloud) apolar and polar ices may be present on the same grain in an onion-like structure (Fig. 1b), or at different locations along the same line of sight. Polar and apolar ices can be distinguished spectroscopically (different band profiles), and can help trace the thermal and chemical evolution of ices, clouds, and comets (apolar ices evaporate at 20 K and polar ices at 90 K).
The high sticking coefficients would suggest that accretion leads to extreme depletions in the molecular gas on time-scales of about a few 105 years (e.g., Brown & Charnley 1990). However, astronomical observations of molecular gas in the dense interstellar medium indicate also efficient desorption of material from the grain surface. Several desorption mechanisms have been proposed including evaporation following grain heating by cosmic rays, mantle explosions, and ejection upon molecule formation (see Willacy & Millar 1998). As dense clouds are often regions of star formation, dynamical events also have been proposed for removing and reforming the molecular ices within the accretion time-scale; these include sputtering in low-velocity shock waves (Bergin et al. 1998; Charnley et al. 2001) and grain-grain collisions (Markwick et al. 2000; Dickens et al. 2001).
The interaction between the interstellar gas and grains and the prevailing conditions in the line of sight are dominant factors in grain evolution. After icy grain mantles are formed through gas condensation and surface chemistry, the material can be hit by energetic photons and cosmic rays, which triggers dissociation and recombination mechanisms, and thermal processing which may result in crystallization, clathrate formation, polymerization and acid base chemistry (Fig. 1c; Ehrenfreund & Schutte 2000).
Determining the importance of the above-mentioned ice formation and evolution scenarios is a key topic in astrophysics and relates directly to studies of the origin and evolution of solar system ices (e.g. Mumma et al. 2003). In this review we discuss the observational status of interstellar ices. We present an up-to-date list of detected absorption features and discuss their identification and uncertainties in §2. We discuss how information on ice origin and evolution can be derived from observations by comparison with laboratory simulations and line of sight characteristics (§3). Detailed band profile studies of ices in different environments and the significance of thermal processing are discussed in §4. In §5 we touch upon the importance of observing isotopes in the ices and deriving the shape of interstellar grains. Subsequently we discuss the observational evidence for evolution of interstellar ices from a chemical perspective (§6). Finally, we summarize outstanding issues and what can be expected from observations of interstellar ices with future instrumentation (§7).

2. Inventory of Ice Absorption Features
A large number of infrared absorption features attributed to ices has been detected. Complex mid-infrared absorption spectra have been observed toward low and high mass protostars (Fig. 2) and field stars. These features have depths that vary widely from source to source, but often they absorb a significant fraction of the continuum photons. In fact, the observed integrated absorption optical depth (in wavenumber space) of ices in the 2-30 range can easily exceed that of silicates. For example, in the line of sight towards Elias 29, a protostar with moderately deep ice bands, the integrated optical depth of ices is 1000 , or 3 times that of silicates!

The first ice band, at 3.07 from the O–H stretch mode of H2O, was discovered in 1973 in the BN object (Gillett and Forrest 1973). Since then gradual improvements in detector size, sensitivity and telescope size have led to the discovery of roughly one feature per year, with boosts initiated by the ISO satellite and recently by high resolution spectrometers at VLT and Keck (Fig. 3). The latest detections, including the 2.27 band from a CH3OH combination mode (Taban et al. 2003), a shallow band at 4.60 possibly related to CO (Pontoppidan et al. 2003a), and the 3.32 band from the C–H stretch mode of CH4 (Boogert et al. 2003), show that improvements in instrumentation keep driving this area of astrophysics.
| Moleculec,d | |
| 4.67 | CO |
| 4.78 | |
| 2.96, 3.07, 3.2–3.7, 4.5, 6.0, 12, 44 | H2O |
| 2.70, 2.78, 4.27, 15.2 | CO2 |
| 4.38 | 2 |
| 4.92 | OCS |
| 7.60 | [SO2] |
| 2.96, 3.2–3.7, 3.47, 9.01 | [NH3] |
| 7.41 | [HCOO-] |
| 5.83 (narrow) | H2CO |
| 5.83 (broad), 7.25 | HCOOH |
| 3.32, 7.67 | CH4 |
| 3.25, 3.47, 6.85 | [NH], [PAH, -C-H] |
| 2.27, 3.54, 3.85, 3.94, 4.1, 6.85, 8.9, 9.7 | CH3OH |
| 4.62 | [OCN-] |
| 6.25, 7.60 | [PAH, C-C] |
| a: for more details see http://www.astro.caltech.edu/acab/icefeatures.html | |
| b: features listed more than once have multiple possible identifications. | |
| c: uncertain assignments are enclosed in square brackets. | |
| d: see Fig. 4 for abundances. | |
Table 1 lists all 36 absorption features that have been attributed to ices so far, along with identifications, or tentative identifications111A more detailed and regularly updated list of ice features, including references can be found at http://www.astro.caltech.edu/acab/icefeatures.html. About half the listed molecules are securely identified. Simple molecules with strong absorption bands from multiple vibrational modes are most securely identified (H2O, CH3OH, CO2). To this can be added the species with isotope detections (CO, CO2). The identifications of some simple molecules are however still controversial (NH3), as is the identification of a strong absorption band (6.85 ). We will discuss these in some detail (§§2.2 and 2.3), and summarize issues on the weakest ice components (§2.4).
2.1. Interstellar Ice Abundances
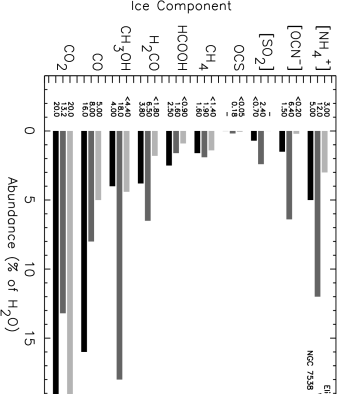
H2O is the most common interstellar ice component at an abundance of typically 1 with respect to the total H column density ([H]+2[H2]; e.g. Tielens et al. 1991). As summarized in Fig. 4, CO2 is the second most common ice component with an abundance of on average 17% with respect to H2O ice over many lines of sight (Gerakines et al. 1999). Although three intriguing deviating lines of sight have been reported (Nummelin et al. 2001), the CO2 abundance correlates best of all ice bands with H2O, revealing important information on the formation history of these species (§6.1). In contrast, it is now well established that the CH3OH abundance varies by an order of magnitude between different sight-lines (Dartois et al. 1999; Pontoppidan et al. 2003b). Large abundance variations are also seen for CO and the species responsible for the 4.62 and 6.85 bands (likely OCN- and possibly NH), and weak evidence for NH3 variations exists as well (§2.2). No correlation between these variations is apparent, suggesting that they may have different origins, such as most likely evaporation of CO, energetic production of OCN- and possibly a different atomic H density at the time of CH3OH production. For the other, low abundance, species listed in Fig. 4 and further discussed in §2.4, insufficient lines of sight have been observed to investigate abundance variations as a function of environment. Finally, no distinction between the abundances toward low and high mass protostars is observed. However, the low OCN- and CH3OH abundance upper limits for quiescent clouds (§4.3) do indicate that ices toward protostars are qualitatively different.
2.2. Pushing the Confusion Limit: the Identification of Solid NH3
Despite the wide presence of ammonia in the gas phase interstellar medium (e.g. Benson & Myers 1989), detection of this species in ices is still a much debated issue. Early attempts at detecting the 2.96 N-H stretching mode led to abundance upper limits of typically 8% with respect to H2O (e.g. Knacke et al. 1982; Smith et al. 1989; Whittet et al. 1996). A relative abundance of 20-30% was claimed toward the Galactic Center source SgrA* (Chiar et al. 2000). Definite detection of the N-H stretch band is complicated because of its blend with the O-H stretch mode of H2O, and crystalline substructures in it (e.g. Smith et al. 1989; Dartois & d’Hendecourt 2001). Other vibrational modes of NH3 suffer from similar complications. The N-H bending mode at 6.0 is blended with the O-H bending mode of H2O (e.g. Keane et al. 2001). The NH3 umbrella mode at 9.0 is blended with the deep absorption band of silicates. Nevertheless distinct absorption features have been reported (Lacy et al. 1998; Gibb et al. 2000), leading to abundances of 10-15% with respect to H2O. On the other hand, such an abundance is inconsistent with the absence of the combination mode at 2.2 in the same line of sight (W 33A; Taban et al. 2003), giving an upper limit of 5% only. It must be emphasized that the 2.2 spectral region is complex and further study is required to validate this important conclusion. Finally, ice mixtures of H2O and NH3 produce NH3.H2O hydrates that absorb quite strongly in the 3.3-4.0 region. The analysis is again ambiguous because of blending with the prominent red wing of the 3.07 H2O band, which may be due in part to scattering by large grains (e.g. Hagen et al. 1983). However, evidence has been presented that a distinct substructure in this same region, the interstellar 3.47 absorption feature, is due to ammonia hydrates as well (Dartois et al. 2001). This is reinforced by the good correlation of the depth of this feature with the H2O ice column (Brooke et al. 1996)222Note that the 3.47 absorption feature in dense clouds should not be confused with a feature at similar wavelength, but with a more structured profile, observed in the diffuse medium and attributed to aliphatic hydrocarbons (Pendleton & Allamandola 2002). An upper limit of 7% of NH3 in the hydrate relative to H2O was derived. In summary, the various absorption bands suggest an abundance of solid NH3 in the interstellar medium of at most 10% of H2O. Higher abundances may be present in different sight-lines, in particular toward the Galactic center. Further study is needed to verify this.
In more general terms, studies of the NH3 molecule illustrate that often the detection of weak absorption features is limited by spectral confusion rather than by S/N. Another notorious example is the 6.0 absorption band which is only partly explained by the O-H bending mode of H2O and has additional contributions from likely HCOOH, H2CO and NH3 (Schutte et al. 1996; Keane et al. 2001) and perhaps more complex species resulting from heavy processing (Gibb & Whittet 2002).
2.3. Progress in Identifying the 6.85 Band
Still no consensus exists on the origin of the prominent 6.85 absorption band, discovered in 1979 (Puetter et al. 1979). This band was observed at low spectral resolution toward a number of massive protostars with the KAO airborne observatory (Tielens et al. 1984). It is situated in the spectral region of O-H and C-H bending mode transitions, and in particular CH3OH has an absorption band at this wavelength that roughly matches these low resolution spectra. Higher resolution ISO/SWS data indicate a peak position and smoothness (no substructures) of the interstellar 6.85 band inconsistent with solid methanol. Indeed, other bands of this species indicate that only a fraction (10%) of the 6.85 band can be attributed to CH3OH. Earlier claims that different bands give different columns due to scattering effects are not sustained by observations of other multi-band species (e.g. CO2; Gerakines et al. 1999).

Exhaustive searches for carriers of the 6.85 absorption band have not led to secure identifications (Keane et al. 2001). Nevertheless, the ISO observations gave significant new insights into the nature of the carrier. Large shifts in the peak position were observed in a sample of lines of sight toward high mass protostars (Fig. 5). The 6.85 band can be explained by a combination of two absorption features, with fixed peak position and width, but varying optical depth. Moreover, the long wavelength feature becomes relatively deeper for lines of sight with warmer and more processed ices (§4.1; cf. compare Figs. 5 and 7). The species responsible for the latter band must therefore be less volatile than the species absorbing at shorter wavelengths. In a different scenario, a single species could be responsible for both bands, but it must follow these spectroscopic constraints upon warm-up.
With this in mind, the NH proposal of Schutte & Khanna (2003) is noteworthy. The red-shift of the 6.85 band as a function of temperature processing is reproduced by heating an NH-containing laboratory ice. These laboratory ices have additional bands at 3.25 and 3.47 , where features are observed in the dense interstellar medium as well (e.g. Sellgren et al. 1994; Brooke et al. 1996). Despite these successes, the match to the interstellar features is only approximate and further study is required. In more general terms, ion production in interstellar ices requires a specific chemistry. For example, NH is produced by warm up of NH3 and acids, which are either deposited (HNCO, HCOOH) or produced by photo-chemistry. In this, the apparently limited availability of NH3 in the ices (§2.2) and the presence of the 6.85 feature in cold, unprocessed sight-lines seem problematic.
2.4. Status of Identifying Weak Ice Components
A set of intriguing absorption features was discovered in the hard to observe 7-8 spectral region: 7.25, 7.41, 7.6, and 7.67 . They are weak and thus so far only detected in a limited sample of the most deeply embedded objects. The 7.25 and 7.41 bands are attributed to formic acid (HCOOH), and the chemically related formate ion (HCOO-) respectively (Schutte et al. 1999). Of these, HCOOH is a more secure identification, because of its contribution to the 6.0 band (Schutte et al. 1996). A similar feature at 7.25 detected toward the Galactic Center was attributed to aliphatic hydrocarbons in the diffuse interstellar medium (Chiar et al. 2000). This alternative identification is consistent with the 3.4 and 6.85 bands which have quite different shapes compared to features at similar wavelengths in dense clouds. The 7.67 absorption band is well explained by the deformation mode of solid CH4 (Lacy et al. 1991; Boogert et al. 1996). Its identification is further supported by the presence of gas phase CH4 lines in the same wavelength region (Boogert et al. 1998; Dartois et al. 1998), good laboratory fits, and the recent detection of the 3.32 CH4 stretching mode (Boogert et al. 2003). The identification of an additional feature at 7.60 is uncertain. It roughly fits with solid SO2, but detailed laboratory fits are not compelling (Boogert et al. 1996; 1997). Its abundance upper limit is a factor 10 larger than that of solid OCS, a value still consistent with grain surface chemistry models (Palumbo et al. 1997). However, otherwise sulphur containing molecules are remarkably under-abundant in interstellar ices. A weak feature at 3.9 was attributed to H2S at first (Geballe et al. 1985), but ascribed to CH3OH later (Allamandola et al. 1992).
Nitrogen containing species are also sparse in the ices. The 4.62 band is attributed to a CN bearing species (likely OCN-; e.g. Novozamsky et al. 2001), but consumes only a small fraction of the available N. NH3 also does not appear to be very abundant (§2.2). Searches for the “forbidden” stretch mode of N2 at 4.295 lead to upper limits that start to become interesting (Sandford et al. 2001). If N2 is mixed with the apolar CO phase, the extreme sensitivity of the band to ice composition may improve further on this (Boogert et al. 2002a; Pontoppidan et al. 2003a).
Similar searches for the “forbidden” mode of solid O2 at 6.45 and its effect on the CO band profile did provide useful upper limits (Vandenbussche et al. 1999). Solid O2 consumes less than 6% of the O budget. Likewise, the most abundant molecule in space, H2, is observable in the ices by a weak infrared active band at 2.415 . A detection was claimed toward one source at three times the solid CO abundance (Sandford et al. 1993), but this needs confirmation because this is also the region of strong CO band heads (e.g. Taban et al. 2003). A secure detection of H2 in interstellar ices would have major implications, because it generally is thought to be too volatile to freeze out on grains. Finally, valuable upper limits were also derived for ethane, ethanol, and hydrogen peroxide (Boudin et al. 1998).
3. The Road toward Understanding the Evolution of Interstellar Ices
In the formation and evolution of interstellar ices a large number of micro and macroscopic processes can potentially play important roles (§1). How can observations of interstellar ice absorption bands help in tracing the importance of these processes? Before embarking on specific examples (§§4 and 5), we will discuss the tools that are available for this purpose.
3.1. Laboratory Simulations
In order to identify solid state species in space, to measure their column densities and to define their physical and chemical properties, laboratory simulations of space conditions have proven to be very effective (e.g. Ehrenfreund & Fraser 2003). Laboratory simulations of low temperature ices are achieved by condensing ices as pure gas or gas mixtures in a high-vacuum chamber on the surface of a caesiumiodide (CsI) window, cooled by a closed cycle He refrigerator to 10 K. Infrared transmission spectra are usually obtained with a Fourier transform spectrometer at a resolution of 0.5-1 cm-1. Thermal and energetic processing can be simulated by stepwise annealing and microwave-excited hydrogen flow lamps, respectively.
Strong shifts in the peak position, band width and detailed profile occur as a result of dipole interactions between molecules (e.g. compare polar and apolar ices; Sandford et al. 1988; §1). Furthermore, the formation of complexes in ice mixtures, e.g. between CO2 and CH3OH (Ehrenfreund et al. 1998) or between H2O and NH3 (Knacke et al. 1982), was observed to lead to clear spectroscopic signatures. When ices convert from the amorphous to the crystalline state, the crystalline features appear sharper and red-shifted (Fig. 7). For a realistic comparison of interstellar and laboratory ices, the effects of grain size and shape need to be taken into account for the strongest transitions (§5). For this, accurate optical constants are mandatory; these can be measured in the laboratory (Ehrenfreund et al. 1997). Also, the integrated absorption cross sections are measured in the laboratory and have been refined over the last two decades for the most important species (e.g. Gerakines et al. 1995, Kerkhof et al. 1999). By measuring the band intensity of an absorption species in space and dividing it by the integrated absorption cross section measured in the laboratory, the column density of the given ice species in space can be measured to a very high accuracy. Finally, photolysis, radiolysis, and surface chemistry give insights into the basic processes of ice mantle formation, adsorption, diffusion, reaction efficiency and desorption (e.g. Gerakines et al. 1996; Hudson & Moore 1999; Collings et al. 2003; Hiraoka et al. 1998; Watanabe et al. 2003; §6).
3.2. Where are the Ices?
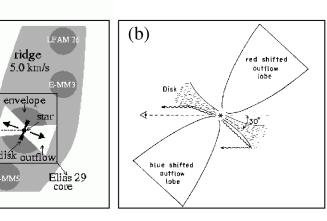
Laboratory study is a valuable tool in determining the formation and processing history of ices. However, understanding the results in an astrophysical context requires knowledge of line of sight conditions. The basic question as to where the ices are located along the pencil beam absorption line of sight is often not easy to answer. On a large scale, ices are present in dense molecular clouds. Within these clouds, different physical conditions and processing histories may exist in the clumpy cloud interior and at the cloud edges. The cloud may also be heated from the interior by shocks and radiation from protostars. In the absorption spectrum, features from ices in protostellar environments may be blended with ice features in foreground clouds. In turn, ices can be present in a variety of locations in both protostellar envelopes and disks. Within the disk, the distance from the disk surface and from the star will influence ice processing. In all these environments, knowledge of the three dimensional structure and orientation with respect to the line of sight is crucial. Infrared and mm-wave imaging can constrain this parameter space. Such combined geometry-ice band studies are complex and have been done for a few sources only. Ices are included in detailed circumbinary envelope models of L1551 : IRS5 in Taurus, combining information over all wavelengths (Osorio et al. 2003). Another example is the Class I protostar Elias 29 in the Oph cloud (Boogert et al. 2002c). Single dish mm-wave observations reveal a large column (corresponding to =20) of foreground material which may harbor most of the ices in this line of sight (Fig. 6). High spatial resolution mm-interferometer observations reveal that some of the ices could be present in an envelope as well, although detailed SED fits imply that this is a rather face-on system and therefore the ice contribution from the envelope and disk is small. Other specific applications of line of sight studies are ices in the envelopes of high mass protostars (§4.1), ices in the edge-on disks of low mass protostars (§4.2), and the special case of ices toward main sequence or evolved stars behind dense clouds, tracing the quiescent cloud medium (§4.3; Whittet et al. 1998).
4. Ices in Different Environments
Valuable information on the composition, formation, and processing history of ices is contained in the shapes of the vibrational mode absorption bands. Here we discuss band profile studies in different classes of sight-lines.
4.1. Ices in the Envelopes around High Mass Protostars

The massive envelopes around high mass protostars have been the focus of ice studies since the ice absorption bands were discovered (Merrill et al. 1976; Knacke et al. 1982; Tielens et al. 1984). These objects are relatively bright in the near-infrared; the visual extinction through the envelopes is very high (), and thus their deep ice bands are easily observable. The knowledge gained from ice band observations toward high mass protostars serves as a template against which the bands in other classes of sight-lines can be compared. It was recognized that variations in the profile of the 3.0 band of H2O can be attributed to varying degrees of crystallization due to heating in the different sight-lines (Smith et al. 1989). Varying abundance ratios of CO in polar and CO in more volatile apolar ices may well be attributed to evaporation in some sight-lines (§1; Tielens et al. 1991). These early indicators of the importance of heating effects on ices were strongly confirmed by observations of the CO2 ice bands by the ISO satellite (Gerakines et al. 1999). Sharp substructures in the bands were related to heated H2O:CO2:CH3OH ices. In these laboratory ices, crystalline H2O structures are formed and the interaction with CO2 is reduced, resulting in narrow substructures (Fig. 7). The combined evidence for ice crystallization, increased gas/solid state ratios, far-infrared color temperatures and detailed mm-wave gas phase observations and models led to the conclusion that the envelopes around massive protostars are progressively heated as a function of time (Boogert et al. 2000b; van der Tak et al. 2000). The evidence for processing is so strong that it has predictive power. For example, distinct variations in the so far unidentified prominent 6.85 absorption band can be related to this processing sequence (§2.3). Also, in future observations of large sets of massive protostars, the ice bands observed in their envelopes may be used as tracers of the evolutionary stage of the protostar. Finally, the knowledge gained from ice band studies toward massive protostars can be applied to low mass protostars (§7).
4.2. Solid CO toward Low Mass Protostars
Observations of ices toward low mass protostars are of special interest. They allow a look back in time to the formation and processing history of solar system ices. The 4.67 band of solid CO is the best studied ice band toward low mass protostars. It was detected toward objects in the Taurus (Whittet et al. 1989; Chiar et al. 1995; Teixeira et al. 1998), Oph (Kerr et al. 1993), Corona Australis (Chiar et al. 1998), and Serpens (Chiar et al. 1994) molecular clouds. A recent, comprehensive M band survey of low mass protostars is presented in Pontoppidan et al. (2003a). Signatures of processing, such as varying ratios of volatile apolar versus less volatile polar CO ices (§1) were seen in these surveys. However, unlike the high mass protostars discussed in §4.1, their significance is harder to assess because of the often poorly characterized lines of sight. The complexity is illustrated in the case-study of the low mass protostar Elias 29 in the Oph cloud (§3.2; Fig. 6). Its ice spectrum is simple, without signs of any kind of processing. Indeed, its disk has a face-on orientation and a large fraction of the ices is likely not directly related to the protostar, but located in foreground clouds. More interesting is the case in which the disk is in an inclined or edge-on orientation.

A few claims of the direct detection of ices in edge-on protostellar disks have been made. Varying degrees of processing are possibly related to different disk inclinations, tracing ices at different distances from the star or from the warm flaring disk surface (Fig. 8). CRBR 2422.8-3422 has an extreme depletion and the deepest observed CO ice band observed so far (Thi et al. 2002). Elias 18 has a very large solid/gas ratio (Shuping et al. 2000). Warm gas and a much lower depletion and low apolar/polar ratio are observed toward L1489 IRS (Boogert et al. 2002b). Finally a highly processed CO band with an accompanying XCN band is seen in RNO 91 (Weintraub et al. 1994; Fig. 6).
4.3. Ices in Quiescent Lines of Sight
Field stars located behind dense molecular material provide an invaluable resource for probing the properties of icy mantles in quiescent regions of molecular clouds (Whittet et al. 1998). Ices toward such objects are not exposed to the dramatic radiation and temperature excursions that can occur in the close environment of high and low mass stars. Indeed, as expected, and in contrast to many protostellar sight-lines, the spectra of field stars show large apolar CO abundances (Chiar et al. 1995), amorphous H2O ice bands (Smith et al. 1989), and no 4.62 OCN- band (Tegler et al. 1995). The presence of the 4.27 CO2 band as well as the 3.47 band indicates that the energetics of a nearby protostar is not necessary to produce the carrier of these features (Chiar et al. 1996; Whittet et al. 1998). This does however not exclude molecule production by cosmic rays, which can penetrate deep into the cloud (Whittet et al. 1998). The meaning of the absence of CH3OH in the direction of field stars (Chiar et al. 1996) is hard to assess because of the limited number of observed field stars and the absence of CH3OH in many protostellar lines of sight as well. A significant limitation of studying ices toward field stars is the presence of a multitude of photospheric features in the spectra of these often evolved stars. While the analysis of ice bands often gains from increased spectral resolution, this is not the case for the very complex spectra of these field stars. The well known examples Elias 16 behind the Taurus cloud and CK 2 behind Serpens are both K giants. However, some early type main sequence stars are known as well, e.g. Elias 25 (Shenoy et al. 2003; Shuping et al. 2000). This line of sight intersects the edge of a molecular cloud, with a well known UV field from a nearby star and allows to study the effect of UV processing.
5. Isotopes in Ices and the Shape of Interstellar Grains
Highly valuable information can be obtained from the band profiles of isotopes in the ices. Weak bands of 13CO2 (de Graauw et al. 1996; d’Hendecourt et al. 1996) and 13CO (Boogert et al. 2002a) are the only signatures of isotopes detected in interstellar ices so far. These bands are of particular interest because they give crucial additional constraints to the composition of ice mantles. For example, a complication in comparing interstellar and laboratory spectra is the effect of interstellar grain shape on the band profile. The profile of strong absorption bands changes drastically as a result of resonances between the molecular dipoles and ice charge polarization induced by external radiation fields (e.g. Bohren & Huffman 1982). Thus the absorption band profiles of 12CO and 12CO2 are highly dependent on the adopted grain shape if their concentration in the ice is larger than 30%. Due to the large isotope ratios (12C/13C=50-100; Wilson & Rood 1994; Boogert et al. 2000b) the 13C equivalents are always strongly diluted in the ices and particle shape effects are negligible. Laboratory spectra can therefore directly be compared with the interstellar observations. Toward the massive protostar NGC 7538 : IRS9 it was found that both 12CO and 13CO trace surprisingly pure CO ices, a conclusion that is now confirmed in many other lines of sight (Pontoppidan et al. 2003a). The peak position and width of the 12CO band require the icy grains to have a ‘CDE-type’ (continuous distribution of ellipsoids) grain shape distribution. This may well represent irregularly shaped grains. Indeed, a similar grain shape is required in order to fit the interstellar 12CO2 and 13CO2 band profiles (Gerakines et al. 1999; Boogert et al. 2000b).
Finally, the band of a third isotope, crystalline HDO at 4.1 , was claimed in interstellar spectra (Teixeira et al. 2000). In a re-analysis of the data, this feature was considered to be an artifact in the NGC 7538 : IRS9 line of sight, but confirmed in others (Dartois et al. 2003). However, this feature originates from CH3OH and not HDO. HDO remains undetected in low mass protostars as well, with significant abundance upper limits (Parise et al. 2003).
6. Tracing Chemistry on Dust Surfaces
Physical processes, such as evaporation and crystallization, lead to clear spectroscopic signatures that indeed are observed toward protostars (§4). What is the observational evidence for chemical processes, such as formation of molecules on cold grain surfaces or by energetic reactions induced by UV photons or cosmic rays?
6.1. Grain Surface Chemistry
Astrochemical theories indicate that only a few classes of low-temperature grain-surface chemical reactions are necessary to form most of the molecules observed in ices (e.g., Allen & Robinson 1977; Tielens & Charnley 1997; Herbst 2000). Fully stochastic treatments to model surface diffusion and surface reactions are commonly applied (e.g. Charnley 2001). Water (H2O), methane (CH4), ammonia (NH3), and hydrogen sulphide (H2S) are readily produced by exothermic H additions to O, C, N, and S atoms. Indeed, the high H2O ice abundance in molecular clouds ( with respect to ) can only be produced by such efficient grain surface reactions. The abundance of other hydrogenated species is however low, indicating that the presently observed ices originate from a phase with relatively low atomic and high molecular abundances. For example, the solid CH4 column is only 1% of that of H2O and at the time of its formation most of the C must have been locked up in CO. The origin of CH4 on grains, like H2O, is supported by its low gas/solid ratio (Boogert et al. 1998) and its presence in the polar H2O–rich ice phase. Similarly, the low NH3 abundance (§2.2) may well indicate that at the time of grain mantle formation most of the N is locked up in N2.
Within the same picture, hydrogenation of CO was suggested (e.g., Tielens & Charnley 1997; Caselli et al. 2002) to be the source of the solid methanol seen in many lines of sight towards protostars (CH3OH/H2O=5–25%; Dartois et al. 1999; Pontopiddan et al. 2003b). Indeed, the intimate mix of solid CH3OH with H2O and CO2 required to explain the CO2 bending mode (Fig. 7) supports this. In this picture, the large variations of solid CH3OH abundances in different sight-lines reflect variations in the atomic H abundances at the time of CH3OH formation. However, the grain surface origin of CH3OH is not fully established. For example, its absence in many lines of sight may indicate that specific conditions, and perhaps chemical mechanisms other than grain surface chemistry are required for CH3OH production. An independent indicator of its origin comes from the D/H ratio. Both methanol and formaldehyde (H2CO) observed in protostellar cores have large D/H ratios, indicating formation of these species at low temperature ( K; Loinard et al. 2000; Parise et al. 2002). Low temperature gas phase chemistry can however also be responsible (Roberts & Millar 2000; Ceccarelli et al. 2002), and currently CH3OH formation is not fully understood. Finally, initial experimental reports that hydrogenation of CO could produce methanol at low temperatures (Hiraoka et al. 1994; 1998) are strongly supported by Watanabe et al. (2002, 2003) and discarded by other studies (Hiraoka et al. 2002).
While the light H and D atoms can saturate CO by tunneling through the activation barrier (Tielens & Hagen 1982; Tielens 1983), the addition of heavier atoms to a closed-shell molecule such as CO is much harder. The current knowledge on activation barriers is scarce, and thus this pathway is not well established. Only recently atomic reactions on analogue surfaces have been studied in detail (e.g., Hiraoka et al. 1998; Pirronello et al. 1999). However, it was realized that in interstellar space even a reaction barrier does not inhibit heavy atoms to react with CO. This is because reactions in space are diffusion rather than reaction limited (Tielens & Charnley 1997). Thus appreciable amounts of CO2 can be formed by O addition to CO on cold grain surfaces (Tielens & Hagen 1982).
A separate way to trace chemical history is by measuring isotope ratios. In one line of sight 12CO/13CO ratios of 71 (3) and 77 were deduced in the solid and gas phase respectively, comparable to the solid 12CO2/13CO2 ratio of 80 (Boogert et al. 2002a). This indicates that CO2 originates from oxidation reactions of existing CO rather than from gas phase C, which would have almost certainly led to large 12CO2/13CO2 fractionation.
Finally, while grain surface chemistry can efficiently produce many molecules, it was of small influence during the formation of apolar ices. Recent high resolution studies of solid CO have provided new insights into the nature of apolar ices (Boogert et al. 2002a, 2002b; Pontoppidan et al. 2003a). Most remarkable is the great similarity of the band profiles in many lines of sight and the purity of the CO ice in all these environments (§5). At a particular stage in the molecular cloud evolution simple CO ices are formed rather than complex mixtures with other apolar species such as O2 or CO2 (‘dirty’ ices). Presumably at this stage all oxygen is depleted already. The conditions and time scale at which pure CO ice is formed may be traced back in the band profile. Most sight-lines show besides the ‘classic’ narrow central peak and broad red wing of apolar and polar CO components (§1; §4.2), a newly discovered blue wing as well. This wing, visible in the presence of linearly polarized light, may indicate that CO is present in a largely crystalline phase, reflecting its formation history (Pontoppidan et al. 2003a).
6.2. Energetic Processing
Interstellar ices are potentially subject to processing by photons and particles in a wide energy range. In marked contrast to the amount of effort expended in trying to model surface reactions, there has been almost no theoretical modeling of the kinetics associated with the photolysis or radiolysis of the bulk ice mantle (however, see Ruffle & Herbst 2001; Woon 2002). In contrast, energetic processing of ices has historically enjoyed the attention of experimental groups.
Simply warming of ices initially formed by cold grain surface chemistry is sufficient to significantly alter the chemical composition. For example, CO2 is efficiently produced in CO:H2O mixtures once warmed enough to surpass the small activation energy barrier needed to oxidize CO to form CO2 (e.g. Roser et al. 2001; however, see §6.1). Heating of ice mixtures can also result in complex molecule formation. For example polymerization of H2CO in a mixture with NH3 forms polyoxymethylene (POM; (-CH2-O-)n; Schutte et al. 1993). Finally, the ion NH is produced after heating the acid/base mixture of NH3 and HCOOH (Schutte & Khanna 2003; §2.2).
More energetic forms of processing, such as UV photolysis (e.g., Gerakines et al. 1996) and proton irradiation (radiolysis; e.g. Moore & Hudson 1998) of bulk ices, have been extensively studied in the laboratory. These efficiently produce radicals, leading to complex species. In principle cosmic rays can have a significant influence on interstellar ices, because they can penetrate through clouds and ice surfaces and thus modify structure and composition of icy particles, including sputtering of the particle surfaces (Cottin et al. 2001). For example, radiolysis of H2O/CO ice mixtures can produce high abundances of H2CO and CH3OH (Hudson & Moore 1999), although HCOOH is over-produced relative to the HCOOH/CH3OH observed in interstellar ices. Radiolysis of ice mixtures containing CO and C2H2 also produces ethane, as well as several other putative mantle molecules such as CH3CHO and C2H5OH (Hudson & Moore 1997; Moore & Hudson 1998). A main concern of these experiments is that more species are produced than can be accounted for in the interstellar ices.
One interstellar molecule that does likely originate in energetically processed ices is the carrier of the so-called 4.62 ‘XCN’ absorption feature, observed in many sources (e.g., Tegler et al. 1995; Pendleton et al. 1999). Laboratory experiments indicate that ‘XCN’ is produced both by photolysis (Lacy et al. 1984; Bernstein et al. 2000) and by radiolysis (Hudson & Moore 2000; Palumbo et al. 2000). At present, the best candidate for the identity of this carrier appears to be the OCN- ion, formed in a solid state acid-base reaction between NH3 and isocyanic acid (HNCO; see Novozamsky et al. 2001 and references therein).
The identification of the 4.62 band as a result of energetic processing offers the possibility to find other energetically produced species by correlation studies. Gibb & Whittet (2000) find that the excess absorption in the 6.0 band, i.e. the fraction not caused by the H2O bending mode, correlates with the 4.62 band depth. It is argued that organic refractory matter (ORM), the residue of heavily processed simple ices, is responsible for the 6.0 excess absorption, rather than HCOOH and H2CO (§2.4; Schutte et al. 1996). At present, this identification needs further study. Unfortunately, as argued in §2.2, specific detection of complex species in the ices is hindered by the weakness of the features and confusion limitations. Such complex species may be better studied indirectly by their rotational transitions at radio wavelengths, after they have evaporated from the grains in the warm regions surrounding protostars.
Overall we do conclude, however, that energetic processing appears to be of small influence on the ices. The spectra of all protostars are dominated by the absorption bands of simple species, that likely have been produced by cold grain surface reactions. Furthermore, high-mass stars do not show significantly different ice signatures compared to low-mass stars. Photolytic processing of ices apparently only has limited influence on the ice chemistry due to the strongly attenuated UV irradiation in dense clouds.
7. Conclusions and Future
Increasingly sensitive observations of interstellar ices have revealed several prominent, and often unexpected, trends, providing clues to the evolutionary pathway of interstellar to solar system ices. One such trend is the remarkable simplicity of the interstellar ice spectrum. Ices consist mostly of simple species, likely the result of atomic O and H addition reactions on dust surfaces. A stable balance between some of these reactions is reflected in the remarkably constant solid CO2/H2O abundance ratio (17%) throughout the Galaxy and the commonly observed intimate mix of these species with CH3OH. The solid CO band reflects an entirely different ice formation environment, but again shows little compositional variation throughout the Galaxy. This apolar ice phase is remarkably CO–rich. The similarity of ice composition in sight-lines sampling a variety of environments proves that to first order the production of complex species by energetic processing of simple ices is minor. However, at a low level energetic processing can presently not be excluded. Perhaps the variations of CH3OH and ‘XCN’ abundances, and the ‘6.0 excess’ (Gibb & Whittet 2002) are linked to locally increased photon or cosmic ray fluxes. If organic residues indeed form from ices, the inefficiency of energetic processing in dense clouds requires that multiple cycling of grains between the dense and diffuse interstellar medium takes place (Greenberg et al. 2000). Finally, although energetic processing is weak, the effects of thermal processing of ices, i.e. evaporation, crystallization and segregation, are commonly observed. In fact, ice bands can serve as tracers of the thermal history of circumstellar environments.
Many key issues on the formation and evolution of interstellar ices are still poorly known, however. In order to finally understand interstellar ice evolution a concerted effort is required, involving a variety of observational and laboratory techniques and related theory projects. Astronomical spectra sample different grain populations in one line of sight. Line of sight conditions need to be determined from complementary information, including radio observations of gas phase species and imaging of the star-forming region. Particularly exciting is the prospect of studying the properties of ices in disks that are well characterized by millimeter-wave interferometry (CARMA, ALMA, SMA) and infrared ro-vibrational CO line studies (Boogert et al. 2002b, Najita et al. 2003). Also, study of ice features in lines of sight with known UV radiation fields will shed more light on the importance of energetic processing of ices (e.g. Shenoy et al. 2003).
The importance of high spectral resolution in the infrared to separate weak, blended ice bands and gas and telluric lines, cannot be overstated. Such instruments are now available on large ground based telescopes like Keck and VLT. In spectral regions severely hindered by the earth atmosphere, such as the important 5-8 region, high spectral resolution will be provided by spectrometers mounted on the airborne SOFIA observatory. Further in the future the planned JWST and proposed ABE missions will become guaranteed milestones in the area of interstellar ices. For example, these instruments allow an improved assessment of the significance of the apolar species N2 and O2 in the ices. Also, they will be a major leap forward in the continued search for the weak signatures of energetic processing.
In the near future, sensitive space based observations will be possible with the SIRTF/IRS spectrometer. Its spectral resolution is limited (Fig. 2), but, in particular for the CO2 bending mode, sufficient for detailed laboratory analysis tracing thermal processing and molecular complexity toward large samples of low mass protostars (Fig. 7). Linking the CO2 analysis with ground based observations of CH3OH is needed to understand the chemical history of this molecule and the large abundance fluctuations in different sight-lines. This is of particular interest because CH3OH is a starting point of complex molecule formation.
Finally, continued laboratory work will provide much needed chemical reaction efficiencies in astrophysically relevant environments. Laboratory simulations are also necessary to determine the microscopic structure of interstellar ices, which regulates key processes such as outgassing (e.g. Jenniskens & Blake 1996) and coagulation behavior (e.g. Chokshi et al. 1993). Perhaps related to this is the question why the interstellar ice bands are best fit with a ‘CDE’-type shape distribution (§5)? Other major issues that have to be settled in the laboratory include the presence of PAH molecules and ions in ices (Gudipati & Allamandola 2003), the identification of the 6.85 band, and the physical interaction between the components of inhomogeneous ices (Collings et al. 2003).
Acknowledgments.
We thank J. V. Keane for kindly providing Fig. 5, G. A. Blake for collaboration in the production of Fig. 8, T. Y. Brooke and an anonymous referee for carefully reading this manuscript. The research of A.C.A.B. is supported by the SIRTF Legacy Science program and by the Owens Valley Radio Observatory through NSF AST-9981546.
References
Allamandola, L. J., Sandford, S. A., Tielens, A. G. G. M., & Herbst, T. M. 1992, ApJ, 399, 134
Allen, M. & Robinson, G. W. 1977, ApJ, 212, 396
Bates, D. R., & Spitzer, L. J. 1951, ApJ, 113, 441
Benson, P. J., & Myers, P. C. 1989, ApJS, 71, 89
Bergin, E.A., Neufeld, D.A., & Melnick, G.J. 1998, ApJ, 499, 777
Bernstein, M. P., Sandford, S. A., & Allamandola, L. J. 2000, ApJ, 542, 894
Bohren, C.F., Huffman, D.R., 1983, Absorption and Scattering of Light by Small Particles. John Wiley & Sons, New York, ch. 5
Boogert, A. C. A. et al. 1996, A&A, 315, L377
Boogert, A. C. A., Schutte, W. A., Helmich, F. P., Tielens, A. G. G. M., & Wooden, D. H. 1997, A&A, 317, 929
Boogert, A. C. A., Helmich, F. P., van Dishoeck, E. F., Schutte, W. A., Tielens, A. G. G. M., & Whittet, D. C. B. 1998, A&A, 336, 352
Boogert, A. C. A., Tielens, A. G. G. M., Ceccarelli, C., Boonman, A. M. S., van Dishoeck, E. F., Keane, J. V., Whittet, D. C. B., & de Graauw, T. 2000a, A&A, 360, 683
Boogert, A. C. A. et al. 2000b, A&A, 353, 349
Boogert, A. C. A., Blake, G. A., & Tielens, A. G. G. M. 2002a, ApJ, 577, 271
Boogert, A. C. A., Hogerheijde, M. R., & Blake, G. A. 2002b, ApJ, 568, 761
Boogert, A. C. A., Hogerheijde, M. R., Ceccarelli, C., Tielens, A. G. G. M., van Dishoeck, E. F., Blake, G. A., Latter, W. B., & Motte, F. 2002c, ApJ, 570, 708
Boogert, A.C.A., Blake, G.A., & Oberg, K. 2003, ApJL, in prep.
Boudin, N., Schutte, W. A., & Greenberg, J. M. 1998, A&A, 331, 749
Brooke, T. Y., Sellgren, K., & Smith, R. G. 1996, ApJ, 459, 209
Brown, P.D., & Charnley, S.B. 1990, MNRAS, 244, 432
Caselli, P., Stantcheva, T., Shalabiea, O., Shematovich, V. I., & Herbst, E. 2002, Planetary and Space Science, 50, 1257
Ceccarelli, C., Vastel, C., Tielens, A. G. G. M., Castets, A., Boogert, A. C. A., Loinard, L., & Caux, E. 2002, A&A, 381, L17
Charnley, S. B. 2001, ApJ, 562, L99
Charnley, S.B., Rodgers, S.D., & Ehrenfreund, P. 2001, A&A, 378, 1024
Charnley, S.B., Tielens, A.G.G.M., & Millar, T.J. 1992, ApJ, 399, L71
Chiar, J. E., Adamson, A. J., Kerr, T. H., & Whittet, D. C. B. 1994, ApJ, 426, 240
Chiar, J. E., Adamson, A. J., Kerr, T. H., & Whittet, D. C. B. 1995, ApJ, 455, 234
Chiar, J. E., Adamson, A. J. & Whittet, D. C. B. 1996, ApJ, 472, 665
Chiar, J. E., Gerakines, P. A., Whittet, D. C. B., Pendleton, Y. J., Tielens, A. G. G. M., Adamson, A. J., & Boogert, A. C. A. 1998, ApJ, 498, 716
Chiar, J. E., Tielens, A. G. G. M., Whittet, D. C. B., Schutte, W. A., Boogert, A. C. A., Lutz, D., van Dishoeck, E. F., & Bernstein, M. P. 2000, ApJ, 537, 749
Chokshi, A., Tielens, A. G. G. M., & Hollenbach, D. 1993, ApJ, 407, 806
Collings, M. P., Dever, J. W., Fraser, H. J., McCoustra, M. R. S., & Williams, D. A. 2003, ApJ, 583, 1058
Cottin, H., Gazeau, M., Chaquin, P., Raulin, F., & Bénilan, Y. 2001, Journal of Geophysical Research, 106, 33325
Dartois, E., d’Hendecourt, L., Boulanger, F., Jourdain de Muizon, M., Breitfellner, M., Puget, J.-L., & Habing, H. J. 1998, A&A, 331, 651
Dartois, E., Schutte, W., Geballe, T. R., Demyk, K., Ehrenfreund, P., & d’Hendecourt, L. 1999, A&A, 342, L32
Dartois, E. & d’Hendecourt, L. 2001, A&A, 365, 144
Dartois, E., d’Hendecourt, L., Thi, W., Pontoppidan, K. M., & van Dishoeck, E. F. 2002, A&A, 394, 1057
Dartois, E., Thi, W.-F., Geballe, T. R., Deboffle, D., d’Hendecourt, L., & van Dishoeck, E. 2003, A&A, 399, 1009
de Graauw, T. et al. 1996, A&A, 315, L345
d’Hendecourt, L. et al. 1996, A&A, 315, L365
Dickens, J.E., Langer, W.D., & Velusamy, T. 2001, ApJ, 558, 693
Ehrenfreund, P., Boogert, A. C. A., Gerakines, P. A., Tielens, A. G. G. M., & van Dishoeck, E. F. 1997, A&A, 328, 649
Ehrenfreund, P., Dartois, E., Demyk, K., & d’Hendecourt, L. 1998, A&A, 339, L17
Ehrenfreund, P. et al. 1999, A&A, 350, 240
Ehrenfreund, P., & Schutte, W.A., 2000, Infrared Observations of Interstellar Ices. In: Minh Y.C., van Dishoeck E.F. (eds.) Astrochemistry: From Molecular Clouds to Planetary Systems, Proceedings of IAU Symposium 197, p. 135
Ehrenfreund, P., & Fraser, H., 2003, Ice Chemistry in Space. In: Pirronello V., Krelowski J. (eds.) Solid State Astrochemistry, NATO ASI Series, Kluwer Academic Publ., in press
Geballe, T. R., Baas, F., Greenberg, J. M., & Schutte, W. 1985, A&A, 146, L6
Gerakines, P. A., Schutte, W. A., Greenberg, J. M., & van Dishoeck, E. F. 1995, A&A, 296, 810
Gerakines, P. A., Schutte, W. A., & Ehrenfreund, P. 1996, A&A, 312, 289
Gerakines, P. A. et al. 1999, ApJ, 522, 357
Gibb, E. L. et al. 2000, ApJ, 536, 347
Gibb, E. L. & Whittet, D. C. B. 2002, ApJ, 566, L113
Gillett, F. C. & Forrest, W. J. 1973, ApJ, 179, 483
Greenberg, J. M. et al. 2000, ApJ, 531, L71
Gudipati, M. S. & Allamandola, L. J. 2003, ApJ, 596, L195
Hagen, W., Greenberg, J. M., & Tielens, A. G. G. M. 1983, A&A, 117, 132
Herbst, E. 2000, Astrochemistry: From Molecular Clouds to Planetary, 197, 147
Hiraoka, K., Ohashi, N., Kihara, Y., Yamamoto, K., Sato, T., & Yamashita, A. 1994, Chem. Phys. Lett., 229, 408
Hiraoka, K., Miyagoshi, T., Takayama, T., Yamamoto, K., & Kihara, Y. 1998, ApJ, 498, 710
Hiraoka, K., Sato, T., Sato, S., Sogoshi, N., Yokoyama, T., Takashima, H., & Kitagawa, S. 2002, ApJ, 577, 265
Hudson, R. L. & Moore, M. H. 1997, Icarus, 126, 233
Hudson, R. L. & Moore, M. H. 1999, Icarus, 140, 451
Hudson, R. L. & Moore, M. H. 2000, A&A, 357, 787
Jenniskens, P. & Blake, D. F. 1996, ApJ, 473, 1104
Keane, J. V., Tielens, A. G. G. M., Boogert, A. C. A., Schutte, W. A., & Whittet, D. C. B. 2001, A&A, 376, 254
Kerkhof, O., Schutte, W. A., & Ehrenfreund, P. 1999, A&A, 346, 990
Kerr, T. H., Adamson, A. J., & Whittet, D. C. B. 1993, MNRAS, 262, 1047
Knacke, R. F., McCorkle, S., Puetter, R. C., Erickson, E. F., & Kraetschmer, W. 1982, ApJ, 260, 141
Lacy, J. H., Baas, F., Allamandola, L. J., van de Bult, C. E. P., Persson, S. E., McGregor, P. J., Lonsdale, C. J., & Geballe, T. R. 1984, ApJ, 276, 533
Lacy, J. H., Carr, J. S., Evans, N. J., Baas, F., Achtermann, J. M., & Arens, J. F. 1991, ApJ, 376, 556
Lacy, J. H., Faraji, H., Sandford, S. A., & Allamandola, L. J. 1998, ApJ, 501, L105
Loinard, L., Castets, A., Ceccarelli, C., Tielens, A. G. G. M., Faure, A., Caux, E., & Duvert, G. 2000, A&A, 359, 1169
Manico, G., Raguni, G., Pirronello, V., Roser, J.E., & Vidali, G. 2001, ApJ, 548, 253
Markwick, A.J., Millar, T.J., & Charnley, S.B. 2000, ApJ, 535, 256
Merrill, K. M., Russell, R. W., & Soifer, B. T. 1976, ApJ, 207, 763
Moore, M. H. & Hudson, R. L. 1998, Icarus, 135, 518
Mumma, M. J., DiSanti, M. A., Dello Russo, N., Magee-Sauer, K., Gibb, E., & Novak, R. 2003, Advances in Space Research, in press
Novozamsky, J. H., Schutte, W. A., & Keane, J. V. 2001, A&A, 379, 588
Nummelin, A., Whittet, D.C.B., Gibb, E., Gerakines, P.A., Chiar, J.E. 2001, ApJ, 558, 185
Osorio, M., D’Alessio, P., Muzerolle, J., Calvet, N., & Hartmann, L. 2003, ApJ, 586, 1148
Palumbo, M. E., Geballe, T. R., & Tielens, A. G. G. M. 1997, ApJ, 479, 839
Palumbo, M. E., Pendleton, Y. J., & Strazzulla, G. 2000, ApJ, 542, 890
Parise, B. et al. 2002, A&A, 393, L49
Parise, B., Simon, T., Caux, E., Dartois, E., Ceccarelli, C., Rayner, J., & Tielens, A. G. G. M. 2003, ArXiv Astrophysics e-prints, 9401
Pendleton, Y. J., Tielens, A. G. G. M., Tokunaga, A. T., & Bernstein, M. P. 1999, ApJ, 513, 294
Pendleton, Y. J. & Allamandola, L. J. 2002, ApJS, 138, 75
Pirronello, V., Liu, C., Roser, J. E., & Vidali, G. 1999, A&A, 344, 681
Pontoppidan, K. M. et al. 2003a, A&A, 408, 981
Pontoppidan, K. M., Dartois, E., van Dishoeck, E. F., Thi, W.-F., & d’Hendecourt, L. 2003b, A&A, 404, L17
Puetter, R. C., Russell, R. W., Willner, S. P., & Soifer, B. T. 1979, ApJ, 228, 118
Roberts, H. & Millar, T. J. 2000, A&A, 364, 780
Roser, J. E., Vidali, G., Manicò, G., & Pirronello, V. 2001, ApJ, 555, L61
Ruffle, D. P. & Herbst, E. 2001, MNRAS, 322, 770
Sandford, S. A., Allamandola, L. J., Tielens, A. G. G. M., & Valero, G. J. 1988, ApJ, 329, 498
Sandford, S. A., Allamandola, L. J., & Geballe, T. R. 1993, Science, 262, 400
Sandford, S. A., Bernstein, M. P., Allamandola, L. J., Goorvitch, D., & Teixeira, T. C. V. S. 2001, ApJ, 548, 836
Schutte, W. A., Allamandola, L. J., & Sandford, S. A. 1993, Icarus, 104, 118
Schutte, W. A. et al. 1996, A&A, 315, L333
Schutte, W. A. et al. 1999, A&A, 343, 966
Schutte, W. A. & Khanna, R. K. 2003, A&A, 398, 1049
Sellgren, K., Smith, R. G., & Brooke, T. Y. 1994, ApJ, 433, 179
Shenoy, S. S., Whittet, D. C. B., Chiar, J. E., Adamson, A. J., Roberge, W. G., & Hassel, G. E. 2003, ApJ, 591, 962
Smith, R. G., Sellgren, K., & Tokunaga, A. T. 1989, ApJ, 344, 413
Taban, I. M., Schutte, W. A., Pontoppidan, K. M., & van Dishoeck, E. F. 2003, A&A, 399, 169
Tegler, S. C., Weintraub, D. A., Rettig, T. W., Pendleton, Y. J., Whittet, D. C. B., & Kulesa, C. A. 1995, ApJ, 439, 279
Teixeira, T. C., Devlin, J. P., Buch, V., & Emerson, J. P. 1999, A&A, 347, L19
Teixeira, T. C., Emerson, J. P., & Palumbo, M. E. 1998, A&A, 330, 711
Tielens, A.G.G.M., & Hagen, W. 1982, A&A, 114, 245
Tielens, A. G. G. M. 1983, A&A, 119, 177
Tielens, A. G. G. M., Allamandola, L. J., Bregman, J., Goebel, J., Witteborn, F. C., & Dhendecourt, L. B. 1984, ApJ, 287, 697
Tielens, A.G.G.M., & Allamandola, L.J., 1987, Composition and Chemistry of Interstellar Dust. In: Hollenbach D.J., Thronson H.A. (eds.) Interstellar Processes. Reidel, Dordrecht, p. 397
Tielens, A. G. G. M., Tokunaga, A. T., Geballe, T. R., & Baas, F. 1991, ApJ, 381, 181
Tielens, A. G. G. M. & Charnley, S. B. 1997, Origins of Life and Evolution of the Biosphere, 27, 23
Vandenbussche, B. et al. 1999, A&A, 346, L57
van der Tak, F. F. S., van Dishoeck, E. F., Evans, N. J., & Blake, G. A. 2000, ApJ, 537, 283
Watanabe, N. & Kouchi, A. 2002, ApJ, 571, L173
Watanabe, N., Shiraki, T., & Kouchi, A. 2003, ApJ, 588, L121
Weintraub, D. A., Tegler, S. C., Kastner, J. H., & Rettig, T. 1994, ApJ, 423, 674
Wilson, T. L. & Rood, R. 1994, ARA&A, 32, 191
Whittet, D. C. B., Adamson, A. J., Duley, W. W., Geballe, T. R., & McFadzean, A. D. 1989, MNRAS, 241, 707
Whittet, D. C. B. et al. 1996, ApJ, 458, 363
Whittet, D. C. B. et al. 1996, A&A, 315, L357
Whittet, D. C. B. et al. 1998, ApJ, 498, L159
Willacy, K., & Millar, T.J. 1998, MNRAS, 298, 562
Woon, D. E. 2002, ApJ, 571, L177