Detection of hard X-ray emission from the Galactic nuclear region with INTEGRAL 111Based on observations with INTEGRAL, an ESA project with instruments and science data centre funded by ESA member states (especially the PI countries: Denmark, France, Germany, Italy, Switzerland, Spain), Czech Republic and Poland, and with the participation of Russia and the USA.
Abstract
This Letter presents the first results of an observational campaign to study the Galactic center with INTEGRAL, the Internaltional Gamma-Ray Astrophysics Laboratory. Mosaicked images were constructed using data obtained with ISGRI, the soft gamma-ray instrument of the coded aperture IBIS imager, in the energy ranges 20–40 and 40–100 . These give a yet unseen view of the high-energy sources of this region in hard X-rays and gamma-rays with an angular resolution of 12′ (FWHM). We report on the discovery of a source, IGR J1745.6–2901, coincident with the Galactic nucleus Sgr A∗ to within 0 ′ .9. Located at R.A.(J2000.0) = , decl.(J2000.0) = , the source is visible up to about 100 with a 20–100 luminosity at 8 of . Although the new INTEGRAL source cannot unequivocally be associated to the Galactic nucleus, this is the first report of significant hard X-ray emission from within the inner 10′ of the Galaxy and a contribution from the Galactic supermassive black hole itself cannot be excluded.
Subject headings:
black hole physics — Galaxy: center — Galaxy: nucleus — gamma-rays: observations — stars: neutron — X-rays: binaries1. Introduction
From the prediction of the existence of a massive, compact source at the center of the Milky Way by Lynden-Bell & Rees (1971) to the discovery of such a source in the radio domain 3 years later by Balick & Brown (1974), and to the first detection of soft X-rays unmistakably attributable to it by Chandra in 1999 (Baganoff et al. , 2003), the supermassive black hole candidate Sgr A∗ and the Galactic center (GC) region as a whole have been put under intense scrutiny for many years from radio wavelengths to gamma-rays. This has led to several discoveries, and advances in our understanding of the processes and interactions at the heart of the Milky Way. For example, it is now known that the soft X-ray emission (10 ) in the central 10′ is heavily dominated by diffuse emission due primarily to hot gas (Koyama et al. , 1996; Sidoli & Mereghetti , 1999), and that only about 10% of the total emission in this energy range can be accounted for by X-ray point sources brighter than (Muno et al. 2003a, ). Also, the contribution of point sources in this domain is about the same along the Galactic ridge as it is in the GC (Ebisawa et al. , 2001).
The Galactic nuclear region consists of six primary components that give rise to an array of complex phenomena through their mutual interactions. These constituents are: Sgr A∗, a supermassive black hole with a mass of around (Schödel et al. , 2002; Ghez et al. 2003a, ); the surrounding cluster of evolved and young stars; ionized gas streamers, some of which form a three armed spiral centered on Sgr A∗ known as Sgr A West; a molecular dusty ring surrounding Sgr A West; diffuse hot gas; and a powerful supernova-like remnant known as Sgr A East (Melia & Falcke , 2001). Furthermore, both the IR and the X-ray point source populations decreases in spatial density approximately as , where is the distance from the GC (Serabyn & Morris , 1996; Muno et al. 2003a, ).
The first imaging observations of the GC in hard X-rays were performed by the X-ray telescope on Spacelab 2 in the range 2.5–20 with an angular resolution of 3′. A source located within 1′ .1 of Sgr A∗ was detected (Skinner et al. , 1987). Such a source was also detected by ART-P (8–20 ) on the Granat satellite in 1990-1991 (Pavlinsky et al. , 1994). At energies above 20 , only the coded mask instrument SIGMA/Granat, sensitive to energies above 35 , provided imaging capability with a 20′ angular resolution, allowing an exploration of the dense GC region. In spite of the deep SIGMA survey of the central parts of the galaxy performed between 1990 and 1997, only upper limits were set for the hard X- and gamma-ray emission from the neighborhood of Sgr A∗ at energies above 35 (Goldwurm et al. , 1994; Goldoni et al. , 1999). The derived low bolometric luminosity of the Galactic nucleus (GN), in contrast with the powerful output from active galactic nuclei or black hole binaries, has motivated the developement of several models for radiatively inefficient accretion onto or ejection from Sgr A∗. These models have been widely applied to other accreting systems (Melia & Falcke , 2001).
A recent breakthrough discovery by Chandra and XMM-Newton is that Sgr A∗ is the source of powerful X-ray flares (Baganoff et al. , 2001; Goldwurm et al. 2003a, ; Porquet et al. , 2003) during which the soft X-ray luminosity can increase by factors of 50–180 over a period of up to 3 hr. Some of these X-ray flares feature a significant hardening of the spectrum up to photon indices of 1. Furthermore, a very recent discovery with the Very Large Telescope NAOS/CONICA imager (Genzel et al. , 2003) and the Keck telescope (Ghez et al. 2003b, ), is that Sgr A∗ is also the source of frequent IR flares. This activity could indicate the presence of an important population of non-thermal electrons in the vicinity of the black hole. These results have raised great interest in the possibility of observing hard X-rays from the GN, a measure of which may particularly shed light on the relative role of accretion and ejection in the Sgr A∗ system.
This Letter presents preliminary results of an observation campaign to study the GC at high energies with INTEGRAL, the Internaltional Gamma-Ray Astrophysics Laboratory, performed during the INTEGRAL Galactic Center Deep Exposure (GCDE) program in the spring of 2003. The focus is set on the inner 10′–15′ of the Galaxy and, more particularly, on the detection of a significant excess in this region. The results are based on data obtained with the INTEGRAL Soft Gamma-Ray Imager (ISGRI), the low-energy camera of the main Imager on Board the INTEGRAL Satellite (IBIS), proven to be accurate between 20 and 200 . The morphology of the central 2∘ in the 20–100 band and the derived positions of closeby high-energy sources are briefly discussed to elucidate the experimental context from which the results on the central source are drawn.
2. Observations and Results
INTEGRAL (Winkler , 2003) is a European Space Agency observatory that began its mission on 2002 October 17 carrying four instruments. These consist of two main ones, IBIS (Ubertini et al. , 2003) and SPI, the Spectrometer on INTEGRAL (Vedrenne et al. , 2003); and two monitors, JEM-X (Lund et al. , 2003) and OMC (Mas-Hesse et al. , 2003).
The IBIS coded mask instrument is characterized by a wide field of view (FOV) of , ( fully coded), a point spread function (PSF) of 12′ (FWHM), and a sensitivity over the energy range between 15 and 8 . This sensitivity is achieved via two detector layers: ISGRI (Lebrun et al. , 2003), an upper CdTe layer sensitive between 15 and 1 with peak sensitivity between 15 and 200 , and PICsIT a bottom CsI layer, sensitive between 200 and 8 .
We have analyzed IBIS/ISGRI data collected between 2003 February 28 and May 1 in a series of fixed pointings lasting about 37 minutes each. These include all GCDE data for which the pointings include the GN (), and two Target of Opportunity observations (). Data reduction was performed using the standard OSA 2 INTEGRAL Science Data Center analysis software (Goldwurm et al. 2003b, ), whose present version of the analysis procedures and calibration files do not allow for a full correction of systematic effects. Thus, in order not to over estimate the detection level of a source, taking into account fluctuations in the observation-dependent background noise levels as well as systematics, the significance was normalized to the fitted width of the distribution of individual significances in the image. This straight forward normalization procedure ensures that 68% of the distribution of significance values in the image are indeed contained within 1 of the mean. Image reconstruction can be summarized as follows: from the events list for a pointing, subsets of events are selected according to energy bins. Each subset is used to build a detector image or shadowgram. Convolution of the shadowgram with a decoding array gives rise to a sky image containing the main peak of all sources in the FOV and their secondary lobes. Source identification and subtraction of secondary lobes results in the final reconstructed sky image. Fluxes are derived using INTEGRAL observations of the Crab Nebula performed just prior to the start of the GCDE, and luminosity calculations are based on a distance of 8 to the GC assuming a Crab spectrum of a power law with photon index 2.12 and flux density at 1 of 8 (Bartlett , 1994).
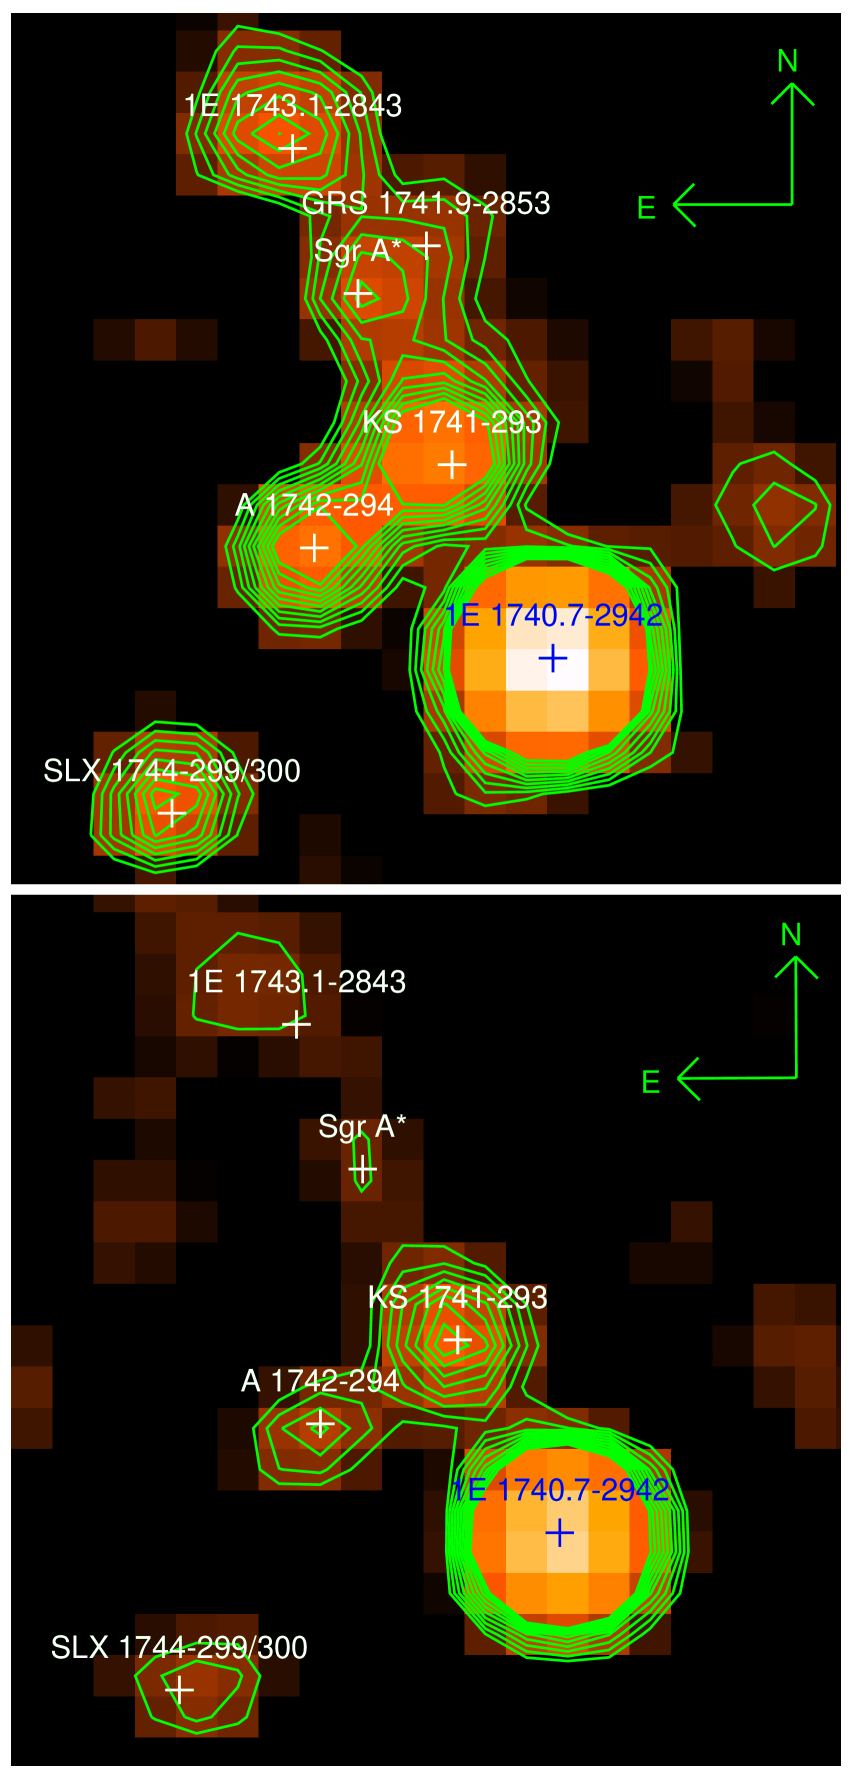
The maps of the GC shown in Figure 1 were constructed by summing the reconstructed images of 571 individual exposures. The total effective exposure time is about on the GN. In these signal-significance maps of the central two degrees of the Galaxy where ten contour levels mark iso-significance linearly from about up to , we can see what appear to be six distinct sources: 1E 1740.9–2942.7, KS 1741–293, A 1742–294, 1E 1743.1–2843, SLX 1744–299/300, whose nominal positions are marked by crosses and identification is still preliminary, and a source coincident with the radio position of Sgr A∗. 1E 1740.7–2942 is a black hole candidate, KS 1741–293 and A 1742–294 are neutron star Low-Mass X-Ray Binary (LMBX) bursters, SLX 1744–299/300 are in fact two LMXBs separated by only 2.72′, and 1E 1743.1–2843 is an X-ray source whose nature is still uncertain. In the 20–40 band, contours of the central source peak at the position of Sgr A∗ with a significance level of but are elongated toward GRS 1741.9–2853. This suggests some contribution from this transient neutron star LMXB burster system recently observed to have returned to an active state (Muno et al. 2003b, ) but could also be due to an uncorrected background structure. The central source is also marginally visible in the 40–100 band at a level of but without any contribution from the direction of GRS 1741.9–2853.
| Source name | Significance | Fitted position | Offset |
|---|---|---|---|
| (R.A., decl.) | (arcmin) | ||
| 1E 1740.7-2942 | 70.0 | 0.32 | |
| KS 1741-293 | 18.9 | 2.31 | |
| A 1742-294 | 15 | 0.05 | |
| SLX 1744-299/300 | 9.6 | 1.59 | |
| 1E 1743.1-2843 | 9.2 | 3.96 | |
| Sgr A∗ | 8.7 | 0.86 |
The position and flux of the central excess in the 20–40 map were determined by fitting the peaks with a function approximating the instrument’s PSF (Gros et al. , 2003) in two different ways: (1) all the emission is attributed to one source and is fitted as such to determine its peak height and position, (2) the emission is attributed to two sources: a new source and GRS 1741.9–2853, whose position is then fixed to the one determined with the Chandra observatory (Muno et al. 2003b, ). Both of these involve a simultaneous fit of all the sources in the 2 deg2 field of the GC. In the first case, we obtain a source position of R.A.(J2000.0)=, decl.(J2000.0)=, and a flux of about 5.4 mcrab or . In the second, the position is , , and the flux is about 3.2 mcrab or . The central source’s 40–100 peak position is in very good agreement with the one determined using the second method outlined above, and since there is clearly no visible contribution from a neighboring source, the 40–100 flux was extracted at that position. The estimated error on the position is of about 4′ for a detection at the significance level of 8.7. These positions are respectively 4′ .6 and 0′ .9 from the radio position of Sgr A∗. The results of the fine position determination for the six above mentioned GC sources are shown in Table 1. In Table 2, flux estimates for the central source are given adopting the result of the second method for position and flux determination. The hardness ratio (HR) — ratio of the count rate in the high-energy band over that in the low-energy band — for the detected excess is . As a possible indication of the nature of the detected excess, we can compare the values of the HR to the two brightest sources in the field. The BH candidate 1E 1740.7–2942 has a HR of , and the neutron star LMXB KS 1741–293 has a HR of .
The excess appears to be somewhat variable throughout the observations. In particular, we have detected a sudden increase in flux where the count rate rose by a factor of with respect to the mean for about 40 . Figure 2 shows a portion of the light curve from the estimated 20–40 keV flux at the radio position of Sgr A∗. Each data point corresponds to the average flux and statistical error from 37 minute intervals during observations that lasted 19 hr on 2003 April 6. Universal time is reported in INTEGRAL Julian days, i.e. days from 2000 January 1. The dashed line depicts the mean count rate over the entire data set. One peak clearly stands out at a pure statistical significance of 5, bearing in mind that this significance may be hampered by systematic effects. A simultaneous increase in flux is seen with a lower significance in the 40–100 keV light curve. In what follows we discuss a number of possible explanations for this detected excess.

3. Discussion and Conclusion
| Instrument | Energy | Energy Flux | |
|---|---|---|---|
| (keV) | () | ||
| INTEGRAL | 20–40a | ||
| (IGR 1745.6–2901) | 40–100a | ||
| 2–10a | 10.0 | 5.78 | |
| XMM-Newton | 20–40b | 0.61 | 1.03 |
| 40–100b | 0.031 | 0.04 | |
| 2–10a | 11.0 | 6.36 | |
| BeppoSAX | 20–40c | 0.89 | 1.49 |
| 40–100c | 0.061 | 0.09 | |
In attempting to identify the excess at , , we first consider which sources of high-energy emission can be excluded based solely on ISGRI’s error radius of 4′. There are four such sources: the radio arc located about 15′ from the GN; the non thermal X-ray filaments associated with it and the dense molecular cloud G0.13–0.13 (Yusef-Zadeh et al. , 2002); GRS 1743–290, observed by SIGMA in 1991 (Goldwurm et al. , 1994); and GRS 1741.9-2853 mentioned above and clearly unable to account for the bulk of the excess.
Second, we argue that this detection cannot be attributed to both diffuse emission and point sources as thus far observed at low X-ray energies within 8′–10′ of Sgr A∗. This is so because it is incompatible with the extrapolation at higher energies of the flux integrated over this region as measured by XMM-Newton (A. Decourchelle 2003, private communication) and BeppoSAX (Sidoli et al. , 1999). The analysis of 2001 XMM-Newton data in the 2–10 range consisted of integrating the total X-ray flux over a radius of 10′ around Sgr A∗. The resulting spectrum is best fitted by a two-temperature plasma model with =0.6 for the soft component and =7.2 for the harder one. 1997 BeppoSAX observations of the Sgr A complex over a radius of 8′ around Sgr A∗ in the same energy band agree with XMM-Newton’s results. In this case the data are also best described by a two-temperature model with =0.6 and =8 . The extrapolation of the XMM-Newton and BeppoSAX results to higher energies was done using kT=7.2 and 8 , respectively. Both instruments’ direct measurements of the diffuse X-ray flux are consistent with those of Chandra (Baganoff et al. , 2003) and ART-P (Sunyaev et al. , 1993). Table 2 reports the XMM-Newton and BeppoSAX measurements as well as their respective extrapolations. Note that the variability timescale of the INTEGRAL source equally excludes a major diffuse contribution and also strongly suggests that accelerated charged particles in the expanding shell of Sgr A East (Melia et al. , 1998) cannot significantly contribute to the detected signal.
Third, since the detected excess cannot be fully accounted for by diffuse emission and is variable, it is reasonable to consider it a point source, IGR J1745.6–2901, of 20–100 luminosity . One known point source found within 4′ of IGR J1745.6–2901 that could contribute to the signal is the eclipsing burster AX J1745.6–2901 (Maeda et al. , 1996; Sakano et al. , 2002). This source lies about 1′.3 from Sgr A∗ and was detected in a high state only once, in 1994 (Sakano et al. , 2002). The extrapolation of the flux measured in that state is marginally compatible with that of IGR J1745.6–2901, and this only in the low-energy range. The last confirmed detection of AX J1745.6–2901 was in 1997 by ASCA, when it was found in a much lower flux state. It may have recently been detected by Chandra. A timing analysis of the ASCA data on AX J1745.6–2901 revealed a modulation with a 40% decrease in flux and period of (Maeda et al. , 1996). 1997 ASCA data folded with that period show a slight dip, but since phase information could not be preserved over the 2.5 yr that separated the two observations, no unique solution for the period was found (Sakano et al. , 2002). Folding the INTEGRAL data for IGR J1745.6–2901 with a period of 8.356 hr does not reveal any modulation.
Chandra observations of the GC performed on 2003 June 19 indicate that two sources, CXOGC J174540.0–290005 and CXOGC J174540.0–290014, found within 0′ .4 of Sgr A∗, and another, CXOGC J174535.5–290124, lying 1′ .3 from Sgr A∗ and possibly the same as AX J1745.6–2901, had a combined intensity in the 2–8 band that was more than 30 times that of Sgr A∗ in its quiescent state on that day (F. K. Baganoff 2003, private communication). The GN was not particularly bright on June 19, but it must have been somewhat more active in May when an intense IR flare was observed to come from a region possibly very near the supermassive black hole’s event horizon (Genzel et al. , 2003).
It is noteworthy that the fairly hard X-ray source that ART-P detected in 1990 at the position of Sgr A∗, had a 8–20 flux that varied between about 5 and 11 (Pavlinsky et al. , 1994). This is consistent with our detection in the 20–40 energy range. We also recall the 2 upper limits set by SIGMA on the 40–80 and 80–150 luminosity of the GN: and respectively (Goldoni et al. , 1999), both of which are compatible with our detection.
Finally, INTEGRAL has detected a very hard X-ray source at a position coincident to within 1′ with Sgr A∗. Because of IBIS’s 12′ angular resolution, the emission from IGR J1745.6–2901 cannot be attributed to one specific object and could be made up of several contributing sources found within a couple of arcminutes of Sgr A∗. Nonetheless, this remains the first detection of emission at energies greater than 20 from the very close vicinity of the GN, and a contribution from Sgr A∗ itself cannot be excluded.
More INTEGRAL data are needed to better constrain the position, spectral shape, variability properties and the possibly multiple nature of IGR J1745.6–2901. We expect that the most constraining results will be provided by simultaneous observations in hard and soft X-rays with INTEGRAL and XMM-Newton or Chandra.
References
- Bartlett (1994) Bartlett, L. M. 1994, Ph.D. thesis, Nasa Goddard Space Flight Center.
- Balick & Brown (1974) Balick, B. & Brown, R. L. 1974, ApJ, 194, 265
- Baganoff et al. (2001) Baganoff, F. K. et al. 2001, Nature, 413, 45
- Baganoff et al. (2003) Baganoff, F. K. et al. 2003, ApJ, 591, 891
- Ebisawa et al. (2001) Ebisawa, K. et al. 2001, Science, 293, 1633
- Genzel et al. (2003) Genzel, R. et al. 2003, Nature, 425, 934
- (7) Ghez, A. M. et al. 2003a, ApJ, accepted (astro-ph/0306130)
- (8) Ghez, A. M. et al. 2003b, ApJ, in press (astro-ph/0309076)
- Goldoni et al. (1999) Goldoni et al. 1999, ApLC, 38, 305
- Goldwurm et al. (1994) Goldwurm, A. et al. 1994, Nature, 371, 589
- (11) Goldwurm, A. et al. 2003a, ApJ, 584, 751
- (12) Goldwurm, A. et al. 2003b, A&A, 411, L223
- Gros et al. (2003) Gros, A. et al. 2003, A&A, 411, L179
- Koyama et al. (1996) Koyama, K. et al. PASJ, 48, 249
- Lebrun et al. (2003) Lebrun, F. et al. 2003, A&A, 411, L141
- Lund et al. (2003) Lund, N. et al. 2003, A&A, 411, L231
- Lynden-Bell & Rees (1971) Lynden-Bell, D. & Rees, M. J. 1971, MNRAS, 152, 461
- Maeda et al. (1996) Maeda, Y. et al. 1996, PASJ, 48, 417
- Mas-Hesse et al. (2003) Mas-Hesse, M et al. 2003, A&A, 411, L461
- Melia et al. (1998) Melia, F. et al. 1998, ApJ, 508, 676
- Melia & Falcke (2001) Melia, F. & Falcke, H. 2001, ARA&A, 39, 309
- (22) Muno, M. et al. 2003a, ApJ, 589, 225
- (23) Muno, M. et al. 2003b, ApJ, in press (astro-ph/0307179)
- Pavlinsky et al. (1994) Pavlinsky, M. N., Grebenev, S. A. & Sunyaev, R. A. 1994, ApJ, 425, 110
- Porquet et al. (2003) Porquet, D. et al. 2003, A&A, 407, L17
- Sakano et al. (2002) Sakano, M. et al. 2002, ApJS, 138, 19
- Schödel et al. (2002) Schödel et al. 2002, Nature, 419, 694
- Serabyn & Morris (1996) Serabyn, E & Morris, M. 1996, Nature, 382, 602
- Sidoli & Mereghetti (1999) Sidoli, L. & Mereghetti, S. 1999, A&A, 349, L49
- Sidoli et al. (1999) Sidoli, L. et al. 1999, ApJ, 525, 215
- Skinner et al. (1987) Skinner, G. K. et al. 1987, Nature, 330, 544
- Sunyaev et al. (1993) Sunyaev, R. et al. 1993, ApJ, 407, 606
- Ubertini et al. (2003) Ubertini, P. et al. 2003, A&A, 411, L131
- Vedrenne et al. (2003) Vedrenne, G. et al. 2003, A&A, 411, L63
- Winkler (2003) Winkler, C. 2003, A&A, 411, L1
- Yusef-Zadeh et al. (2002) Yusef-Zadeh, F. et al. 2002, ApJ, 568, 121