The Wendelstein Calar Alto Pixellensing Project11affiliation: Based on observations at the Wendelstein
Observatory of the University Observatory Munich and
at the German-Spanish Astronomical
Center, Calar Alto, operated by the Max-Planck-Institut für Astronomie,
Heidelberg, jointly with the Spanish National Commission for Astronomy.
(WeCAPP):
First MACHO Candidates
Abstract
We report the detection of the first 2 microlensing candidates from the Wendelstein Calar Alto Pixellensing Project (WeCAPP). Both are detected with a high signal-to-noise-ratio and were filtered out from 4.5 mill. pixel light curves using a variety of selection criteria. Here we only consider well-sampled events with timescales of , high amplitude, and low of the microlensing fit. The two-color photometry shows that the events are achromatic and that giant stars with colors of in the bulge of M31 have been lensed. The magnification factors are 64 and 10 which are obtained for typical giant luminosities of . Both lensing events lasted for only a few days ( and ). The event GL1 is likely identical with PA-00-S3 reported by the POINT-AGAPE project. Our calculations favor in both cases the possibility that MACHOs in the halo of M31 caused the lensing events. The most probable masses, for GL1 and for GL2, are in the range of the brown dwarf limit of hydrogen burning. Solar mass objects are a factor of two less likely.
Subject headings:
gravitational lensing --- galaxies individual: M31 --- dark matter --- galaxies: halos1. INTRODUCTION
Microlensing experiments are an ideal method to search for dark objects within and between galaxies. A large number of microlensing events have been detected towards the Galactic bulge constraining the number density of faint stars in this direction (Alard, 1999; Afonso et al., 1999; Alcock et al., 2000a; Udalski et al., 2000). Towards the LMC only 13-17 microlensing events have been reported so far (Alcock et al., 2000b). If all this events are attributed to MACHOs, the associated population of dark objects would contribute up to the 20% level to the dark matter content of the Milky Way (Alcock et al., 2000b). However, both the relatively large size of the LMC relative to its distance and the nature of the lenses has cast doubt on this interpretation. It is indeed likely that a large fraction of the microlensing events towards the LMC are due to self-lensing of stars within the LMC (Lasserre et al. (2000); Evans Kerins (2000) and references therein).
Studying microlensing events towards M31 allows to separate self-lensing and halo-lensing in a statistical way, since the optical depth for halo lensing is larger on the far side of M31. In M31 individual stars can not be resolved and one therefore has to use the pixellensing technique (Crotts, 1992; Baillon et al., 1993) to follow the variability of sources blended with thousands of other sources within the same pixel. First detections of possible microlensing events were reported by several pixellensing experiments (Crotts et al., 1996; Ansari et al., 1999; Aurière et al., 2001; Paulin-Henriksson et al., 2002, 2003; Calchi Novati et al., 2003). But since the candidate nature of only 5 of these events is convincing, no conclusions concerning the near-far asymmetry or the most likely dark matter lensing masses could be drawn yet.
The Wendelstein Calar Alto Pixellensing Project (WeCAPP, Riffeser et al. 2001) started in 1997 with test observations. Since 1999 the bulge of M31 was monitored continuously during the time of visibility of M31. The analysis of our 4 year data will allow not only the identification of very short duration events (eg., in the 4th year data of the combined field have been taken on 83 % of possible nights) but also the separation of long duration () microlensing events from long periodic variables as Mira stars. For this letter we analyzed the short duration events () within one season of Calar Alto data and restricted the detection to high-signal-to noise, high-magnification events. We report our first 2 microlensing candidates of that type.
2. OBSERVATIONS AND DATA REDUCTION
WeCAPP monitors the central region of M31 in a field with the telescope of the Calar Alto Observatory. In addition, a quarter of this field, pointing towards the far side of the M31 disk along the SE minor axis, was observed with the 0.8 m telescope of the Wendelstein Observatory. The data analysis and candidate selection reported in this letter is based on the season from June, 23th 2000 to February, 25th 2001 and is restricted to the Calar Alto data only. During this period, M31 was observed during 43% percent of all nights. Observations were carried out in and filters close to the Kron-Cousins system. We estimate the systematic error in the color to be .
We have developed a pipeline based on Gössl Riffeser (2002) and Riffeser et al. (in prep.), which performs the standard CCD reduction, position alignment, photometric alignment, stacking of frames, PSF matching using Optical Image Subtraction (Alard, 1998), and the generation of difference images. For the data presented here all data within one night are coadded, yielding one difference image per night. The reduction package includes full error propagation for each pixel through all reduction steps. In this way, all data points are properly taken into account in the search for variables.
3. SELECTION CRITERIA
| selection criterion | number |
|---|---|
| analyzed light curves | 4492250 |
| light curves with data points | 3835407 |
| 3 successive 3- in or | 517052 |
| and | 186039 |
| 1 day days | 9497 |
| 3- light point inside | 1829 |
| sampling: , | 256 |
| in and | 15 |
| candidates | 2 |
We investigate only pixels which have more than 10 data points in and , which applies for 85% of the 2K x 2K field. For each pixel we define a flux baseline by iterative -clipping of all outliers with higher flux. All pixels which have at least 3 successive (positive) 3- deviations from this baseline are considered as variables. We fit the microlensing light curve for high-amplification events (Gould, 1996) simultaneously to the - and -band pixel light curves for every variable. The fit has 6 free parameters: full-width-half-maximum and the time of maximum amplification (these 2 parameters are the same for both filters), amplitude , color , and baseline levels and . Variables with a reduced or are discarded. In this way we exclude light curves that are not achromatic or not symmetric. We also exclude events with days which can be confused with long periodic variables like Mira stars, as long as only one season of data is investigated. In addition, all candidates which do not have at least one significant data point (3 deviation from the baseline) within of the time of maximum amplification are rejected. We further define the sampling quality for the falling and rising parts of each light curve within and : within these time intervals we require a sampling of the area under the light curve of at least 20% on one side and of at least 5% on the other side (Table 1).
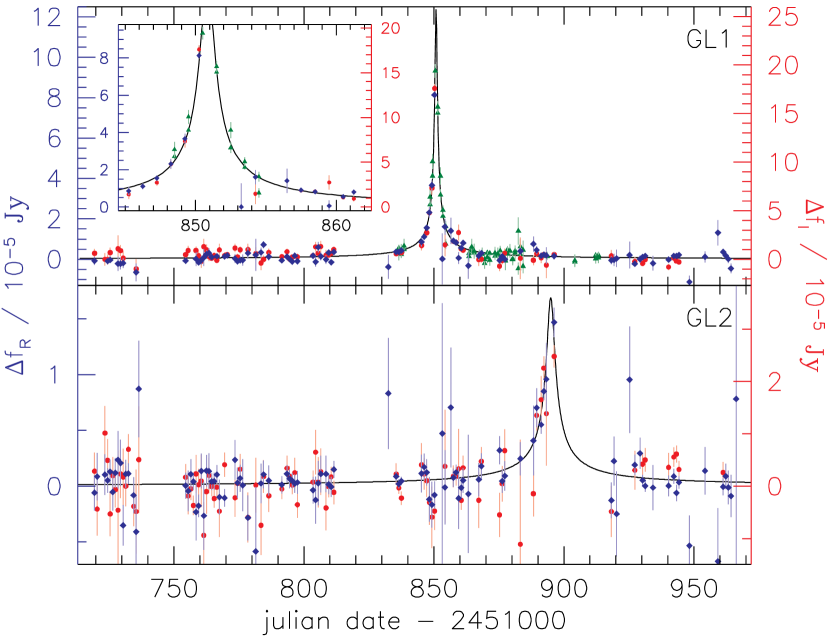
Here, we present only the two microlensing candidates which have amplitudes 10 times larger than the median error of the light curve (see Figure 1). Both candidates fit perfectly to a symmetric microlensing light curve. Ruling out systematic offsets for the points and errors on the trailing side of GL2 (which is strongly proved by the 6 single images of that night in each filter) a non microlensing light curve of a variable source hardly fits the data points of GL2. Both microlensing candidates are detected in several pixels ( for GL1 and for GL2) inside the PSF of the position of the lensed object. This explains the reduction from 15 events to 2 events in the last line of Table 1. The amplification light curves were obtained by calculating the total flux within the PSF area of each microlensing event.
For both candidates, the selection criteria exclude variable stars like Miras, novae or dwarf novae. Extracting lensing events with less good time sampling, lower amplitude, or events located close to other variables requires refined selection criteria. These will be discussed in a future paper which will also include a test of the detection efficiency and false detection rate with Monte Carlo simulations.
4. MICROLENSING CANDIDATES
| Name | WeCAPP-GL1 | GL1 & PA-00-S3 11derived from a fit to the total set of data points (WeCAPP & POINT-AGAPE) | WeCAPP-GL2 |
|---|---|---|---|
| [JD] | |||
| [d] | |||
| 1.23 | 1.22 | 1.02 |
The parameters of both lensing candidates are summarized in Table 2. Their light curves are shown in Figure 1. GL1, the highest S/N lensing event candidate in our sample, lies to the SW of the nucleus of M31. GL2 is to the NW of the nucleus. Our data have been astrometrically calibrated using bright foreground stars observed with HST by Jablonka et al. (1999) and ground based observations by Magnier et al. (1992). Our two calibrations agree within 0.5 in declination and 0.7 in right ascension, well consistent with the astrometric accuracy of 0.8 to 1.0 of the Magnier et al. catalog. After we had detected GL1 and GL2, we cross-checked with events reported by the POINT-AGAPE survey for the same period of time and the same field in M31 (Paulin-Henriksson et al., 2003). It appears that GL1 is likely identical with PA-00-S3 which occurred at the same time (Figure 1). Because POINT-AGAPE did not provide a flux calibration of their data, we had to assume a scaling factor for the amplitude. The zero point in time was not adjusted. The data points from WeCAPP and POINT-AGAPE complement each other nicely and make GL1 the best pixellensing event found so far in M31. GL2 also falls in the observing period covered by POINT-AGAPE but their time sampling around the event is poor. This may be the reason why GL2 was not detected.
The parameters of the lensing fit are degenerate for high magnifications (Gould, 1996), i.e. for amplitudes which correspond to impact angles much smaller than the Einstein angle . In this case, we obtain for the light curve:
with intrinsic flux of the source and , where is the impact angle in units of the Einstein angle.
In order to obtain we evidently need to know the source flux . We can get rough constraints by considering the color of the light curves which due to our selection criteria are achromatic. We obtain and . For main sequence stars this converts111transformed on the observational plane by Maraston (1998) (Cassisi et al., 1998) into absolute magnitudes of . If the sources are giants, then the magnitudes are with a minimum of and maximum of (Bessell, 1979; Grillmair et al., 1996).
We now derive the lensing parameters as follows:
where is the Einstein timescale, is the transverse velocity between source and lens, and and are the angular distances to the lens and source.
| [d] | ||
|---|---|---|
| GL1 | ||
| -1.9 | 120 | |
| -2.5 | 69 | |
| -3.7 | 24 | |
| 7.7 | ||
| GL1 | & PA-00-S3 | |
| -1.9 | 110 | |
| -2.5 | 64 | |
| -3.7 | 22 | |
| 7.7 | ||
| GL2 | ||
| -1.9 | 16 | |
| -2.5 | 10 | |
| -3.7 | 4 | |
| 8.3 |
To estimate plausible lens masses the Einstein timescales are calculated for fixed luminosities of possible source stars (see Table 3). Note that the errors in reflect the accuracy of the determination of in the degenerate Gould fit only, and do not account for the systematic uncertainties due to the unknown luminosities of the sources. If the source is a main sequence star, we need very high magnifications: typically and for GL1 and GL2, respectively. The corresponding lens masses (for , , ) are , an implausibly large value. If the source is a giant, the required magnifications are reduced to and (see Table 3); the typical self-lensing masses become and , i.e. they are typical for low mass stars.
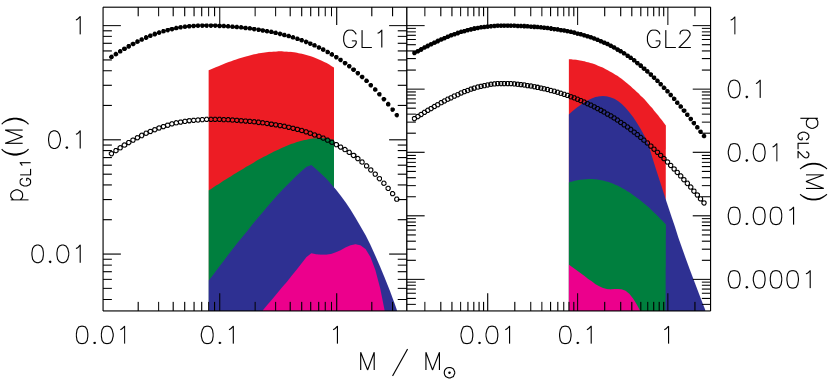
Assuming the source to be a red giant with we calculate the probability that a microlensing event of observed timescale can be produced by a lens of the mass . Following the calculations of Jetzer & Massó (1994) eq. (8) and Jetzer (1994) eq. (11) we get
with the mass function (MF) , the sources density , the lenses density , the velocity distribution and the Einstein radius .
The distribution of matter in the central part of M31 is based on the bulge model of Kent (1989). The disk is modeled with a radial scale length of 6.4 kpc and an exponential shape, and with a vertical scale length of 0.3 kpc and a -shape. The halo is modeled as an isothermal sphere with a core radius of . The velocity distribution was calculated from a Maxwellian halo bulge and disk velocity distribution with an additional rotation for bulge and disk (Kerins et al., 2001).
For the bulge lenses we take the IMF as derived for the galactic bulge (Zoccali et al., 2000). For the disk population we adopt a Gould IMF with a flattening below (Gould, Bahcall Flynn, 1997). Both are cut at the lower end at the hydrogen burning limit of . At the upper end the bulge MF is cut at the main sequence turn-off (Maraston, priv. com.) and the disk MF at . The IMF for the potential MACHO population residing in the halo of M31 is of course unknown. We therefore calculate the probability distribution for halos consisting of one mass only, i.e. taking -function IMF’s centered on the lens mass . Moreover we assume that the whole dark halo of M31 consists of MACHOs. Lensing by Galactic halo objects has an order of magnitude smaller optical depth and is therefore neglected in our considerations.
The results are shown in Figure 2. For M31 halo lenses the most probable masses are for GL1 and for GL2. In the case of self-lensing the most probable masses are about a factor of 4 bigger. Taking the most likely halo lens masses, the ratio of the probabilities that the lenses are part of the dark halo or the stellar content is 1.6 for GL1 and 3.3 for GL2. We conclude therefore that it is likely that lenses residing in the halo of M31 caused the events in both cases.
5. DISCUSSION and OUTLOOK
We presented the first two high (), short timescale microlensing events from WeCAPP. GL1 is likely identical to PA-00-S3 found by POINT-AGAPE. Combining the data from AGAPE with ours shows that the error bar of the derived Einstein time scale becomes smaller by a factor of 5 compared to the individual error bar. This demonstrates the importance of a good time sampling of the events. We derived the colors of the lensed stars, the amplification factors and likely lens masses for both bulge/disk self-lensing and MACHO lensing. We showed that red giants are the likely source objects, while main sequence stars are highly implausible.
Self-lensing in the bulge can only be separated from MACHO lensing statistically. Halo-lensing events show a spatial asymmetry because the optical depth for lensing events is higher for stars on the far side of M31 than on its near side (Crotts, 1992; Fliri et al., in prep.). In contrast, bulge self-lensing is symmetric.
The bulge self-lensing hypothesis yields lensing stars at or below the the main sequence turn-off of the M31 bulge. On the other hand, if the lensing events are caused by MACHOs, their masses are typically very low, most probable below . Masses in the range of to are more unlikely.
So far, we have analyzed one observing season and restricted the lensing search to short-time, high-amplification events in order to avoid confusion with variable stars. The whole WeCAPP dataset will allow us to identify all variables and thus will enable a search for lower amplitude and longer duration microlensing events.
Decreasing the amplitude threshold will increase the detected rate of events in two ways. As the event rate is proportional to the inverse of the minimum required magnification in the pixellensing regime we expect to detect more lensed giants. On the other hand lowering the amplification threshold could make it possible to detect also highly amplified main sequence stars (Han & Gould, 1996) which exceed the evolved stars in the bulge of M31 by a factor of more than a hundred. How many more lensing events will be detected depends on the mass function of the lenses but we can expect at least a factor of a few (Fliri et al., in prep.).
Finally, the effects of time sampling and noise properties of our sample on the detectability of lensing events have to be taken into account. Results of the modeling of these effects for events of different durations and amplitudes using Monte-Carlo simulations will be presented in a future publication. With the full dataset we expect therefore to increase the number of lensing events to detect the predicted asymmetry of MACHO lensing or to rule out a significant MACHO population in the halo of M31.
References
- Afonso et al. (1999) Afonso, C., Alard, C., Albert, J. et al. 1999, A&A, 351, 87
- Alard (1998) Alard, C. 1998, ApJ, 503, 325
- Alard (1999) Alard, C. 1999, A&A, 343, 10
- Alcock et al. (2000a) Alcock, C., Allsman, R. A., Alves, D. R. et al. 2000, ApJ, 541, 734
- Alcock et al. (2000b) Alcock, C., Allsman, R. A., Alves, D. R. et al. 2000, ApJ, 542, 281
- Ansari et al. (1999) Ansari., R., Aurière, M., Baillon, P. 1999, A&A, 344, L49
- Aurière et al. (2001) Aurière, M., Baillon, P., Bouquet, A. et al. 2001, ApJ, 553, 137
- Baillon et al. (1993) Baillon, P., Bouquet, A., Giraud-Heraud, Y., and Kaplan, J. 1993, A&A, 277, 1
- Bessell (1979) Bessell, M. S. 1979, PASP91, 589
- Calchi Novati et al. (2003) Calchi Novati, S., Jetzer, Ph., Scarpetta, G. et al. 2003, A&A, 405, 851
- Cassisi et al. (1998) Cassisi, S., Castellani, V., degl’Innocenti, S., Weiss, A. 1998, A&AS, 129, 267
- Crotts (1992) Crotts, A. P. S. 1992, ApJ, 399, 43
- Crotts et al. (1996) Crotts, A. P. S., Tomaney, A. B. 1996, ApJ, 473, 87
- Evans Kerins (2000) Evans, N.W., Kerins, E. 2000, ApJ, 529, 917
- Fliri et al. (in prep.) Fliri, J., Riffeser, A., Seitz, S. et al. in prep.
- Gössl Riffeser (2002) Gössl, C.A. & Riffeser, A. 2002, A&A, 381, 1095
- Gould (1996) Gould, A. 1996, ApJ, 470, 201
- Gould, Bahcall Flynn (1997) Gould, A., Bahcall J., Flynn C. 1997, ApJ, 482, 913
- Grillmair et al. (1996) Grillmair, C. J., Lauer, T. R., Worthey, G. et al. 1996, AJ, 112, 1975
- Han & Gould (1996) Han, C. & Gould, A. 1996, ApJ, 473, 230
- Jablonka et al. (1999) Jablonka, P., Bridges, T.J., Sarajedini, A., et al. 1999, ApJ, 518, 627
- Jetzer & Massó (1994) Jetzer, Ph. & Massó, E. 1994, Phys. Lett., B323, 347
- Jetzer (1994) Jetzer, Ph. 1994, ApJ, 432, 43
- Kent (1989) Kent, S. 1989, AJ, 97, 1614
- Kerins et al. (2001) Kerins, E., Carr, B. J., Evans, N. W. 2001, MNRAS, 323, 13
- Lasserre et al. (2000) Lasserre, T., Afonso, C., Albert, J.N., et al. 2000, A&A, 355, L39
- Magnier et al. (1992) Magnier, E.A., Lewin, W.H.G., van Paradijs, J. et al. 1992, A&AS, 96, 379
- Maraston (1998) Maraston, C. 1998, MNRAS, 300, 872
- Paulin-Henriksson et al. (2002) Paulin-Henriksson, S., Baillon, P., Bouquet, A. et al. 2002, ApJ, 576, 121
- Paulin-Henriksson et al. (2003) Paulin-Henriksson, S., Baillon, P., Bouquet, A. et al. 2003, A&A, 405, 15
- Riffeser et al. (2001) Riffeser, A., Fliri, J., Gössl, C.A. et al. 2001, A&A, 379, 362
- Riffeser et al. (in prep.) Riffeser, A., Fliri, J., Gössl, C.A. in prep.
- Udalski et al. (2000) Udalski, A., Zebrun, K., Szymanski, M. 2000, Acta Astronomica, 50, 1
- Zoccali et al. (2000) Zoccali, M., Cassisi, S., Frogel, J.A. et al. 2000, ApJ 530, 418