FeII/MgII, [Fe/Mg] Ratios and High-z Quasars
Abstract
It has been suggested in the literature that the (Fe/) abundance ratio may be used as a chronometer, due to a delay in this ratio reaching its solar value as predicted by galactic chemical evolution models. Using grids of photoionization models along a sequence of the (Fe/Mg) abundance ratio vs. metallicity with time in a giant elliptical starburst scenario, we investigate the relationship between the (Fe/Mg) abundance ratio and the FeII/MgII emission line flux ratio under the assumption that these lines originate in photoionized clouds within the broad emission line regions of quasars.
Western Michigan University, Department of Physics, Kalamazoo, MI 49008-5252
Space Telescope Science Institute, 3700 San Martin Drive, Baltimore, MD 21218
Space Telescope European Coordinating Facility, Karl-Schwarzschild-Strasse 2, 85748 Garching, Germany
1. Introduction
Nearly 20 years ago, in their paper investigating the physics of FeII emission in quasars, Will, Netzer, & Wills (1985; WNW) suggested the importance of measuring the (Fe/Mg) abundance ratio in quasars, in that an overabundance of iron in quasars and active galaxies “may have important implications for their evolution.” Hamann & Ferland (1993; 1999) discussed the possible use of the FeII/MgII 2800 emission line flux ratio as a chronometer in quasars. With Type II SNe producing most of the elements (O, Mg, etc), and Type Ia SNe accounting for most of the iron enrichment, a characteristic delay of 1 Gyr is expected for (Fe/) to reach solar values. However, the value of this delay has been a matter of recent controversy, with some models of Matteucci & Recchi (2001) suggesting much shorter delay time scales, depending upon the environment.
Recent quasar surveys, such as the Sloan Digital Sky Survey, have discovered large numbers of high redshift quasars. Infrared spectroscopy of these quasars have revealed their emission in MgII and UV-optical FeII. Elston et al. (1994) was the first to report strong FeII emission in quasars. Since then several investigators have measured the UV FeII/MgII emission ratio in quasars with redshifts up to , with hopes of gauging early chemical evolution in the centers of host galaxies and pinning lower limits to the age of the universe at high redshift (Kawara et al. 1996; Thompson et al. 1999; Aoki et al 2002; Dietrich et al. 2002; Iwamuro et al. 2002; Pentericci et al. 2002; Freudling et al. 2003; Dietrich et al. 2003a; Maiolino et al. 2003; Barth et al. 2003). Yoshii et al. (1998) used galactic chemical evolution models and FeII/MgII measurements of a quasar to constrain cosmological models, based upon the delay in the iron enrichment and two important assumptions. First, as suggested by WNW, they assumed that a flux ratio FeII(UV opt)/MgII represents solar (Fe/Mg). This has never been established theoretically. Second, they assumed that the flux ratio scales directly with the abundance ratio. It is this latter relationship that we investigate, as an important first step toward possibly establishing the FeII/MgII flux ratio in quasars as a meter stick of time and/or (Fe/) enrichment history (see Di Matteo et al. 2003). A linear relation (logarithmic slope ) between the flux and abundance ratios is not expected, due to the thermostatic effects of significant coolants. The logarithmic slope in the relation may even change since MgII is only a doublet, while FeII can redistribute its cooling to a vast array of UV and optical multiplets (where one may not be measuring).
2. Grids of Photoionization Models
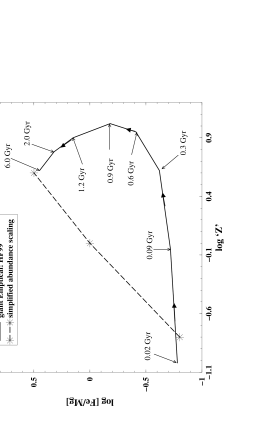
Using Gary Ferland’s photoionization code, Cloudy, we computed 8 separate grids of photoionized clouds, each grid containing 841 models and spanning 7 decades in hydrogen number density () and ionizing photon flux () for a fixed cloud total hydrogen column density ( cm-2). Each grid was assigned elemental abundances and metallicity () from the giant elliptical starburst abundance set of Hamann & Ferland (1999; their Figure 13) for a particular age of the starburst (see Figure 1). These spectral simulations used the default simplified model FeII atom within Cloudy. The predicted quasar emission line spectrum from each grid was determined by summing the emission over a broad distribution of clouds within the grid following the “locally optimally-emitting clouds” (LOC) scheme of Baldwin et al. (1995). In addition Gary Ferland and Jack Baldwin have kindly provided predicted FeII(2240-2660 Å)/MgII ratios for 3 simple combinations of and (Fe/Mg) (Figure 1; solar, high & low ), each of these grids computed using Cloudy’s detailed 371-level model FeII atom. The spectral region 2240-2660 Å in FeII emission will be referred to as the FeII(UV bump).
3. Results
For each of our 8 grids, the total cooling from the simplified FeII model atom was integrated over a broad distribution of clouds, as described above, and ratioed to the emission from MgII 2800. The same was also done for the 3 grids that utilized the detailed model FeII atom, except that the predicted emission from the more commonly measured FeII(UV bump) was used. The flux ratios from the 8 grids utilizing the simplified FeII model atom were normalized to the FeII(UV bump)/MgII flux ratio from the solar metallicity grid predicted by the detailed FeII model atom. The slope in the (FeII(UV bump)/MgII) vs. (Fe/Mg) relation from our 8 grids was found to be 0.4, whereas that between the 3 grids utilizing the detailed model FeII atom was found to be 0.6. As expected the predicted logarithmic slope is substantially less than 1.
In Figure 2 we show the FeII(UV bump)/MgII flux ratio as a function the approximate age of the starburst. The flux ratio climbs rapidly and then flattens beyond 1.5 Gyr, corresponding to a (Fe/Mg) abundance ratio of about twice solar (Figure 1). Based upon these results, we might expect to measure a systematic decline in the FeII(UV bump)/MgII flux ratio in samples of quasars for redshifts assuming a host galaxy formation redshift or assuming , for presently favored cosmological parameters. While this flux ratio is difficult to measure, especially in the observed frame IR, no such systematic decline has been detected to date. More importantly, Baldwin et al. (these proceedings) find that the origin of even the UV FeII emission in quasars remains in question; part of this is reflected in the weakness of the predicted flux ratio in Figure 2 even at large values in (Fe/Mg). Without intending to sound obvious, we must first understand the origin of the FeII emission in quasars before it can be used as either a clock or as a means to track enrichment histories of the centers of host galaxies. Additional clues to chemical evolution at high redshift may come from other heavy element emission lines (e.g., NV, CIII]; see Dietrich et al. 2003b), from measurements of CO (Bertoldi et al. 2003), and even measurements of the X-ray iron K-edge (Hasinger et al. 2003).

References
Aoki, K., Murayama, T., Denda, K. 2002, PASJ, 54, 353
Baldwin, J.A., et al., these proceedings
Barth, A.J., Martini, P., Nelson, C.H., & Ho, L. 2003, ApJ, 594, 95
Bertoldi, F. et al. 2003, A&A, 409, L47
Dietrich, M., Appenzeller, I., Vestergaard, M., & Wagner, S.J. 2002, ApJ, 564, 581
Dietrich, M., Hamann, F., Appenzeller, I., & Vestergaard, M. 2003a, ApJ, 596, 817
Dietrich, M., Hamann, F., Shields, J.C., Constantin, A., Heidt, J., Jäger, K, Vestergaard, M., & Wagner, S.J. 2003b, ApJ, 589, 722
Di Matteo, T., Croft, R.A.C., Springel, V., & Hernquist, L. 2003, submitted to ApJ (astro-ph/0309533)
Elston, R., Thompson, K.L., & Hill, G.J. 1994, Nature, 367, 250
Freudling, W., Corbin, M.R., Korista, K.T. 2003, ApJ, 587, L67
Hamann, F., & Ferland, G. 1999, ARA&A, 37, 487
Hasinger, G., Schartel, N., & Komosa, S. 2002, ApJ, 573, L77
Iwamuro, F., Motohara, K., Maihara, T., Kimura, M., Yoshii, Y., Doi, M. 2002, ApJ, 565, 63
Karwara, K., Murayama, T., Taniguchi, Y., & Arimoto, N. 1996, ApJ, 470, L85
Maiolino, R., Juarez, Y., Muijica, R., Nagar, N.M., & Oliva, E. 2003, ApJ, 596, 155
Matteucci, F., & Recchi, S. 2001, ApJ, 558, 351
Pentericci, L., et al. 2002, AJ, 122, 2833
Thompson, K.L., Hill, G.J., & Elston, R. 1999, ApJ, 515, 487
Yoshii, Y., Tsujimoto, T., Kawara, K. 1998, ApJ, 507, L113