Chemistry and kinematics of the pre-stellar core L1544: Constraints from H2D+.
This paper explores the sensitivity of line profiles of H2D+, HCO+ and N2H+, observed towards the center of L 1544, to various kinematic and chemical parameters. The total width of the H2D+ line can be matched by a static model and by models invoking ambipolar diffusion and gravitational collapse. The derived turbulent line width is =0.15 km s-1 for the static case and 0.05 km s-1 for the collapse case. However, line profiles of HC18O+ and N2H+ rule out the static solution. The double-peaked H2D+ line shape requires either infall speeds in the center that are much higher than predicted by ambipolar diffusion models, or a shell-type distribution of H2D+, as is the case for HCO+ and N2H+. At an offset of 20′′ from the dust peak, the H2D+ abundance drops by a factor of 5.
1 Introduction
Deuterium-bearing molecules are important as probes of the very cold phases of molecular clouds prior to star formation. The H2D+ ion is especially important as tracer of H, the primary ion in dense molecular clouds, which does not have a dipole moment and hence no pure rotational lines. In addition, at low temperatures ( K), H2D+ has the ability to channel D atoms from their main reservoir, HD, into heavier species. This process leads to abundance ratios of DCO+/HCO+ and N2D+/N2H+ of 10 observed towards dense cores, much larger than the elemental D/H ratio of 10-5. Recent observations of multiply deuterated H2CO, CH3OH, H2S and NH3 (see Ceccarelli, this volume) suggest that under extreme conditions, a significant fraction of D may be transferred to heavy molecules. We wish to quantify the role of H2D+ in this process, and compare with other processes such as grain surface reactions (Caselli, this volume).
The ground-state – transition of para-H2D+ at 1370 GHz will be a prime target for GREAT on SOFIA. However, with the upper energy level 65 K above ground, this line will only be excited in relatively warm (20 K) regions, where chemical fractionation is ineffective. For colder sources, the – ground-state transition of ortho-H2D+ at 372 GHz is more suitable, which can be observed from the ground under good conditions. At the low temperatures (10 K) and high densities ( cm-3) of pre-stellar cores, reactive collisions with ortho–H2 keep the ortho-para ratio of H2D+ at 1, orders of magnitude above the LTE value pagani92 ; gerlich02 .
Until 2002, only two detections of H2D+ had been obtained, which indicated abundances of 10-11–10-12 towards Class 0 objects h2d+99 ; stark03 . In October 2002, we h2d+03 observed strong H2D+ emission towards the pre-stellar core L 1544, and derived an abundance of 1 in the central 20′′. Such a high abundance suggests that in this region, all CNO-bearing species are depleted onto dust grains, a situation explored in more detail by Walmsley (this volume). Data taken in June 2003 at the CSO indicate that the same phenomenon takes place in at least five other pre-stellar cores. More observations are scheduled for December 2003. These data will be presented in a forthcoming paper. Here we investigate the line profile of H2D+ in L 1544, and derive its abundance outside the central region.
2 Kinematics
| Line | |||
|---|---|---|---|
| km s-1 | km s-1 | km s-1 | |
| H2D+ (110–) | 7.06(3) | 0.22(5) | 0.28–0.34 |
| 7.34(2) | 0.25(6) | ||
| HC18O+ (1–0) | 7.04(1) | 0.18(3) | 0.10–0.12 |
| 7.28(1) | 0.23(3) | ||
| D13CO+ (2–1) | 7.08(2) | 0.20(4) | 0.10–0.12 |
| 7.35(4) | 0.20(8) | ||
| N2H+ (1–0, =10–11) | 7.08(1) | 0.19(1) | 0.11–0.13 |
| 7.33(1) | 0.20(2) | ||
| a Thermal line width at =7 and 10 K. | |||
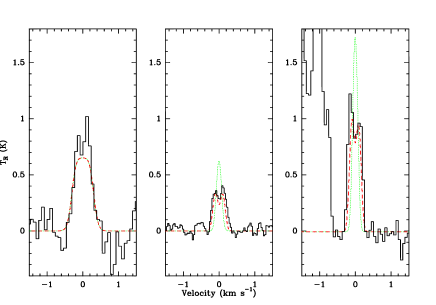
The line profile of H2D+ towards L 1544 appears double-peaked, although the signal-to-noise ratio is not high (Fig. 1). Fitting two Gaussians to the profile yields results very similar to those for the profiles of HC18O+, D13CO+ and N2H+, observed by paola02a : two thermal components separated by 0.26 km s-1 (Table 1). We therefore investigate whether the kinematic models that fit the HCO+ and N2H+ data also reproduce the H2D+ line profile.
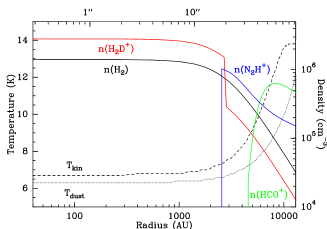
The line profile of H2D+ was modeled using a Monte Carlo radiative transfer program hst00 111http://www.mpifr-bonn.mpg.de/staff/fvandertak/ratran/. Figure 2 shows the adopted temperature and density structure of L1544, taken from galli02 . See h2d+03 for details of the excitation model; at 10 K, ortho-H2D+ is essentially a two-level system, so that our results are not sensitive to the collision rates of non-radiative transitions between high-lying levels. For H2D+ we adopt an abundance of 110-9 in the central 20′′ h2d+03 . For HCO+, DCO+, N2H+ and N2D+, we used the abundance profiles from paola02b , Model 3, and assumed zero abundance inside =2500 AU. We explored static models, and models with velocity fields from the ambipolar diffusion models ‘t3’ and ‘t5’ of cb00 (see paola02a for details). For the turbulent broadening, Doppler parameters between 0.05 and 0.25 km s-1 were tried. Smaller values of are overwhelmed by thermal broadening; larger ones do not fit the data.
We find that the total width of the H2D+ line can be matched using either velocity field. While the best-fit static model has =0.15, =0.05 gives the best fits with the infall velocity fields. However, the HC18O+ and N2H+ =1-0 observations from paola02a rule out the static model, which does not give a double-peaked line shape. Using the infall velocity fields, the data are matched with =0.05, consistent with the H2D+ results (Fig. 1).
None of our adopted velocity fields reproduces the double-peaked H2D+ line shape that the observations indicate. One possibility is that the infall speeds of 0.1 km s-1 continue further inwards than in the models by cb00 . Alternatively, the distribution of H2D+ may have a central hole, not because of adsorption onto dust grains (as for CO and N2, the precursors of HCO+ and N2H+), but due to conversion into D2H+ and D.
3 Abundance profile of H2D+
The abundance of H2D+ away from the dust peak of L 1544 was estimated to be a factor of two lower than toward the dust peak h2d+03 . However, this abundance may be an overestimate because some fraction of the emission at the 20′′ offset positions is pickup from the central core. We have run Monte Carlo models of the H2D+ emission, using the same temperature and density structure as before, and dropping the H2D+ abundance at a 20′′ radius by factors of 2–10 from its central value of 110-9. The H2D+ intensity at the 20′′ offset position is best matched if the abundance drops by a factor of 5 at this radius. This result is independent of the velocity field. Models where this factor is 3 or 10 produce clearly worse matches to the data.
In a future paper, we will follow our results up with two-dimensional models and an exploration of different velocity fields. We will also model line profiles at offset positions.
References
- (1) Pagani, L., Salez, M., & Wannier, P. G.: A&A, 258, 479 (1992)
- (2) Gerlich, D., Herbst, E., & Roueff, E.: Plan. Sp. Science, 50, 1275 (2002)
- (3) Stark, R., van der Tak, F. F. S., & van Dishoeck, E. F.: ApJ, 521, L67 (1999)
- (4) Stark, R., Sandell, G., Beck, S., et al.: ApJ, submitted (2003)
- (5) Caselli, P., van der Tak, F. F. S., Ceccarelli, C., & Bacmann, A.: A&A, 403, L37 (2003)
- (6) Caselli, P., Walmsley, C. M., Zucconi, A., Tafalla, M., Dore, L., & Myers, P. C.: ApJ, 565, 331 (2002)
- (7) Hogerheijde, M.R., & van der Tak, F. F. S.: A&A, 362, 697 (2000)
- (8) Galli, D., Walmsley, M., & Gonçalves, J.: A&A, 394, 275 (2002)
- (9) Caselli, P., Walmsley, C. M., Zucconi, A., Tafalla, M., Dore, L., & Myers, P. C.: ApJ, 565, 344 (2002)
- (10) Ciolek, G. E. & Basu, S.: ApJ, 529, 925 (2000)