Abstract
There has been extensive recent progress in X-ray observations of clusters of galaxies with the analysis of the entire ASCA database and recent new results from Beppo-SAX, Chandra, and XMM-Newton. The temperature profiles of most clusters are isothermal from 0.05–0.6 , contrary to theoretical expectations and early results from ASCA. Similarly, the abundance profiles of Fe are roughly constant outside the central regions. The luminosity-temperature relation for a very large sample of clusters show that over the whole observable luminosity range at low redshift, but the variance increases at low luminosity, explaining the previously claimed steepening at low luminosity. Recent accurate cluster photometry in red and infrared passbands have resulted in much better correlations of optical and X-ray properties, but there is still larger scatter than one might expect between total light and X-ray temperature and luminosity. The velocity dispersion and the X-ray temperature are strongly correlated, but the slope of the relation is somewhat steeper than expected. The surface brightness profiles of clusters are very well fit by the isothermal model out to large radii and show scaling relations, outside the central regions, consistent with a -dominated Universe.
At high masses the gas mass fraction of clusters is quite uniform and is consistent with the low WMAP value of . The recent analysis of cluster mass-to-light ratio and the mass-to-light ratio of stars indicates that the ratio of gas to stellar mass is 10:1 in massive clusters. There is an apparent decrease in gas mass fraction and increase in stellar mass fraction at lower mass scales, but the very flat surface brightness of the X-ray emission makes extension of this result to large scale lengths uncertain. The normalization of the scaling of mass with temperature, derived from measurements of density and temperature profiles and assuming hydrostatic equilibrium, is lower than predicted from simulations that do not include gas cooling or heating and has a slightly steeper slope. Detailed Chandra and XMM-Newton imaging spectroscopy of several clusters show that the form of the potential is consistent with the parameterization of Navarro, Frenk, & White (1997) over a factor of 100 in length scale and that there is no evidence for a dark matter core. Chandra X-ray images have revealed rather complex internal structures in the central regions of some clusters, which are probably due to the effects of mergers; however, their nature is still not completely clear.
There are now more than 100 clusters with well-determined Fe abundance, several with accurate values at redshifts , with little or no evidence for evolution in the Fe abundance with redshift. There is real variance in the Fe abundance from cluster to cluster, with a trend for clusters with higher gas densities to have higher Fe abundances. The Si, S, and Ni abundances do not follow patterns consistent with simple sums of standard Type Ia and Type II supernova, indicating that the origin of the elements in clusters is different from that in the Milky Way. The Si/Fe abundance rises with cluster mass, but the S/Fe ratio does not. The high Ni/Fe ratio indicates the importance of Type Ia supernovae. XMM-Newton grating spectra of the central regions of clusters have derived precise O, Ne, Mg, and Fe abundances. XMM-Newton CCD data are allowing O abundances to be measured for a large number of clusters.
Chapter 0 Clusters of Galaxies: An X-ray Perspective
1 Introduction
Clusters of galaxies are the largest and most massive collapsed objects in the Universe, and as such they are sensitive probes of the history of structure formation. While first discovered in the optical band in the 1930’s (for a review, see Bahcall 1977a), in same ways the name is a misnomer since most of the baryons and metals are in the hot X-ray emitting intracluster medium and thus they are basically “X-ray objects.” Studies of their evolution can place strong constraints on all theories of large-scale structure and determine precise values for many of the cosmological parameters. As opposed to galaxies, clusters probably retain all the enriched material created in them and being essentially closed boxes they provide an unbiased record of nucleosynthesis in the Universe. Thus, measurement of the elemental abundances and their evolution provide fundamental data for the origin of the elements. The distribution of the elements in clusters reveals how the metals were removed from stellar systems into the intergalactic medium (IGM). Clusters should be fair samples of the Universe, and studies of their mass and their baryon fraction reveal the gross properties of the Universe as a whole. Since most of the baryons are in the gaseous phase and clusters are dark matter dominated, the detailed physics of cooling and star formation are much less important than in galaxies. This makes clusters much more amenable to detailed simulations than galaxies or other systems in which star formation has been an overriding process. Detailed measurements of their density and temperature profiles allow an accurate determination of the dark matter profile and total mass. While gravity is clearly dominant in massive systems, much of the entropy of the gas in low-mass systems maybe produced by nongravitational processes.
Clusters are luminous, extended X-ray sources and are visible out to high redshifts with present-day technology. The virial temperature of most groups and clusters corresponds to K (velocity dispersions of 180–1200 km s-1), and while lower mass systems certainly exist, we usually call them galaxies. Most of the baryons in groups and clusters of galaxies lie in the hot X-ray emitting gas, which is in virial equilibrium with the dark matter potential well [the ratio of gas to stellar mass is (2–10):1; Ettori & Fabian 1999]. This gas is enriched in heavy elements (Mushotzky et al. 1978) and is thus the reservoir of stellar evolution in these systems. The presence of heavy elements is revealed by line emission from H and He-like transitions, as well as L-shell transitions of the abundant elements. Most clusters and groups are too hot to have significant line emission from C or N, but all abundant elements with (O) have strong lines from H and He-like states in the X-ray band, and their abundances can be well determined.
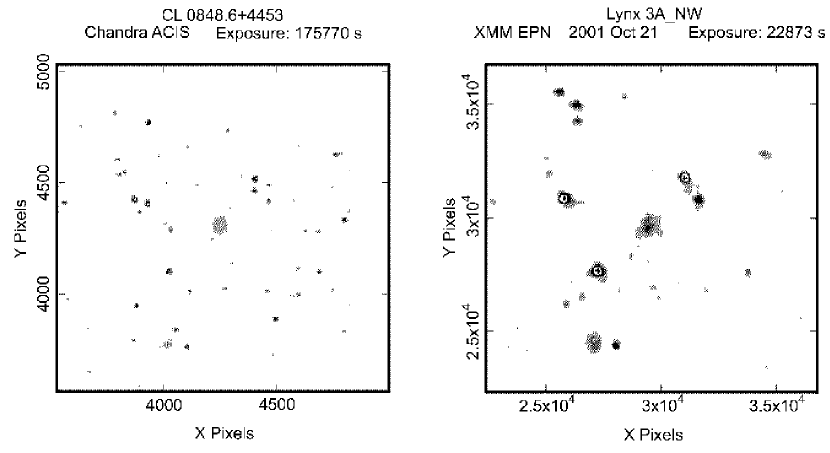
Clusters of galaxies were discovered as X-ray sources in the late 1960’s (see Mushotzky 2002 for a historical review), and large samples were first obtained with the Uhuru satellite in the early 1970’s (Jones & Forman 1978). Large samples of X-ray spectra and images were first obtained in the late 1970’s with the HEAO satellites (see Forman & Jones 1982 for an early review). The early 1990’s brought large samples of high-quality images with the ROSAT satellite and good quality spectra with ASCA and Beppo-SAX. In the last three years there has been an enormous increase in the capabilities of X-ray instrumentation due to the launch and operation of Chandra and XMM-Newton. Both Chandra and XMM-Newton can find and identify clusters out to , and their morphologies can be clearly discerned to (Fig. 1.1). The cluster temperatures can be measured to , and XMM-Newton can determine their overall chemical abundances to with sufficiently long exposures (very recently the temperature and abundance of a cluster at = 1.15 was measured accurately in a 1 Ms XMM-Newton exposure; Hasinger et al. 2004). Temperature and abundance profiles to can be well measured and large samples of X-ray selected clusters can be derived. Chandra can observe correlated radio/X-ray structure out to and has discovered internal structure in clusters. The XMM-Newton grating spectra can determine accurate abundances for the central regions of clusters, in a model independent fashion, for O, Ne, Mg, Fe, and Si.
It is virtually impossible to give a balanced review of the present observational state of X-ray cluster research, with more than 100 papers published each year. I will not say much about those issues for which we have had detailed talks at this meeting: cooling flows, high-redshift clusters and evolution, X-ray data and the Sunyaev-Zel’dovich effect, radio source interaction, X-ray selected active galaxies in clusters, X-ray emission from groups, and detailed comparison of masses derived from lensing and X-ray observations. Other areas, such as the presence of nonthermal emission and the existence of very soft components, were not discussed. Even limiting the talk this much results in an abundance of material. However, for the purposes of continuity, I have included some material that overlaps with the reviews on chemical abundance given by Renzini (2004) and on groups by Mulchaey (2004). This review does not consider work published after February 2003.
2 Temperature Structure of Clusters
As discussed in detail by Evrard (2004), we now have a detailed understanding of the formation of the dark matter structure for clusters of galaxies. If gravity has completely controlled the formation of structure, one predicts that the gas should be in hydrostatic equilibrium with the vast majority of the pressure being due to gas pressure. If this is true, its density and temperature structure provide a detailed measurement of the dark matter distribution in the cluster. Recent theoretical work has also taken into account other process such as cooling and turbulence, which can be important. The fundamental form of the Navarro, Frenk, & White (1997; hereafter NFW) dark matter potential and the assumption that the fraction of the total mass that is in gas is constant with radius result in a prediction, both from analytic (Komatsu & Seljak 2001) and numerical modeling (Loken et al. 2002), that the cluster gas should have a declining temperature profile at a sufficiently large distance from the center (in units of ). The size of the temperature drop in the outer regions is predicted to be roughly a factor of 2 by , which is consistent with the ASCA results of Markevitch (1998). However, there is considerable controversy about the analysis and interpretation of temperature profiles before XMM-Newton and Chandra. Results from both ASCA (Kikiuchi et al. 1999; White & Buote 2000) and Beppo-SAX (Irwin & Bregman 2000; De Grandi & Molendi 2002), indicate either isothermal gas or a temperature gradient in the outer regions of some “cooling flow” clusters. XMM-Newton is perfect for resolving this controversy, having a much better point spread function than ASCA and much more collecting area than Beppo-SAX and Chandra, and having a larger field of view than Chandra. However, there is a selection effect due to the smaller XMM-Newton field of view than ASCA, and in order to go out to the virial radius in one pointing one must observe clusters at .
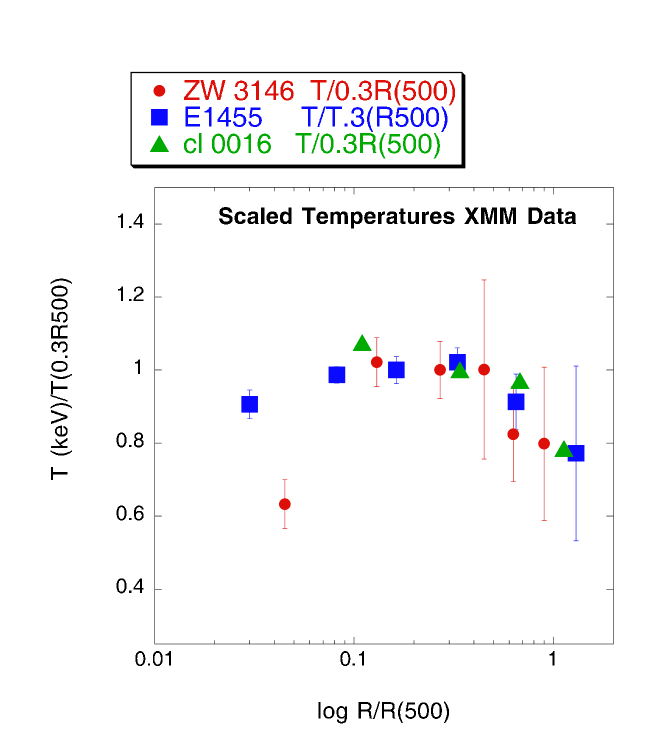
There are several published temperature profiles from XMM-Newton (Tamura et al. 2001; Majerowicz, Neumann, & Reiprich 2002; Pratt & Arnaud 2002) and I have analyzed several other moderate redshift clusters and others were presented at this conference (Jones et al. 2004). With the exception of one object (A1101S; Kaastra et al. 2001) all the published XMM-Newton profiles are consistent with isothermal profiles out to (Fig. 1.2), which is in strong disagreement with the numerical and analytic modeling. This sample of 12 objects is highly biased to smooth, centrally condensed clusters (with the exception of Coma, which has been known to be isothermal from the early work of Hughes et al. 1988). The data for A2163 are consistent with a temperature drop at even larger radii (Pratt, Arnaud, & Aghanim 2002), but the relatively high XMM-Newton background makes the results somewhat uncertain. The origin of the difference between some of the Beppo-SAX, ASCA, and XMM-Newton results is not clear. It is possible that there is a difference between the low- systems studied by Beppo-SAX and ASCA and the higher-redshift systems studied by XMM-Newton and/or a selection effect in the objects so far analyzed with XMM-Newton. While the Chandra data do not go out to very large length scales (Allen, Schmidt, & Fabian 2002), analysis of 2 clusters with Chandra (Ettori & Lombardi 2003) also show isothermal profiles.
We must now take seriously the disagreement between theory and observation in the temperature profiles in comparing cluster properties with simulations. Another serious issue is the inability of theoretical models to match the observed temperature drops in the centers of the “cooling flow” clusters. The question is then, what is the origin of the discrepancy? Several possibilities are that the form of the theoretical potential is incorrect, that the gas distribution is not calculated correctly, or that physics other than gravity needs to be included.
As shown below (§1.8) the form of the potential from X-ray imaging spectroscopy agrees quite well with the NFW potential, which is consistent with the analytic work. ROSAT and XMM-Newton analysis of X-ray surface brightness distributions (§1.5) shows that the model is a good description of the X-ray surface brightness at large radii. This leaves us with the possibility that additional physics is needed. Recent analysis of Chandra data (cf. Markevitch et al. 2003) strongly constrains the effects of conduction, which will tend to make isothermal spectra, while the inclusion of cooling and heating in the theoretical models (Loken et al. 2002) does not seem to affect the temperature profile significantly. Thus, the origin of this severe discrepancy is not currently known.
3 Luminosity-Temperature Relation for Clusters
As pointed out by Kaiser (1986), simple scaling relations predict that the cluster luminosity should scale as the temperature squared (). To see this, note that the X-ray luminosity should scale as the density squared times the volume times the gas emissivity, . The mass of gas scales like , and it is assumed that the total mass scales as . Since the emissivity for bremsstrahlung, the prime cooling mechanism in gas hotter than 2 keV, scales as (Sutherland & Dopita 1993), one has . Finally, since, theoretically, the total mass scales as , one has . The other free parameter, the average density, is related to the mass and collapse epoch of the cluster.
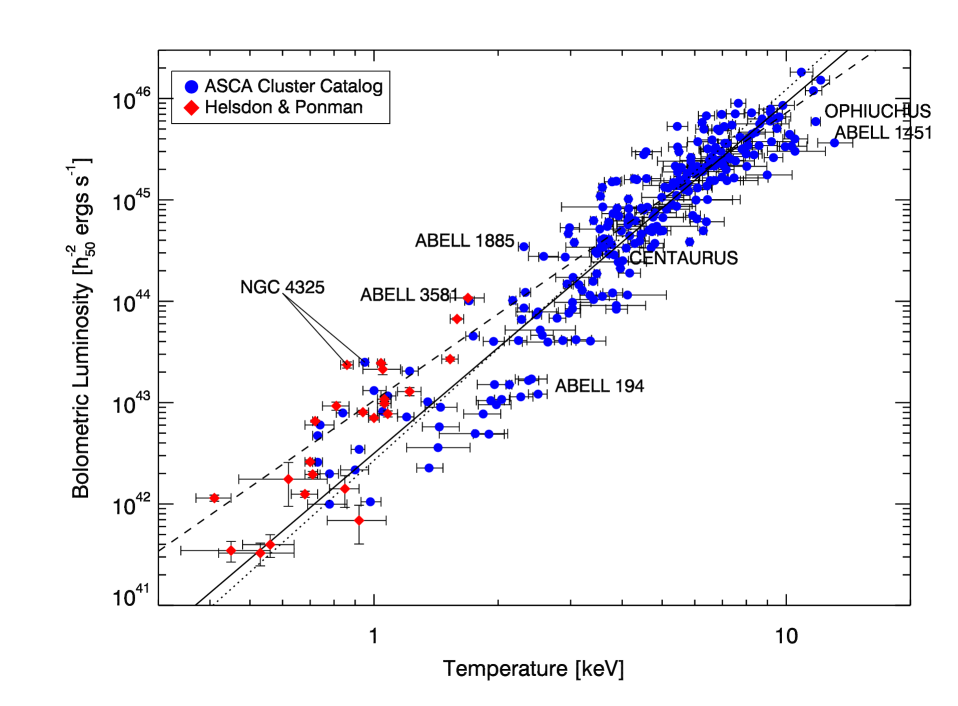
It has been known for 20 years (Mushotzky 1984) that the actual relationship between temperature and luminosity is steeper than the simplest theoretical prediction. Recently, Horner et al. (2004) have examined the relation using the largest sample of clusters to date (270 clusters taken from the ASCA database). In this sample one finds that, over a factor of in luminosity, the luminosity scales as . As one goes to lower luminosities there is a wider range of luminosity at a fixed temperature (Fig. 1.3), but there is no need to change the scaling law. This increase in variance probably explains the steeper fit at low luminosity found by Helsdon & Ponman (2000). This continuity is rather strange, since at keV the cooling function changes sign and scales more like , and thus the theoretical relation between and changes slope.
There have been many papers written about the origin of the discrepancy, but the main conclusion is that it is due to the breaking of scaling laws via the inclusion of physics other than gravity. The same physics that helps to explain the deviation of entropy in groups, such as heating and cooling, can also explain the slope and normalization of the relation (see Mulchaey 2004 and Borgani et al. 2002). Another indication of this scale breaking is the relative low level of evolution in the relation out to (Borgani et al. 2002) which is not what is predicted in simple theories of cluster evolution, since objects at are predicted to be denser and have a higher temperature for a fixed mass. Simple scaling predicts that , and thus one predicts at a fixed mass, which is not seen (but see Vikhlinin et al. 2002 for a different opinion).
It was pointed out by Fabian et al. (1994) that high central density, short cooling time clusters (alias “cooling flow” clusters) have a considerably higher luminosity for their temperature than non-cooling flow systems. This result is confirmed in the larger Horner et al. (2004) sample. Markevitch (1998) removed the high-central surface brightness central regions from these clusters and found that the scatter in the relationship was much reduced and the fit was flatter than . If the scatter in the relationship was due to cool gas in the center of the cooling flow clusters, one should expect that the ROSAT luminosities, which are very sensitive to low-temperature gas, would be systematically larger than the luminosities calculated from isothermal fits to the ASCA data. However, Horner et al. (2004) find that the bolometric luminosities obtained by ASCA are in very good agreement with the ROSAT results. This indicates that the central luminosity “excess” is not due to cool gas, as was originally shown in the ASCA data for the Centaurus cluster (Ikebe et al. 1999) and recently shown in detail by XMM-Newton spectroscopy of many cooling flow clusters (Peterson et al. 2003). Horner et al. (2004) find that the most reasonable explanation for the higher luminosity of the cooling flow clusters is due to their higher central density in the core. This result is consistent with the detailed analysis of cluster surface brightness profiles by Neumann & Arnaud (2001) (see §1.5). It thus seems that the scatter in the relation at high temperatures is due to differing cluster central gas densities, while the scatter at low temperatures is due to different “amounts” of additional, nongravitational physics.
4 Optical Light, Velocity Dispersion, and X-ray Properties
It has been known since the early Uhuru results (Jones & Forman 1978) that there is a great degree of scatter in the correlation between cataloged optical properties, such as Abell richness, and X-ray properties, such as luminosity and temperature. The best correlations between optical and x-ray properties seen in the early data were between central galaxy density and X-ray luminosity (Bahcall 1977b), and between X-ray temperature and optical velocity dispersion (Edge & Stewart 1991). The wide scatter is nicely illustrated in Figure 5 of Borgani & Guzzo (2001)which shows that the Abell counts are only weakly related to total mass, while the x-ray luminosity is strong correlated.
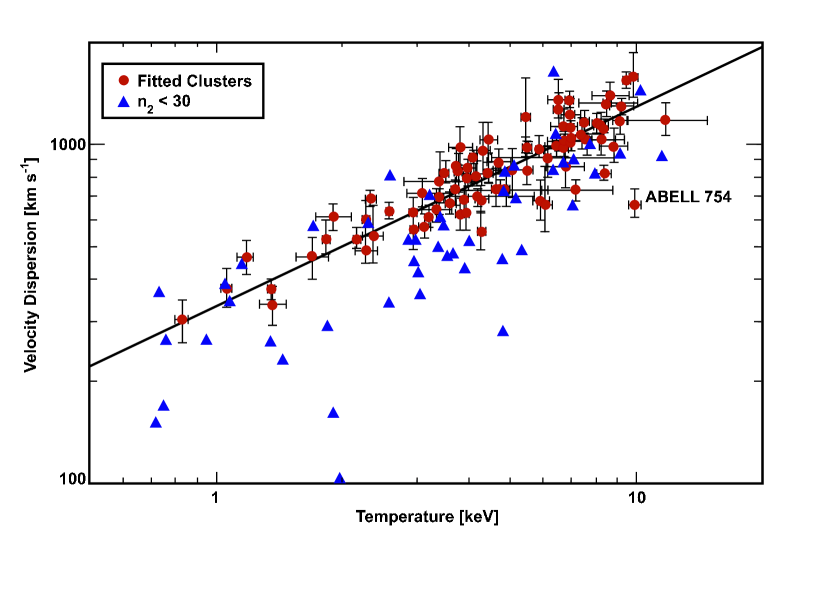
Bird, Mushotzky, & Metzler (1995) showed that much of the scatter in the temperature - velocity dispersion correlation was due to undersampled optical data and velocity substructure in the clusters. More recent optical and X-ray work (Girardi et al. 1998; Horner et al. 2004) shows that when the velocities of a sufficient number of galaxies in a cluster are measured (one needs more than 30 galaxies) (Fig. 1.4) there is a tight relation between velocity dispersion and temperature of the form , consistent with the work of Bird et al. (1995) and close to the theoretical slope of 0.5. This has been confirmed in an infrared-selected sample by Kochanek et al. (2003). The normalization of this relation at high temperatures agrees with theoretical work (Evrard 2004), and thus one has to conclude that low-velocity dispersion clusters are too hot for their dispersion, or that low-temperature clusters have too low a dispersion for their temperature. The fact that clusters have very small radial velocity dispersion gradients (Biviano & Girardi 2003) or temperature gradients (§1.2) makes comparison of the average temperature and velocity dispersion meaningful. This variation with temperature of the velocity dispersion to temperature ratio will also change the effective X-ray vs. optically determined mass by a factor of 50% over the full mass range of clusters.
Recent 2MASS work by Kochanek et al. (2003) shows that, if the “optical” data are handled carefully (e.g., accurate photometry, well-defined selection criteria, observing in a red passband, etc.), there is a strong relation between the total light in a cluster and the X-ray temperature and luminosity (also see Yee & Ellingson 2003). However, while the correlations are much better than in previous work, the scatter in the relation is large, almost a factor of 10 in light at a fixed X-ray temperature or luminosity, or, alternatively, a factor of 2 in temperature at a fixed optical luminosity. Thus, one expects that optical and X-ray catalogs of clusters might differ considerably depending on where the cuts are made. There is no evidence for either optically or X-ray quiet clusters, but there is evidence for relatively optically or X-ray bright objects. The nature and origin of this variance is not understood at present, but, given the quality of modern data, this variance seems to be real, rather than due to measurement uncertainties. Assuming that the X-ray properties accurately trace mass, the -band light is a mass indicator accurate to 50% (Lin, Mohr, & Stanford 2003). The converse test, estimating the mass from the optical data and comparing it to the X-ray data, shows large scatter (Yee & Ellingson 2003), where the temperature data are taken from the literature. If it is indeed the case that there is a large variation in the ratio of optical light to X-ray temperature, this indicates that there is a considerable variance in cluster mass-to-light ratio at a fixed mass. This would be a major challenge to structure formation theories.
5 Surface Brightness Profiles
It has been known since the pioneering work of Jones & Forman (1984) that the surface brightness profiles of most clusters can be well fit, at large radii, by the “isothermal” model, , with a central excess above the model in cooling flow clusters. As seen in ROSAT data for high-redshift systems (Vikhlinin, Forman, & Jones 1999), the model fits amazingly well out to the largest radii measurable for massive clusters. The fitted values of are smaller for low-mass systems (Helsdon & Ponman 2000; Mulchaey et al. 2003), but there are two selection effects that make the interpretation of this result difficult. First of all, because of their low surface brightness, the group profile hits the background at relatively small distances from the center, and thus one does not detect low-mass systems out to large fractions of the virial radius. This can introduce a bias to the fitted values of . Secondly, the effects of the central galaxy on the surface brightness is often not well determined from ROSAT PSPC data (Helsdon & Ponman 2003)and thus, frequently, the structural parameters are not well constrained. This latter effect is not present in XMM or Chandra data.
Neumann & Arnaud (2001) have pointed out that the surface brightness profiles of high-temperature clusters remain self-similar as a function of mass and redshift, as expected from cold dark matter models (see also Vikhlinin et al. 1999). Since the conversion from angle to distance depends on the cosmology, they have been able to show that the change of profile with redshift is most consistent with a dominated cosmology. The homology of the profiles is only applicable outside of the central 100 kpc, as inside this radius there are often large deviations from the scaling laws. However, in order to achieve the scaling they require that the relationship of gas mass to temperature be , steeper than the theoretical scaling between total mass and temperature (i.e., ). Since the surface brightness profiles scale according to the predicted evolution from the cold dark matter models, the lack of evolution in the luminosity-temperature law must be a cosmic conspiracy between the cosmological model and the change of density with redshift. The prediction is that the emission measure of the gas scales as , where is the overdensity of the cluster and is the fraction of mass that is in gas (Arnaud, Aghanim, & Neumann 2002).
There are “single” clusters that are not well fit by the model. The most obvious example is MS 10540321 at = 0.82 (Jeltema et al. 2001), which is much more concentrated than a model. This is not a function of redshift, since many clusters at are well fit by the model.
6 Mass of Baryons and Metals and How They Are Partitioned
The two main baryonic components of clusters are the X-ray emitting gas and the stars, since the total contribution from cold gas and dust is very small. The major uncertainty in the relative baryonic contribution is due to the uncertainty in the transformation from light to mass for the stars. Recent work from large optical surveys (Bell et al. 2003) shows that the mass-to-light ratio of stars changes as a function of galaxy but is 3.5 in the Sloan band for a bulge-dominated population. Using this value and the mean mass-to-light ratio of clusters 240 (Girardi et al. 2002), the stars have 0.015 of the total mass. The gas masses have been well determined from ROSAT data (Ettori & Fabian 1999; Allen et al. 2002) and scatter around . Thus, the gas-to-stellar mass ratio is 10:1, and the total baryon fraction is almost exactly consistent with the recent WMAP results for the Universe as a whole. Since it is thought that clusters are representative of the Universe as a whole, this suggests that the vast majority of baryons in the Universe do not lie in stars. Turning this around, one can use the baryonic fraction in clusters as a bound on (White et al. 1993). The most recent analysis using this technique finds (Allen et al. 2002), in excellent agreement with the WMAP data. It is interesting to note that the high baryonic fraction in clusters has been known for over 10 years and was one of the first strong indications of a low Universe. Since it is thought that the baryonic fraction in clusters should not evolve with redshift, derivation of the baryonic abundance in high- clusters, which depends on the luminosity distance, provides a strong constraint on cosmological parameters (Ettori & Tozzi and Rosati 2003).
The mean metallicity of the gas in clusters is 1/3 solar (see §1.10), while that of the stars may be somewhat larger. If we assume 1/2 solar abundance for the stars, than 85% of the metals are in the gas phase. Since all the metals are made in stars, which lie primarily in galaxies, this implies that most of metals have either been ejected or removed from the galaxies. Since the stellar mass is dominated by galaxies near , which have a mean escape velocity, today, of 300 km s-1, this implies very strong galactic winds at high redshift. This scenario is consistent with the results of Adelberger et al. (2003) on the high-redshift, rapidly star-forming and -band drop-out galaxies, which all have large-velocity winds.
Analysis of the gas mass fraction in groups and clusters (Sanderson et al. 2003) indicates that the fraction apparently drops at lower masses by a factor of 2–3, with the reduction setting in at a mass scale corresponding to 1–3 keV at 0.3 . In addition, the stellar mass-to-light ratio decreases by 60% over the same mass range (Marinoni & Hudson 2002), and thus in groups the gas-to-stellar mass ratio is only (1–2):1 at 0.3 , considerably smaller than in clusters. However, there is a serious problem for groups in evaluating both the gas and stellar masses at large radii (see Fig. 10 in Mulchaey et al. 2003), and this result should be taken with some caution. In particular, the X-ray surface brightness distribution of groups is often very flat, and extrapolating from 0.3 to is rather risky. However, if these trends are real, this would indicate that groups are truly baryon poor, that the baryons have been pushed out of the group, or that the gas has been puffed up. If the gas has been puffed up, this is consistent with the somewhat high temperatures of groups compared to their optical galaxy velocity dispersions, indicative of extra heat deposited in the gas, which both heats it and “puffs” it up (see discussion in the review by Mulchaey 2004).
7 Mass Scaling Laws
Detailed theoretical work has verified that clusters should satisfy the virial theorem, and thus their mass should scale as , with , and thus (e.g., Eke, Navarro, & Frenk 1998), with the normalization being set by theory and the value of the cosmological parameters (Evrard 2003). The first test of this relation (Horner, Mushotzky, & Scharf 1999) found a scaling that was somewhat steeper, with , and a normalization that was 40% lower than predicted. Finoguenov, Reiprich, & Böhringer (2001) and Reiprich & Böhringer (2002) have confirmed these results with more uniform samples, and higher quality, spatially resolved spectra. Recent Chandra results (Allen, Schmidt, & Fabian 2001) are also consistent with the Horner et al. (1999) finding. XMM-Newton data for A1413 (Pratt & Arnaud 2002) show that the normalization scaling is not only violated by the sample, but by individual objects. The normalization in the Reiprich & Böhringer (2002) sample agrees with theoretical expectations at the high-mass end. This indicates that lower-temperature clusters are less massive than expected on the basis of their temperature, consistent with the trend seen in the velocity dispersion-temperature relation. Recently, it has been pointed out (Shimizu et al. 2003) that the combination of the scaling of mass by and the gas mass fraction scaling as (a reasonable fit to the Sanderson et al. 2003 data) can reproduce the observed relationship. Theoretical calculations that include the effects of cooling (Thomas et al. 2002) seem to be consistent with the lower normalization, but so far the slope difference has not been explained.
8 Form of the Potential
As discussed extensively in this conference, the form of the potential in clusters should be determined by the distribution of dark matter. Recent numerical work seems to validate the NFW potential, and much has been made of the fact that low-mass and low-surface brightness galaxies do not seem to follow this form in their central regions. Recent Chandra and XMM-Newton observations (Allen et al. 2002; Arabadjis, Bautz, & Garmire 2002; Pratt & Arnaud 2002) have been able to determine extremely accurate mass profiles via spatially resolved X-ray spectroscopy and the assumption of hydrostatic equilibrium. Perhaps the best documented of these examples are the Chandra data for Abell 2029 (Lewis, Buote, & Stocke 2003), in which the profile is determined over a factor of 100 in length scale, from 0.001–0.1 characteristic lengths of the NFW profile, with essentially no deviation from the NFW prediction. This striking result is also seem in other Chandra results in the cores of clusters. The data show that the central regions of clusters tend to have rather steep density profiles in the innermost radii, indicating that whatever causes the deviation of the form of the potential in dwarf galaxies does not occur in clusters. This results strongly constrains interacting dark matter models (Bautz & Arabadjis 2004). A survey of Chandra central mass profiles is made somewhat difficult because of the possibly complex nature of the IGM in the central regions of many clusters, and the exact slope and normalization of the mass depends on the details of the thermal model used. However, if the data are of sufficiently high signal-to-noise ratio, the form of the mass profile can be determined precisely. I anticipate quite a few exciting new results in this area; preliminary results, presented in several conferences, indicate a predominance of steep mass profiles with slopes close to the NFW level, but with some scatter.
9 Merges, Structures, etc.
The early Einstein Observatory images of clusters (Henry et al. 1979) showed that a substantial fraction of the X-ray images were not simple, round systems, but often complex in form and sometimes even double. This observation is consistent with the idea that clusters form in a hierarchical fashion via mergers, and that the complex systems are in the process of merging. The fact that mergers are actually occurring, rather than the complex structures in the images being simply projection effects, was indicated by complexity in the temperature structure of many of these systems shown by the ROSAT (Briel & Henry 1994) and ASCA (Markevitch 1996) data. The details of the nature of this process have had to wait until the precise Chandra spectral images showed the full range of complexity. While “textbook” examples of merger shocks have been seen (e.g., 1E 065756; Markevitch et al. 2002), many of the objects show only subtle temperature variations (e.g., Sun et al. 2002). These variations have only shown up in the most recent, very high-resolution numerical simulations, indicating the non-intuitive nature of these data.
The recent spectacular XMM-Newton temperature image of the Perseus cluster (Churazov et al. 2003) illustrates the wealth of detail that is now possible to obtain. It is interesting that these spectral images do not show the numerous “cold spots” that are predicted in cluster simulations that include cooling (Motl et al. 2004). The ability to obtain spectral images has also revealed “hidden mergers.” Both the Coma and Ophiuchus clusters, the hottest nearby systems, show smooth, regular X-ray images; however, X-ray temperature maps show strong spatial variations (Arnaud et al. 2001; Watanabe et al. 2001). So far the data on abundance variations in the mergers is sparse, but the abundances seem uniform, within errors, in Coma and may vary by less than a factor of 2 in Ophiuchus. It seems as if many of the large-scale length, non-cooling flow clusters are recent mergers.
One of the surprises of the Chandra data was the discovery of surface brightness discontinuities in the surface brightness — the so-called cold fronts (Fig. 1.5; Vikhlinin & Markevitch 2002). These cold fronts are apparently contact discontinuities, across which the pressure is smoothly varying but the density and temperature change discontinuously by factors of 2. They can occur in “pure hydro” numerical simulations (Bialek, Evrard, & Mohr 2002). Their relative frequency is a indication of the merger rate. However, the details (e.g., temperature drop, size of region, etc.) and their relation to merger dynamics are not certain (Fujita et al. 2002). The stability of the cold fronts, their sizes, and shapes are indications of the strength of the magnetic field, velocity vector of the merger, and the amount of turbulence (Mazzota, Fusco-Femiano, & Vikhlinin 2002) in the cluster gas. It is clear that there is much to learn from further studies of these unexpected structures, but they already confirm that the gas is usually not strongly shocked, nor highly turbulent.
10 Abundances
As indicated above, most of the metals in the cluster lie in the hot, X-ray emitting gas. Thus, in order to understand the formation and evolution of the elements one must determine accurate abundances, the abundance distribution in the gas, and its evolution with cosmic time. Before giving the results it is important to remind the reader that the measurement of abundances in the cluster gas via X-ray imaging spectroscopy is a robust process. Most of the baryons and metals are in the hot gas, and the spectral signature of the heavy elements are relatively strong H and He-like lines (Fig. 1.6). This is a well-understood emission mechanism, with little or no radiative transfer difficulties. Because of the high temperature and short spallation times, dust is destroyed rapidly and thus is not a problem. The deep potential well captures an integrated record of all the metals produced, and thus the derived abundances are true averages of the metal production process. All the abundant elements from oxygen to nickel can have their abundances determined. Direct measurement of the electron temperature from the form of the continuum and from ratios of H to He-like lines ensures small systematic errors in the abundances. The strongest lines in the spectrum of hot clusters are due to Fe and Si, followed by O, S and Ni. The emission from Ne and Mg is blended with Fe L-shell lines from Fe XVII–XXIV at the resolution of X-ray CCDs, and the lines from Ca and Ar are weak. With present-day technology, one can measure Fe to and Si to , and can thus obtain a true measure of the metal formation mechanism and its evolution. For much of the rationale and background for cluster abundance measurements, see Renzini’s (2004) review in this volume.


Recently (Baumgartner et al. 2004; Horner et al. 2004), a uniform analysis of the ASCA cluster database of 270 clusters has been performed, which updates previous work (e.g., Mushotzky et al. 1996; Fukazawa et al. 2000) on cluster abundances. Horner et al. (2004) and Baumgartner et al. (2004) measure the average cluster Fe, Si, S, and Ni abundances with no spatial information. They find (Fig. 1.7) that the Fe abundance is not the same for all clusters, but shows a small spread of a factor of 2. In agreement with Fabian et al. (1994), the cooling flow clusters show, on average, a higher Fe abundance. There is no evidence for any evolution in the Fe abundance out to on the basis of ASCA data. Recent XMM-Newton and Chandra results (Jones et al. 2004; Mushotzky, private communication) show no evolution in the Fe abundance to . This lack of evolution indicates that the metals are created at for a cosmology ( I have added in the lifetime of the A stars that would be visible for the massive amount of star formation necessary to produce the observed metals). Since the vast majority of the metals are in the gas, the rate of specific star formation (e.g., the rate per unit visible stars) would have to be enormous to produce the elements if it were to occur at . The Fe abundance is weakly correlated with the temperature, reaching a maximum at keV, but is more or less constant for keV clusters. Given the accuracy of recent plasma codes, the “peak” in abundance, which occurs at a temperature range where both Fe L and K lines contribute to the abundance determination, is almost certainly a real effect. The physical origin of the variance in Fe abundance and the trends are unknown. However, since there are trends in the apparent ratio of starlight to gas (§1.6), this may be the cause. Further progress in this area requires an enhancement of the original work of Arnaud et al. (1992), which found a correlation between the light in elliptical galaxies and the total mass of Fe in the cluster.
The distribution of the elements in a cluster determines the total amount of material and gives clues as to how the material was deposited in the IGM. The previous generation of X-ray satellites (ASCA, ROSAT, and Beppo-SAX) derived abundance profiles of Fe in 20 clusters (Finoguenov, David, & Ponman 2000; Irwin & Bregman 2000; White & Buote 2000; De Grandi et al. 2003). However, these results did not always agree (different analysis of the same data and comparison of data from the same object from different satellites produced different results). There was a tendency for cooling flow clusters to have high central Fe abundances and larger total abundances, suggesting a different origin of IGM enrichment in the central regions, the effects of mixing by mergers on the Fe abundance profile, or a physical difference in the origin of the metals in cooling flow clusters.
XMM-Newton and Chandra data have much smaller systematic errors and much better signal-to-noise ratios than the data from the earlier observatories. Early results are available for 15 systems — most are isochemical at large radii, with several having gradients in the central 100 kpc. The Chandra and XMM-Newton data are well resolved and show that the abundance gradients are quite concentrated toward the center (cf. David et al. 2001; Tamura et al. 2001). For a few objects the profiles reach to near the virial radius (e.g., Zw 3146, Cl 0016 (Mushotzky priv. comm.) , and A 1835; Majerowicz et al. 2002), two of which (Zw 3156 and A 1835) are massive cooling flows do not show abundance gradients outside 100 kpc. Numerical evaluation of the observed Fe abundance gradients (De Grandi et al. 2003) shows that most of the variation in the average Fe abundance between the cooling flow and non-cooling flow clusters is not due to differences in the Fe gradients. The “excess” amount of Fe in the central regions seen in the cooling flow systems is correlated with the presence of a cD galaxy, and the mass of "excess" Fe is roughly consistent with its being produced in the stars in the central cD galaxy. This is rather unexpected, since isolated elliptical galaxies have only 1/5 of the Fe that should have been produced by the stars (Awaki et al. 1994).
The fact that gradients do not dominate the average abundance allows a direct interpretation of the ASCA average abundances. The ASCA database of 270 X-ray spectra allow determination of average Fe, Si , S, and Ni in clusters of galaxies (Baumgartner et al. 2004). However, the signal-to-noise ratio for most of the individual clusters is not adequate to derive robust S or Ni abundances, and 20–40 objects in each temperature bin must be added together to derive average values and their variation with temperature. Since cluster mass is directly related to the temperature and line strength is also directly connected to temperature, this is the natural space for averaging. As originally pointed out by Fukazawa et al. (2000), as increases, Si/Fe increases. However, the new data show that S remains roughly constant versus temperature. Baumgartner et al. (2004) also find that the Ni/Fe ratio is approximately 3 times solar. While these are very surprising results, they are similar to previous analysis of smaller ASCA and XMM-Newton data sets. The S/Fe, Si/Fe, and Ni/Fe ratios depend on the relative abundance of the types of supernovae (SNe). Type Ia SNe produce mostly Fe and Ni, while Type II SNe produce a wide range of elements but large ratios of the elements (O, Ne, and Si) to Fe. Si and S are produced via very similar mechanisms, and at first sight it is hard to understand how they could have different abundance patterns. In addition, in the Milky Way, S almost always directly tracks Si. The fact that both Si/Fe and S/Fe drop as Fe increases shows that there is indeed a difference in the mechanisms producing the metals as a function of mass scale. It seems rather unexpected that the ratio of Type II to Type Ia SNe in the stars that live in cluster galaxies should change with the mass scale of the cluster. However, the high Ni/Fe ratio indicates that Type Ia SNe are important in the production of Fe, at least in the central regions of clusters (Dupke & White 2000), and this high ratio does not allow a simple variation in SN type with cluster mass to readily explain the abundances patterns seen in the ASCA data.
XMM-Newton data allow the measurement of O abundances for a reasonable sample of objects for the first time. The best sample published to date is based on the high-resolution RGS data (Peterson et al. 2003). They find that the O/Fe ratio varies by a factor of 2 from cluster to cluster, with no apparent correlation with temperature. Analysis of XMM-Newton CCD data taken over a larger scale (the RGS data sample only the central of the cluster) confirm this variance. As noted in Gibson, Loewenstein, & Mushotzky (1997), the elemental abundance ratios averaged over the cluster do not agree with any simple ratio of Type Ia to Type II SNe. However, it is clear that over 90% of the O, Ne, and Mg must originate in Type II SNe.
The new XMM-Newton O abundances further strengthen this conclusion. However, some of the difficulties may be caused by differential abundance gradients of different elements. There are strong indications from ASCA data (Fukazawa et al. 2000; Finoguenov et al. 2001) that the Fe/Si ratio rises in the cluster centers, consistent with the cD galaxy being a source of Fe-rich material, probably due to Type Is SNe. However, the new XMM-Newton data show that O does not follow this pattern. It is clear that more work is necessary with larger samples and abundance profiles before we can obtain a clear picture of the metal enrichment process in clusters.
11 Conclusion
The progress in this field in the last 10 years has been amazing. The X-ray properties of objects at redshift are routinely measured, and clusters are now X-ray detected at . The use of clusters for cosmology, an area covered in the volume by Freedman (2004), is exploding. The physics of clusters and groups holds the key to understanding the origin and evolution of structure and the origin of the elements. It was the cluster data that first showed that most of the baryons and metals in the Universe are in the hot phase, and that the baryonic Universe, as seen by our eyes, is only a shadow of the real Universe. In the next few years we will continue to obtain vast amounts of new data from Chandra and XMM-Newton, and much of the present observations will be analyzed, interpreted, and new patterns found. There are over 400 Chandra and XMM-Newton observations of clusters and groups in the database so far, with many more to be observed over the lifetimes of these telescopes. I anticipate many major new discoveries based on these instruments. Furthermore, the launch of Astro-E2 in 2005 will allow detailed measurements of cluster turbulence, accurate abundances of many elements outside the cluster cores, and direct measures of the thermodynamic properties of the gas.
The field has benefited enormously from the synergistic interaction of theory and observation. Most theorists and observers are now aware of the major issues and the current observational capabilities. Looking beyond the next few years, I anticipate that a major new X-ray survey, perhaps 30 times better than ROSAT, will fly, producing an extremely large and uniform cluster catalog complete out to . In the more distant future, the Constellation-X mission will provide precision temperatures and abundances out to the highest redshifts that clusters exist.
Acknowledgements. I would like to thank my long-time collaborators and students at Goddard for their major contribution to this work: Keith Arnaud, Wayne Baumgartner, Don Horner, Mike Loewenstein, and John Mulchaey. I would like to thank the Chandra and XMM-Newton projects for their major efforts in developing, launching, and operating these amazing instruments. I would also like to thank the ASCA team for their pioneering efforts in the first X-ray imaging spectroscopy mission. I thank M. Arnaud and D. Neumann for communicating results ahead of publication. I also thank the organizers, especially John Mulchaey, for an exciting and stimulating meeting.
References
- [1] Adelberger, Kurt L., Steidel, C. C., Shapley, A. E., & Pettini, M. 2003, ApJ, 584, 45
- [2] Allen, S. W., Schmidt R. W., & Fabian A. C. 2001, MNRAS, 328, L37
- [3] ——. 2002, MNRAS, 334, L11
- [4] Arabadjis, J. S., Bautz, M. W., & Garmire, G. P. 2002, ApJ, 572, 66
- [5] Arnaud, M., et al. 2001, å, 365, 67
- [6] Arnaud, M., Aghanim, N., & Neumann, D. M. 2002, å, 389, 1
- [7] Arnaud, M., Rothenflug, R., Boulade, O., Vigroux, L., & Vangioni-Flam, E. 1992, å, 254, 49
- [8] Awaki, H., et al. 1994, PASJ, 46, L65
- [9] Bahcall, N. A. 1977a, ARA&A, 15, 505
- [10] ——. 1977b, ApJ, 218, 9
- [11] Baumgartner, W., et al. 2004, in preparation
- [12] Bautz, M. W., & Arabadjis, J. S. 2004, in Carnegie Observatories Astrophysics Series, Vol. 3: Clusters of Galaxies: Probes of Cosmological Structure and Galaxy Evolution, ed. J. S. Mulchaey, A. Dressler, & A. Oemler (Pasadena: Carnegie Observatories, http://www.ociw.edu/ociw/symposia/series/symposium3/proceedings.html)
- [13] Bell, E. F., McIntosh, D. H., Katz, N., & Weinberg, M. D. 2003, ApJ, 585, L117
- [14] Bialek, J. J., Evrard, A. E., & Mohr, J. J. 2002, ApJ, 578, L9
- [15] Bird, C. M., Mushotzky, R. F., & Metzler, C. A. 1995, ApJ, 453, 40
- [16] Biviano, A., & Girardi, M. 2003, ApJ, 585, 205
- [17] Borgani S., Governato F., Wadsley, J., Menci, N., Tozzi, P., Quinn, T., Stadel, J., & Lake, G. 2002, MNRAS, 336, 409
- [18] Borgani, S., & Guzzo, L. 2001, Nature, 409, 39
- [19] Briel, U. G., & Henry, J. P. 1994, Nature, 372, 439
- [20] Churazov, E., Forman, W., Jones, C., & Böhringer, H. 2003, ApJ, 590, 225
- [21] David, L. P., Nulsen, P. E. J., McNamara, B. R., Forman, W., Jones, C., Ponman, T., Robertson, B., & Wise, M. 2001, ApJ, 557, 546
- [22] De Grandi, S., et al. 2003, Ringberg Conference Proceedings (XXX)
- [23] De Grandi, S., & Molendi, S. 2002, ApJ, 567, 163
- [24] Dupke, R. A., & White, R. E., III 2000, ApJ, 528, 139
- [25] Edge, A. C., & Stewart, G. C. 1991, MNRAS, 252, 428
- [26] Eke, V. R., Navarro, J. F., & Frenk, C. S. 1998, ApJ, 503, 569
- [27] Ettori, S., & Fabian, A. C 1999, MNRAS, 305, 834
- [28] Ettori, S., & Lombardi, M. 2003, å, 398, L5
- [29] Ettori, S., Tozzi, P., & Rosati, P. 2003, å, 398, 879
- [30] Evrard, A. E. 2004, in Carnegie Observatories Astrophysics Series, Vol. 3: Clusters of Galaxies: Probes of Cosmological Structure and Galaxy Evolution, ed. J. S. Mulchaey, A. Dressler, & A. Oemler (Cambridge: Cambridge Univ. Press), in press
- [31] Fabian, A. C., Crawford, C. S., Edge, A. C., & Mushotzky, R. F. 1994, MNRAS, 267, 779
- [32] Finoguenov, A., David, L. P., & Ponman, T. J. 2000, ApJ, 544, 188
- [33] Finoguenov, A., Reiprich, T. H., & Böhringer, H., 2001, å, 330, 749
- [34] Forman, W., & Jones, C. 1982, ARA&A, 20, 547
- [35] Freedman, W. L., ed. 2004, Carnegie Observatories Astrophysics Series, Vol. 2: Measuring and Modeling the Universe (Cambridge: Cambridge Univ. Press), in press
- [36] Fujita, Y., Sarazin, C. L., Nagashima, M., & Yano, T. 2002, ApJ, 577, 11
- [37] Fukazawa, Y., Makishima, K., Tamura, T., Nakazawa, K., Ezawa, H., Ikebe, Y., Kikuchi, K., & Ohashi, T. 2000, MNRAS, 313, 21
- [38] Gibson, B. K., Loewenstein, M., & Mushotzky, R. F. 1997, MNRAS, 290, 623
- [39] Girardi, M., Giuricin, G., Mardirossian, F., Mezzetti, M., & Boschin, W. 1998, ApJ, 505, 74
- [40] Girardi, M., Manzato, P., Mezzetti, M., Giuricin, G., & Limboz, F. 2002, ApJ, 569, 720
- [41] Hasinger, G., et al. 2004, in preparation
- [42] Helsdon, S. F., & Ponman, T. J. 2000, MNRAS, 315, 356
- [43] ——. 2003, MNRAS, 340, 485
- [44] Henry, J. P., Branduardi, G., Briel, U., Fabricant, D., Feigelson, E., Murray, S., Soltan, A., & Tananbaum, H. 1979, ApJ, 234, L15
- [45] Horner, D. J. 2001, Ph.D. Thesis, Univ. Maryland
- [46] Horner, D. J., et al. 2004, in preparation
- [47] Horner, D. J., Mushotzky, R. F., & Scharf, C. A. 1999, ApJ, 520, 78
- [48] Hughes, J. P., Yamashita, K., Okumura, Y., Tsunemi, H., & Matsuoka, M. 1988, ApJ, 327, 615
- [49] Ikebe, Y., Makishima, K., Fukazawa, Y., Tamura, T., Xu, H., Ohashi, T., & Matsushita, K. 1999, ApJ, 525, 58
- [50] Irwin, J. A., & Bregman, J. N. 2000, ApJ, 538, 543
- [51] Jeltema, T. E., Canizares, C. R., Bautz, M. W., Malm, M. R., Donahue, M., & Garmire, G. P. 2001, ApJ, 562, 124
- [52] Jones, C., & Forman, W. 1978, ApJ, 224, 1
- [53] ——. 1984, ApJ, 276, 38
- [54] Jones, L. R., et al. 2004, in Carnegie Observatories Astrophysics Series, Vol. 3: Clusters of Galaxies: Probes of Cosmological Structure and Galaxy Evolution, ed. J. S. Mulchaey, A. Dressler, & A. Oemler (Pasadena: Carnegie Observatories, http://www.ociw.edu/ociw/symposia/series/symposium3/proceedings.html)
- [55] Kaastra, J. S., Ferrigno, C., Tamura, T., Paerels, F. B. S., Peterson, J. R., & Mittaz, J. P. D. 2001, å, 365, L99
- [56] Kaiser, N. 1986, MNRAS, 222, 323
- [57] Kikuchi, K., Furusho, T., Ezawa, H., Yamasaki, N. Y., Ohashi, T., Fukazawa, Y., & Ikebe, Y. 1999, PASJ, 51, 301
- [58] Kochanek, C. S., White, M., Huchra, J., Macri, L., Jarrett, T. H., Schneider, S. E., & Mader, J. 2003, ApJ, 585, 161
- [59] Komatsu, E., & Seljak, U. 2001, MNRAS, 327, 1353
- [60] Lewis, A. D., Buote, D. A., & Stocke, J. T. 2003, ApJ, 586, 135
- [61] Lin, Y.-T., Mohr, J. J., & Stanford, S. A. 2003, ApJ, in press (astro-ph/0304033)
- [62] Loken, C., Norman, M. L., Nelson, E., Burns, J., Bryan, G. L., & Motl, P. 2002, ApJ, 579, 571
- [63] Majerowicz, S., Neumann, D. M., & Reiprich, T. 2002, å, 394, 77
- [64] Marinoni, C., & Hudson, M. J. 2002, ApJ, 569, 101
- [65] Markevitch, M. 1996, ApJ, 465, L1
- [66] ——. 1998, ApJ, 504, 27
- [67] Markevitch, M., et al. 2003, ApJ, 586, L19
- [68] Markevitch, M., Gonzalez, A. H., David, L., Vikhlinin, A., Murray, S., Forman, W., Jones, C., & Tucker, W. 2002, ApJ, 567, L27
- [69] Mazzotta, P., Fusco-Femiano, R., & Vikhlinin, A. 2002, ApJ, 569, L31
- [70] Motl, P. M., Burns, J. O., Loken, C., Norman, M. L., & Bryan, G. 2004, ApJ, in press (astro-ph/0302427)
- [71] Mulchaey, J. S. 2004, in Carnegie Observatories Astrophysics Series, Vol. 3: Clusters of Galaxies: Probes of Cosmological Structure and Galaxy Evolution, ed. J. S. Mulchaey, A. Dressler, & A. Oemler (Cambridge: Cambridge Univ. Press), in press
- [72] Mulchaey, J. S., Davis, D. S., Mushotzky, R. F., & Burstein, D. 2003, ApJS, 145, 39
- [73] Mushotzky, R. F. 1984, Physica Scripta, 7, 157
- [74] ——. 2002, in A Century of Space Science, ed. J. A. M. Bleecker, J. Geis, & M. Huber (Dordrecht: Kluwer), 473
- [75] Mushotzky, R. F., Loewenstein, M., Arnaud, K. A., Tamura, T., Fukazawa, Y., Matsushita, K., Kikuchi, K., & Hatsukade, I. 1996, ApJ, 466, 686
- [76] Mushotzky, R. F., Serlemitsos, P. J., Boldt, E. A., Holt, S. S., & Smith, B. W. 1978, ApJ, 225, 21
- [77] Navarro, J. F., Frenk, C. S., & White, S. D. M. 1997, ApJ, 490, 493 (NFW)
- [78] Neumann, D. M., & Arnaud, M. 2001, å, 373, L33
- [79] Peterson, J. R., Kahn, S. M., Paerels, F. B. S., Kaastra, J. S., Tamura, T., Bleeker, J. A. M., Ferrigno, C., & Jernigan, J. G. 2003, ApJ, 590, 207
- [80] Pratt, G. W., & Arnaud, M. 2002, å, 394, 375
- [81] Pratt, G. W., Arnaud, M., & Aghanim, N. 2002, in Tracing Cosmic Evolution with Galaxy Clusters, ed. S. Borgani, M. Mezzetti, & R. Valdarnini (San Francisco: ASP), 433
- [82] Reiprich, T. H., & Böhringer H. 2002, ApJ, 567, 716
- [83] Renzini, A. 2004, in Carnegie Observatories Astrophysics Series, Vol. 3: Clusters of Galaxies: Probes of Cosmological Structure and Galaxy Evolution, ed. J. S. Mulchaey, A. Dressler, & A. Oemler (Cambridge: Cambridge Univ. Press), in press
- [84] Sanderson, A. J. R., Ponman, T. J., Finoguenov, A., Lloyd-Davies, E. J., & Markevitch, M. 2003, MNRAS, 340, 989
- [85] Shimizu, M., Kitayama, T., Sasaki, S., & Suto, Y. 2003, ApJ, 590, 197
- [86] Stanford, S. A., Holden, B., Rosati, P., Tozzi, P., Borgani, S., Eisenhardt, P. R., & Spinrad, H. 2001, ApJ, 552, 504
- [87] Sun, M., Murray, S. S., Markevitch, M., & Vikhlinin, A. 2002, ApJ, 565, 867
- [88] Sutherland, R. S., & Dopita, M. A. 1993, ApJS, 88, 253
- [89] Tamura, T., Bleeker, J. A. M., Kaastra, J. S., Ferrigno, C., & Molendi, S. 2001, å, 379, 107
- [90] Thomas, P. A., Muanwong, O., Kay, S. T., & Liddle, A. R. 2002, MNRAS, 330, L48
- [91] Vikhlinin, A., Forman, W., & Jones, C. 1999, ApJ, 525, 47
- [92] Vikhlinin, A. A., & Markevitch, M. L. 2002, Astron. Lett., 28, 495
- [93] Vikhlinin, A., VanSpeybroeck, L., Markevitch, M., Forman, W. R., & Grego, L. 2002, ApJ, 578, L107
- [94] Watanabe, M., Yamashita, K., Furuzawa, A., Kunieda, H., & Tawara, Y. 2001, PASJ, 53, 605
- [95] White, D. A., & Buote, D. A. 2000, MNRAS, 312, 649
- [96] White, S. D. M., Navarro, J. F., Evrard, A. E., & Frenk, C. S. 1993, Nature, 366, 429
- [97] Yee, H. K. C., & Ellingson, E. 2003, ApJ, 585, 215