Investigating the central engine of Seyfert 2 galaxies with and without Polarized Broad Lines
We study the hard X-ray emission of two samples of Seyfert 2 galaxies with and without Polarized Broad Lines (PBL). In the hard X-ray domain, absorption effects do not significantly modify the intrinsic emission
allowing
us a direct
access
to the central engine.
The purpose of this study is to compare the primary emission of the two Seyfert 2 subclasses in order to investigate
the nature of their central engine and to test unified models according to
which they both have
a hidden Seyfert 1 nucleus. We compute the average hard X-ray spectra of Seyfert 2 galaxies with and without PBL
observed
with BeppoSAX/PDS (15-136 keV).
The two spectra have a common general behavior at first sight, but investigating deeper we find differences in
the intrinsic properties of the two categories of Seyfert 2 galaxies. Sy 2
with polarized broad lines have
physical conditions close to those of Sy 1 galaxies whereas Sy 2 without PBL differ substantially, suggesting that
they may have a particular place in the scheme of Seyfert galaxies.
Key Words.:
Galaxies: active – Galaxies: nuclei – Galaxies: Seyfert – X-rays: galaxies – Methods: data analysis1 Introduction
Seyfert galaxies are classified into two spectroscopic groups based on the presence (type 1)
or absence (type 2) of
broad permitted optical emission lines. The first discovery of Polarized Broad Lines (PBL hereafter) in NGC 1068 (Antonucci & Miller, 1985)
and later in several other
Seyfert 2 galaxies
(Miller & Goodrich, 1990; Tran, 1995; Young et al., 1996; Heisler et al., 1997; Awaki et al., 2000; Moran et al., 2000; Alexander, 2001; Gu et al., 2001; Lumsden et al., 2001) suggests
that Seyfert 2
galaxies harbor a bright Seyfert 1 nucleus hidden from our view by an optically and geometrically thick obscuring
torus (“Unified models”, see the review of Antonucci (1993)). In this frame, the difference between type 1 and 2
Seyfert galaxies is only due to the viewing
angle.
X-ray observations support this model showing the presence of large column densities along the line of sight of Seyfert
2 galaxies (Risaliti et al., 1999; Guainazzi et al., 2001).
However, other observations are inconsistent with unified models, in particular in the hard X-ray domain where Zdziarski et al. (1995) and
Deluit & Courvoisier (2003) (D03 hereafter) show differences in the spectral index, energy cutoff and amount of
reflection between
Sy 1 and Sy 2 galaxies. Furthermore, Alexander (2001) refutes the absorption argument to explain the absence
of broad lines in some Sy 2 galaxies showing that the density of the absorbing medium is not linked to the detectability of broad lines.
The polarization is presumed to be due to nuclear emission scattered by a gas of electrons located further out
than the obscuring material. According to current models, the detection of polarized broad emission lines in type
2 Seyfert galaxies
implies that these objects have a Hidden Broad Line Region (HBLR henceforth).
However, not all Sy 2 galaxies that have been observed in polarized light show the presence of broad lines.
This might imply an
intrinsic difference
between Seyfert 2 with PBL (PBLs hereafter) and those with No PBL (NPBLs hereafter). We propose to
test this by studying their hard X-ray intrinsic emission in a spectral domain where absorption does not modify
significantly the primary emission.
The existence of Sy 2 without PBL could be due to the absence of a broad line region in some Sy 2 galaxies or
to the absence of a scattering medium or different physical conditions within the inner regions.
To investigate these hypotheses, we intend to describe the general emission properties
of various classes of Seyfert 2
galaxies by computing their average hard X-ray spectrum.
In D03 we computed the average spectra of Sy 1, Sy 1.5 and Sy 2 galaxies. We found that the Sy 1 and Sy 2
galaxies of our sample have
a different behavior, in
particular concerning the presence of a cutoff which is required in the Sy 1 emission and absent in the Sy 2
average spectrum. Another point of disagreement was the role played by Compton reflection
possibly influencing the Sy 2 emission, unlike Sy 1.
We pursue our investigations within the Seyfert
2 class of our sample to search for common properties between Sy 1 galaxies and the two Sy 2 subclasses. To test the
argument that the absorption is the only reason for which we cannot see the HBLR, we
consider Compton-thin Sy 2 galaxies.
After presenting the
average spectra obtained, we study physical processes
responsible for the observed X emission.
2 The Dataset
The initial sample of Seyfert 2 galaxies is that presented in D03. From the initial 22 Seyfert 2 galaxies we keep 16 objects for a total of 24 observations. Five objects have been observed several times. We apply selection criteria, presented in subsections 2.1. and 2.2., to the initial sample.
2.1 Spectropolarimetric data
This study is based on a sample composed of Seyfert 2 galaxies of two types: one presenting broad
lines in polarized light, the second for which no PBL have been detected. We point out the fact that the
non detection of broad lines does not prove definitively their genuine absence, in particular if we consider
the limitations of current spectropolarimetric instrumentation. However, the purpose of this study is
to start a comparison of the two subclasses of Seyfert 2 galaxies in the
hard X-ray domain, using the best available published information on the
presence of hidden broad lines.
The current classification of Seyfert galaxies is mainly determined by optical
criteria, summarized in Table 1.
We collected all Seyfert 2 galaxies from the recent literature (from 1980 to 2003)
for which
spectropolarimetric data are available.
Several objects of the D03 Sy 2 sample have been excluded: IRAS 18325-5926 because of its NED classification as
Sy 2 which has been questioned by
Iwasawa et al. (1995); NGC 4939 is a Sy 2 but no spectropolarimetric data is available.
NGC 5674 and ESO 103-G35 have been excluded because of their Sy 1.9 classification. Indeed, current models
generally claim that the detection of a broad H line implies the
presence of a hidden broad line region and
explain
the absence of the H line as an obscuration of this region, leading to the conclusion that Sy 1.9 galaxies
harbor a hidden Sy 1 nucleus.
In addition to spectropolarimetric considerations, we use only data with an integrated signal to noise ratio higher
than 2 in
the PDS energy range (15-136 keV). This threshold is high enough to conclude a detection by the PDS detector for a
known source.
We therefore consider in our study all Sy 2 galaxies for which both spectropolarimetric information and PDS data
of sufficient quality are available.
| Classification | Optical Properties |
|---|---|
| Seyfert 1 galaxies | broad Balmer lines |
| Seyfert 1.5 galaxies | Apparent narrow H profile |
| superposed on broad wings | |
| Seyfert 1.9 galaxies | Broad component visible in H |
| but not in H | |
| Seyfert 2 with PBL | Broad component visible only in |
| polarized Balmer lines | |
| Seyfert 2 without PBL | Broad component invisible with |
| any method |
| Source name | RA | DEC | Redshift | N1 | PBL | S/N4 | F5 | L6 |
|---|---|---|---|---|---|---|---|---|
| (h m s) | (∘ ′ ′′) | z | presence? | |||||
| IRAS 00198-7926 | 00 21 53.8 | 79 10 08.0 | 0.073 | - | N[L] | 2.10 | 2.18 | 22.9 |
| NGC 1358 | 03 33 39.5 | 05 05 20.0 | 0.013 | - | N[Mb] | 2.28 | 1.38 | 0.48 |
| IRAS 05189-2524 | 05 21 01.3 | 25 21 42.9 | 0.043 | 4.90[B] | Y[Y] | 2.66 | 1.14 | 4.04 |
| NGC 2110 | 05 52 11.2 | 07 27 20.8 | 0.008 | 2.89[H] | Y[VC] | 20.5 | 8.62 | 1.01 |
| NGC 29923 | 09 45 42.0 | 14 19 36.9 | 0.008 | 0.69[W96] | N[K,VC] | 41.0 | 11.0 | 1.35 |
| MCG 5-23-16 | 09 47 40.1 | 30 56 53.9 | 0.008 | 1.62[W97] | Y[Go] | 45.8 | 19.8 | 2.62 |
| IRAS F12072-0444 | 12 09 45.1 | 05 01 14.9 | 0.128 | 0.17[D] | N[V] | 4.88 | 1.84 | 61.3 |
| NGC 43882 | 12 25 46.7 | +12 39 44.0 | 0.008 | 42.0[B] | Y[Y] | 63.8 | 22.1 | 3.00 |
| NGC 45073 | 12 35 37.0 | 39 54 32.0 | 0.012 | 29.2[Co] | Y[Ma] | 58.1 | 19.1 | 5.12 |
| NGC 5252 | 13 38 16.3 | +04 32 20.0 | 0.023 | 4.33[Ca] | N[VC] | 2.86 | 2.26 | 2.34 |
| NGC 55063 | 14 13 14.8 | 03 12 28.0 | 0.006 | 3.40[S] | Y[VC] | 69.0 | 17.0 | 1.25 |
| NGC 6300 | 17 17 00.3 | 62 49 15.0 | 0.004 | 60.0[Le] | N[Le] | 23.1 | 8.35 | 0.22 |
| IRAS 20210+1121 | 20 23 25.6 | +11 31 32.9 | 0.056 | 6.0[U] | Y[Y] | 2.24 | 0.87 | 5.45 |
| NGC 71722 | 22 02 02.2 | 31 52 12.0 | 0.009 | 8.61[G] | N[H] | 9.73 | 4.43 | 0.65 |
| IRAS 23060+0505 | 23 08 33.8 | +05 21 29.0 | 0.173 | 8.40[Br] | Y[Y] | 4.20 | 1.79 | 111 |
| NGC 7582 | 23 18 23.5 | 42 22 11.9 | 0.005 | 12.4[X] | N[H] | 24.2 | 10.5 | 0.57 |
Notes:
1 1022 cm-2,
2 2 observations,
3 3 observations,
4 Integrated signal to noise ratio in the PDS energy range,
5 Integrated flux in 10-11 erg s-1 cm-2,
6 Integrated luminosity in 1043 erg s-1
References concerning the Hydrogen column density:
B: Bassani et al. (1999),
Br: Brandt et al. (1997),
Ca: Cappi et al. (1996),
Co: Comastri et al. (1998),
D: Deluit et al., Paper II of the D03 study,
G: Guainazzi et al. (1998),
H: Hayashi et al. (1996),
Le: Leighly et al. (2000),
S: Smith & Done (1996) ,
U: Ueno et al. (1998),
W96: Weaver et al. (1996),
W97: Weaver et al. (1997),
X: Xue et al. (1998)
References concerning the spectropolarimetric information:
Go: Goodrich et al. (1994),
H: Heisler et al. (1997),
K: Kay (1994),
L: Lumsden et al. (2001),
Ma: Moran et al. (2000),
Mb: Moran et al. (2001),
V: Veilleux et al. (1997),
VC: Veron-Cetty & Veron (2003),
Y: Young et al. (1996)
2.2 Sources not significantly influenced by absorption effects
As exhaustively explained in D03, we limit our study to Sy 2 galaxies having a hydrogen column density less than 71023cm-2. We have established that below this threshold, the absorption effects do not alter strongly the primary emission, allowing us a direct view of the emission produced by the central engine.
2.3 Sample spectral characteristics
The final sample is composed of 8 Seyfert 2 galaxies with PBL and 8 without PBL detected (Table 2).
2.3.1 Absorption distribution
We present in Figure 1 the hydrogen column density distribution of PBLs and NPBLs Sy 2 galaxies.
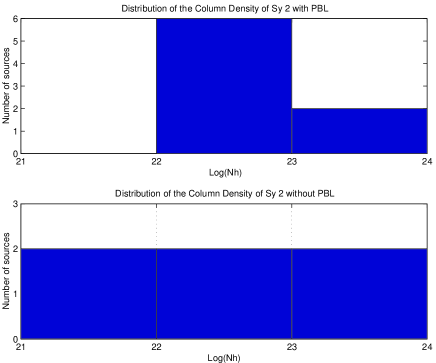
Several contradictory results have been found during recent years. Heisler et al. (1997) and Gu et al. (2001) found a
higher column density for NPBLs whereas Alexander (2001) found no link between the detectability of polarized
broad lines and the density of the absorbing material.
In our study, the column density distributions of the two Sy 2 classes are not significantly different. In particular
the NPBLs galaxies are not more absorbed than PBLs since they have the same number of objects with a low absorption
(NH1022cm-2) than with a higher absorption (NH1022cm-2).
The fact that we consider a small number of objects
and only Compton-thin Sy 2 galaxies prevents us from generalizing this result for the overall Sy 2 class. We
however show that even in Compton-thin Sy 2 galaxies the absence of polarized broad lines
is not unusual.
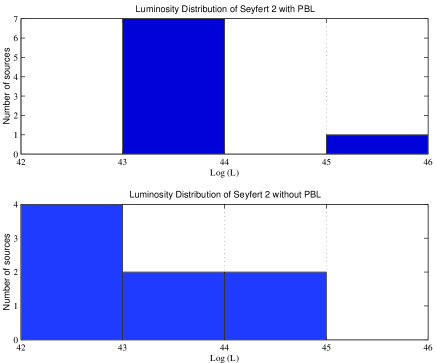
2.3.2 Luminosity distribution
The hard X-ray luminosity is a signature of the nucleus activity.
The comparison of luminosity distributions of the two Sy 2 subclasses (Figure 2) reveals that NPBLs are weaker than PBLs, indicating that the activity of their respective central engine is slightly different. Indeed, 87.5 % of PBLs have a luminosity between 1043 and 1044 erg s-1 against only 25% of NPBLs. 50% of the NPBLs population has a luminosity between 1042 and 1043 erg s-1.
The hypothesis according to which PBLs would be more luminous than NPBLs has been evoked in other wavelength domains (e.g. Kay (1994) and Tran (2003)); we discuss the implications of this result in the section 7.
3 Data Analysis
The Narrow Field Interments (NFI) of the BeppoSAX satellite is composed of a Low Energy Concentrator Spectrometer
(LECS; (Parmar et al., 1997)), three
Medium Energy Concentrator Spectrometers (MECS; Boella et al. (1997)) and a Phoswich Detector
Counter (PDS; Frontera et al. (1997)). LECS and MECS have imaging capabilities and operate
respectively in the 0.1-5 keV and 2.0-10 keV domains. The PDS, used in our study, is an instrument functioning in an
energy band between 15-200 keV with an energy resolution of 15% at 60 keV.
The detector is designed to allow a good control of background
variations using rocking collimators that periodically sample source+background combinations and
background alone.
The data analysis has been performed with the XSPEC (Arnaud, 1996) version 11 package using the latest PDS
response matrices
released by the BeppoSAX SDC111http://www.asdc.asi.it/bepposax/.
To compute the average spectra, we used the task Mathpha version 5.1.
combining the data files. The errors
have been propagated at each step of the procedure. In this procedure, we did
not consider
the background since the individual spectra were already background subtracted.
We computed the average count spectrum weighting
the individual spectra by their respective exposure time.
We kept the same binning for the average spectrum as for the original data of each source.
For a source observed several times, we first computed its average spectrum.
The PDS energy band used in our study extends from 15 to 136 keV.
4 Spectral properties of various Seyfert 2 galaxies classes
We present in Figure 3 the average spectrum of Seyfert 2 galaxies with and without polarized broad lines.
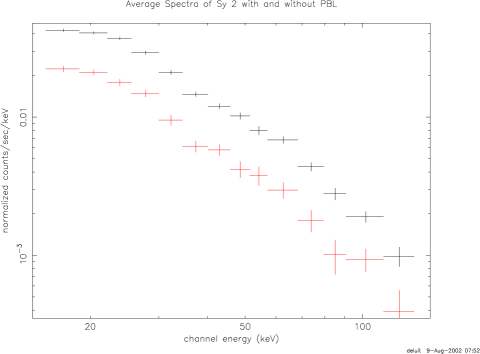
The integrated signal to noise ratio in the 15-136 keV energy range is
98 for the PBLs and 47 for the NPBLs average spectrum.
The NPBLs countrate is half as strong as the PBLs at 15 keV.
We
compare the central engine signatures of the two types of Sy 2 galaxies using
two methods: firstly, with a model-independent analysis comparing directly the normalized count
spectra independently of any instrumental consideration; secondly, with a
model-dependent method using a spectral
fitting procedure.
We also intend to compare the emission of the
two Sy 2 classes with the Sy 1 galaxies to investigate whether they have common properties as supposed by unified
models. The Seyfert 1 average spectrum used in this study
comes
from D03.
4.1 Model-Independent Analysis: comparison of the normalized count spectra
We compare the average count spectra normalizing them at 15 keV (Figure 4).
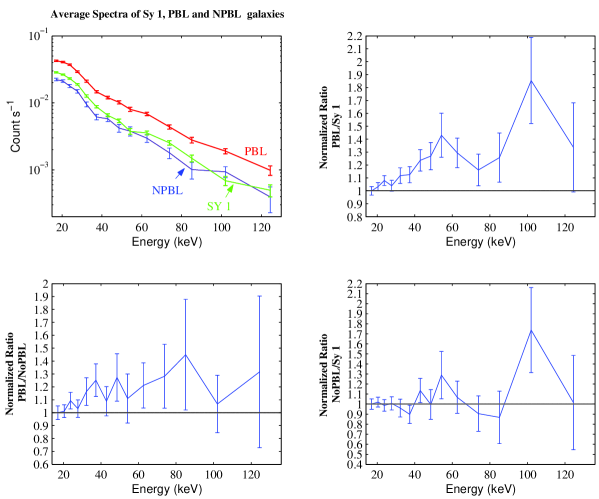
4.1.1 Comparison between Seyfert 2 galaxies with and without polarized broad lines
The average spectra of PBLs and NPBLs could be almost identical considering the error bars. Nevertheless, the PBLs emission seems to be slightly higher than that of NPBLs. To strengthen this result, we rebin the spectra to improve the bin significance (Figure 5).
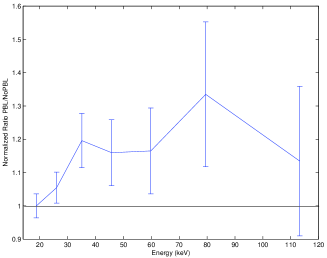
The PBLs emission is higher than NPBLs along the major part of the energy domain indicating that the PBLs spectrum contains a larger hard photons population than NPBLs. The PBLs average spectrum is 45% higher than that of NPBLs around 85 keV where they differ most in the ratio of Figure 4.
4.1.2 Comparison of PBLs and NPBLs Sy 2 galaxies with Sy 1 galaxies
-
1.
Comparison of Sy 2 with PBL and Sy 1
The PBLs emission is always higher than that of Sy 1 galaxies giving an indication of the hardness of this category of Sy 2 galaxies. We note two excesses of the PBLs emission compared with Sy 1 around 55 keV and 100 keV. The deficit of hard photons in the Sy 1 class can be explained either by the presence of a cutoff in its emission or by a lower PBLs intrinsic spectral index and/or by a reflection component in PBLs. The PBLs emission is 85% greater than Sy 1 at 100 keV. -
2.
Comparison of Sy 2 without PBL and Sy 1
The two spectra are similar below 40 keV confirming that the emission of NPBLs is not significantly modified by absorption effects at these energies. The average spectra remain close up to 85 keV. The NPBLs emission is higher than that of Sy 1 at the two same energies (55 and 100 keV) where the PBLs emission dominates in the ratio PBLs/Sy 1. This suggests the presence of a particular spectral component in the Sy 1 average spectrum.
The maximal difference measured between the two classes is found at 100 keV where the NPBLs emission is 74% greater than that of Sy 1.
4.1.3 Preliminary results
At first sight (Fig. 3), the spectra of Seyfert 2 galaxies with and without polarized broad lines appear very
similar. However, the model-independent analysis we
performed reveals small but significant differences (Fig. 5).
The comparison with Sy 1 galaxies indicates that singularities exist also between Sy 1 galaxies and the
two subclasses of Sy 2 galaxies.
The physical processes that can be responsible for the observed spectra and for the differences found between
the various
classes of Seyfert galaxies are investigated in the next subsection.
4.2 Model-Dependent Analysis: investigating the emission processes
To further test the above results, we compare the spectra using a fitting procedure that will allow us to investigate also the components occurring in the emission. We fit the spectra initially with simple models then with the reflection model PEXRAV. The results are shown in Tables 3 and 4.
| Model | Sy 2 | Ecutoff | /d.o.f. | FTEST | ||
|---|---|---|---|---|---|---|
| Class | Spectral index | (keV) | reduced | Probability value | ||
| Power Law | PBL | 1.85 | - | 43.0/12 | 3.58 | - |
| NPBL | 1.99 | - | 10.3/12 | 0.86 | - | |
| Cutoff Power Law | PBL | 1.38 | 83.6 | 09.9/11 | 0.90 | 7.9 |
| NPBL | 1.68 | 118 | 07.1/11 | 0.65 | 4.8 |
Notes:
The uncertainties correspond to 90
confidence level based on a =2.7 criterion (Lampton et al., 1976)
NC indicates that no constraint has been found on this limit.
| Sy 2 | Efolded | R | /d.o.f. | cos | ||
|---|---|---|---|---|---|---|
| Class | Spectral index | (keV) | Reflection | reduced | fixed | |
| PBL | 1.65 | 181 | 0.51 | 8.6/10 | 0.86 | 0.45 |
| NPBL | 2.06 | 1.7 | 0.90 | 6.5/10 | 0.65 | 0.45 |
| Sy 2 | Efolded | R | /d.o.f. | cos | ||
| Class | Spectral index | (keV) | Reflection | reduced | free | |
| PBL | 1.62 | 167 | 0.27 | 8.6/9 | 0.96 | 0.81 |
| NPBL | 2.08 | 9.7 | 3.07 | 6.5/9 | 0.72 | 0.14 |
Notes:
The uncertainties correspond to 90
confidence level based on a =2.7 criterion (Lampton et al., 1976).
NC indicates that no constraint has been found on this limit.
the value shows the absence of a measured cutoff in the PDS energy range.
4.2.1 Fitting of the spectra with simple theoretical models
We fit the spectra successively with a simple power law and a cutoff power law (PL and
CPL hereafter).
To know the best model fitting the spectra, we refer to the reduced 2 value expected to be the
nearest possible to 1.
A simple power law cannot reproduce the PBLs spectrum (=3.58) thus at least one additional
component is required. The
occurrence of a cutoff in the PBLs observed spectrum is the best scheme.
Indeed, the reduced 2 value (=0.90) for a CPL and in particular
the
very low FTEST probability value (P=7.910-5) indicate the high probability
of having a cutoff in the PBLs spectrum.
The NPBLs average spectrum is well represented by a simple power law
and a FTEST gives no justification for including a cutoff in the model.
Considering the best fit obtained for the two Sy 2 classes, NPBLs have a spectral index greater than PBLs, showing the softness of their
emission (=1.99 against
=1.38 with a cutoff energy
of Ec=83.6 keV).
PBLs have the same
general
behavior as Sy 1 galaxies, which also require a cutoff in their average spectrum.
In particular the Sy 1 energy cutoff (Ec=70 keV, see D03 for spectral parameters) is very similar
to that of PBLs
(Ec=83.6 keV).
The spectral index is possibly slightly steeper for Sy 1 (=1.49) than for PBLs (=1.38) but
considering
the errors they could be identical.
Therefore, Sy 1 and Sy 2 galaxies with polarized broad lines have spectral similarities whereas NPBLs galaxies present
distinct properties with the absence of a constrained cutoff and a probable greater spectral index.
4.2.2 Fitting of the spectra with the reflection model PEXRAV
To investigate if Compton reflection plays a role in the PBLs and NPBLs emission we use the PEXRAV model
(Magdziarz & Zdziarski, 1995).
This model
calculates the expected X-ray spectrum when a point source of X-rays is incident on optically thick,
mainly neutral material.
The parameter R is related to the reflection
component and the model is inclination/reflection dependent.
The results are presented in Table 4.
We first fix the inclination from the normal of the disk at
cos=0.45 to compare the various spectral parameters of the two Sy 2
subclasses independently of any strong influence of the inclination. The PBLs average spectrum requires a cutoff whereas no indication of such a presence is observed in NPBLs as evoked in 4.2.1.
The spectral indices of Sy 2 with and without PBL are within the same value domain.
The presence of a
reflection process
in the NPBLs/PBLs emissions is not proven since the PEXRAV model does not improve significantly the fitting results.
In particular, the reflection process could be totally absent in the PBLs spectrum (R=0.51).
We now leave the inclination free to limit the dependence between the different spectral parameters. We find that PBLs would be
close to the normal of the disk with an angle of cos=0.81 or 36∘ whereas NPBLs would be seen with
an
angle of cos=0.14 or 82∘.
The PBLs angle corresponds exactly to that found for Sy 1 galaxies in D03 where we
obtained cos=0.81. That does not prove that PBLs and Sy 1 have genuinely the same inclination but that their spectra give the
same parameters when
applying the PEXRAV model.
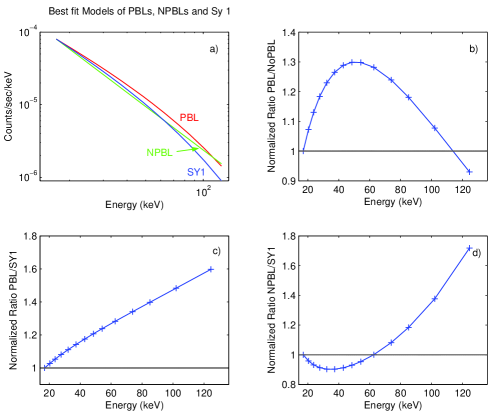
5 Comparison of the two different analyses
The models and parameters that best fit PBLs show that their properties are similar to those of
Seyfert 1 galaxies (see 4.2.). However, the ratio of
their average count spectra, shown in 4.1.2, indicates a significant difference at high energies. To understand
this apparent
contradiction between the two methods, we select the best fit model for each
class and we calculate
the ratio of these models (Figure 6).
We see in figure 6b that the PBLs model is higher than that of NPBLs over most of the energy
domain by the same amount (30) as seen in 4.1.1 in the count spectra ratio.
The PBLs model is always higher than that of
Sy 1 galaxies (Fig. 6c), that is explained by the Sy 1 cutoff occurring at a slightly lower energy than PBLs.
The divergence between NPBLs and Sy 1 galaxies does not exceed 20 below 85 keV whereas at high
energies NPBLs are more powerful emitters (Fig. 6d). Indeed, the presence of a cutoff in the Sy 1 spectrum at
70 keV entails a rapid decrease of the Sy 1 emission
whereas the NPBLs drop in emission is only due to the spectral index of the
continuum.
The model ratios have thus the same general behavior and amplitude as those of the count spectra, confirming
the results of the fits to the models.
6 Results
The spectra of our Seyfert 2 galaxies with and without PBL have a common general
behavior at first sight. Investigating deeper, the PBLs spectrum presents a well-constrained cutoff whereas the NPBLs emission does not require this property.
Our results also indicate that Seyfert 2 galaxies with polarized broad lines have several common properties with Sy 1 galaxies (cutoff and
hardness of the same order).
Therefore, the nature of Seyfert 2 galaxies without polarized broad lines remains unclear. We found significant divergences between NPBLs and the pair Sy1/PBLs. Indeed, NPBLs have no constrained cutoff, have a greater spectral index and are less luminous than PBLs, revealing intrinsic differences.
7 Discussion
Far from having definitively proven that NPBLs have a different central engine hence that they do not have a hidden Sy 1 nucleus, we show that their primary emission presents substantial differences compared to PBLs and Sy 1 galaxies.
7.1 The high-energy cutoff
Sy 1 and PBLs galaxies possess a cutoff of the same order,
indicating that the temperature of the electron gas is similar for both classes
(T=Ec/k=8.27108 K
and T=9.88108 K).
The presence of similar cutoffs in the PBLs and Sy 1 emission reveals that the same global physical conditions
occur in the inner regions of their source. This supports unified models.
The absence of a constrained cutoff in NPBLs emphasizes differences in the
primary emission of various classes of Sy 2 galaxies. However, a cutoff could arise at higher energies thus produced by very high electron gas temperatures. We therefore
have to extend the energy domain of our investigation.
This lack could also be explained by a wide distribution of NPBLs cutoff energies.
The genuine absence of a cutoff would suppose that different emission processes arise within the NPBLs class.
Nevertheless, the cutoff argument cannot explain the absence of polarized broad lines in the NPBLs sources.
Another way to explain the existence of two Sy 2 types is by the study of the central
engine activity, explored in the next subsection.
7.2 The central engine activity
We
show in this study
that the NPBLs countrate at 15 keV is two
times weaker than PBLs (section 4), the NPBLs spectrum is softer
than Sy 1 and PBLs (see 4.3.1 and 4.3.2) and in particular the NPBLs of our sample are less luminous (see 2.3.2).
Therefore, the central engine of NPBLs appears weaker than PBLs.
We speculate that Sy 2 galaxies without polarized broad lines correspond to a state in which the accretion flow is weak and devoid
of line emitting clouds. This flow may be insufficient to produce a large UV flux which in turn would
explain why Sy 2 without PBL cannot cool through
Compton processes between the electron population and the UV photons, thus explaining
the absence of cutoff in the high energy emission.
7.3 The absorption/environment role in Seyfert 2 classification
The absence of polarized broad lines and of a cutoff in NPBLs galaxies cannot both be explained by
very high
column densities. Indeed, we consider only Compton-thin Sy 2 galaxies thus sources slightly influenced
by absorption.
The argument according to which the column density of our NPBLs would be
underestimated is improbable here, since
this would imply a
large divergence between the average emission of Sy 1 and Sy 2 without PBL in the 15-40 keV domain, that is not observed.
The absence of polarized broad lines in NPBLs may be due to either the lack of a scattering medium above the absorbing gas
or to the genuine absence of line emitting clouds in the nuclear regions.
However, the absence of a scattering medium alone cannot
explain all the differences seen in the continuum emission of the two Sy 2 types.
7.4 Implications
We summarize in Table 5 the characteristics of Seyfert 2 galaxies with and without polarized broad lines.
| Sy 2 Class | Characteristics |
|---|---|
| PBLs | Cutoff at 80 keV |
| lower spectral index than NPBLs | |
| Spectral similarities with Sy 1 galaxies | |
| NPBLs | no constrained cutoff |
| softness of the emission | |
| central engine activity weaker than PBLs | |
| not more absorbed than PBLs |
The PBLs and Sy 1 galaxies of our sample have similar physical conditions in the inner regions of their sources.
Consequently, the observed differences in the line properties and in X-ray
emission can be due to a greater
absorption in PBLs compared to Sy
1 galaxies, which agrees with unified models.
The NPBLs, however, are not only hidden Sy 1 nucleus since the absorption argument is unable to
reproduce the different spectral properties found in this study.
To confirm this assertion and to allow a meaningful analysis of the
central engine signatures of the different types of Sy galaxies, we need a larger sample of Sy 2
having both spectropolarimetric
observations and high quality X-ray data.
We conclude that while Seyfert 2 galaxies with polarized broad lines have continuum emission properties that
match those of Seyfert 1 galaxies,
Seyfert 2 galaxies without PBL do seem to present genuine differences in their nuclear properties.
Acknowledgements.
The author wishes to sincerely thank the anonymous referee for the fruitful report he provided, M. Gaber for his advice and P. Veron for the useful comments on the ”zoology” of Seyfert galaxies.References
- Alexander (2001) Alexander, D. M. 2001, MNRAS, 320, L15
- Antonucci (1993) Antonucci, R. 1993, ARA&A, 31, 473
- Antonucci & Miller (1985) Antonucci, R. R. J. & Miller, J. S. 1985, ApJ, 297, 621
- Arnaud (1996) Arnaud, K. A. 1996, in ASP Conf. Ser. 101: Astronomical Data Analysis Software and Systems V, Vol. 5, 17+
- Awaki et al. (2000) Awaki, H., Ueno, S., Taniguchi, Y., & Weaver, K. A. 2000, ApJ, 542, 175
- Bassani et al. (1999) Bassani, L., Dadina, M., Maiolino, R., Salvati, M., Risaliti, G., della Ceca, R., Matt, G., & Zamorani, G. 1999, ApJS, 121, 473
- Boella et al. (1997) Boella, G., Chiappetti, L., Conti, G., Cusumano, G., del Sordo, S., La Rosa, G., Maccarone, M. C., Mineo, T., Molendi, S., Re, S., Sacco, B., & Tripiciano, M. 1997, A&AS, 122, 327
- Brandt et al. (1997) Brandt, W. N., Fabian, A. C., Takahashi, K., Fujimoto, R., Yamashita, A., Inoue, H., & Ogasaka, Y. 1997, MNRAS, 290, 617
- Cappi et al. (1996) Cappi, M., Mihara, T., Matsuoka, M., Brinkmann, W., Prieto, M. A., & Palumbo, G. G. C. 1996, ApJ, 456, 141+
- Comastri et al. (1998) Comastri, A., Vignali, C., Cappi, M., Matt, G., Audano, R., Awaki, H., & Ueno, S. 1998, MNRAS, 295, 443+
- Deluit & Courvoisier (2003) Deluit, S. & Courvoisier, T. J.-L. 2003, A&A, 399, 77
- Frontera et al. (1997) Frontera, F., Costa, E., dal Fiume, D., Feroci, M., Nicastro, L., Orlandini, M., Palazzi, E., & Zavattini, G. 1997, A&AS, 122, 357
- Goodrich et al. (1994) Goodrich, R. W., Veilleux, S., & Hill, G. J. 1994, ApJ, 422, 521
- Gu et al. (2001) Gu, Q., Maiolino, R., & Dultzin-Hacyan, D. 2001, A&A, 366, 765
- Guainazzi et al. (2001) Guainazzi, M., Fiore, F., Matt, G., & Perola, G. C. 2001, MNRAS, 327, 323
- Guainazzi et al. (1998) Guainazzi, M., Matt, G., Antonelli, L. A., Fiore, F., Piro, L., & Ueno, S. 1998, MNRAS, 298, 824
- Hayashi et al. (1996) Hayashi, I., Koyama, K., Awaki, H., & Yamauchi, S. U. S. 1996, PASJ, 48, 219
- Heisler et al. (1997) Heisler, C. A., Lumsden, S. L., & Bailey, J. A. 1997, Nature, 385, 700
- Iwasawa et al. (1995) Iwasawa, K., Kunieda, H., Tawara, Y., Awaki, H., Koyama, K., Murayama, T., & Taniguchi, Y. 1995, AJ, 110, 551
- Kay (1994) Kay, L. E. 1994, ApJ, 430, 196
- Lampton et al. (1976) Lampton, M., Margon, B., & Bowyer, S. 1976, ApJ, 208, 177
- Leighly et al. (2000) Leighly, K. M., Cappi, M., Kay, L., Halpern, J. P., Awaki, H., Ueno, S., & Magalhaes, A. M. 2000, in Rossi2000: Astrophysics with the Rossi X-ray Timing Explorer. March 22-24, 2000 at NASA’s Goddard Space Flight Center, Greenbelt, MD USA, p.E125, E125–+
- Lumsden et al. (2001) Lumsden, S. L., Heisler, C. A., Bailey, J. A., Hough, J. H., & Young, S. 2001, MNRAS, 327, 459
- Magdziarz & Zdziarski (1995) Magdziarz, P. & Zdziarski, A. A. 1995, MNRAS, 273, 837
- Miller & Goodrich (1990) Miller, J. S. & Goodrich, R. W. 1990, ApJ, 355, 456
- Moran et al. (2000) Moran, E. C., Barth, A. J., Kay, L. E., & Filippenko, A. V. 2000, ApJ, 540, L73
- Moran et al. (2001) Moran, E. C., Kay, L. E., Davis, M., Filippenko, A. V., & Barth, A. J. 2001, ApJ, 556, L75
- Parmar et al. (1997) Parmar, A. N., Martin, D. D. E., Bavdaz, M., Favata, F., Kuulkers, E., Vacanti, G., Lammers, U., Peacock, A., & Taylor, B. G. 1997, A&AS, 122, 309
- Risaliti et al. (1999) Risaliti, G., Maiolino, R., & Salvati, M. 1999, ApJ, 522, 157
- Smith & Done (1996) Smith, D. A. & Done, C. 1996, MNRAS, 280, 355
- Tran (1995) Tran, H. 1995, ApJ, 440, 565+
- Tran (2003) Tran, H. D. 2003, ApJ, 583, 632
- Ueno et al. (1998) Ueno, S., Ward, M. J., O’Brien, P. T., Stirpe, G. M., & Matt, G. 1998, in The Active X-ray Sky: Results from BeppoSAX and RXTE, 554+
- Veilleux et al. (1997) Veilleux, S., Sanders, D. B., & Kim, D.-C. 1997, ApJ, 484, 92+
- Veron-Cetty & Veron (2003) Veron-Cetty, M. P. & Veron, P. 2003, VizieR Online Data Catalog, 7235, 0
- Weaver et al. (1996) Weaver, K. A., Nousek, J., Yaqoob, T., Mushotzky, R. F., Makino, F., & Otani, C. 1996, ApJ, 458, 160+
- Weaver et al. (1997) Weaver, K. A., Yaqoob, T., Mushotzky, R. F., Nousek, J., Hayashi, I., & Koyama, K. 1997, ApJ, 474, 675+
- Xue et al. (1998) Xue, S., Otani, C., Mihara, T., Cappi, M., & Matsuoka, M. 1998, PASJ, 50, 519
- Young et al. (1996) Young, S., Hough, J. H., Efstathiou, A., Wills, B. J., Bailey, J. A., Ward, M. J., & Axon, D. J. 1996, MNRAS, 281, 1206
- Zdziarski et al. (1995) Zdziarski, A. A., Johnson, W. N., Done, C., Smith, D., & McNaron-Brown, K. 1995, ApJ, 438, L63
Appendix A Average spectra fitted with the different models
We present the average count spectrum of each class fitted by the models applied in this study.


