The Astrophysical Journal,
vol. 590, pp. 368–378
Modelling the Infrared Emission from the HR 4796A Disk
Abstract
We model the spectral energy distribution (SED) from the mid-infrared to submillimeter of the ring-like disk of , the dustiest A-type star. We consider dust made either of coagulated but otherwise unaltered protostellar interstellar grains, or grains that are highly-processed in a protostellar/protoplanetary nebula with silicate dust annealed and carbon dust oxidized. Both types of dust are successful in reproducing the observed SED, provided that the grains are highly fluffy, with a vacuum volume fraction of . We find no evidence for the existence of a hot “zodiacal dust” component a few AU from the star, which was suggested by previous workers to account for the 10-wavelength emission.
1 Introduction
is a nearby (distance to the Earth ) young main-sequence (MS) star (age ) of spectral type A0 V (effective temperature ). The dust disk has recently aroused considerable interest because (1) it has the largest fractional infrared (IR) luminosity relative to the total stellar luminosity (; ) among the A-type MS stars in the Bright Star Catalogue (Jura 1991); (2) unlike the majority of circumstellar disks, the disk displays a ring-like structure peaking at from the central star and abruptly truncated both interior and outside with a width of (Schneider et al. 1999); (3) its young-age nature places it at a somewhat transitional stage between massive gaseous protostellar disks around young pre-MS T-Tauri and Herbig Ae/Be stars () and much evolved and tenuous debris disks around MS “vega-type” stars ().
The physical and chemical properties of the dust in the disk, which play a significant role in understanding the creation, dynamical evolution and structural properties of the disk, are poorly constrained: (1) Based on the lifetime of dust against loss by Poynting-Robertson drag, Jura et al. (1993) suggested that the dust is larger than in radius and the dust is a remnant of the protostellar nebula; (2) From an analysis of radiation pressure vs. gravitational attraction, Jura et al. (1995) found that the minimum radius of grains orbiting is about and argued that these grains have undergone measurable coalescence; (3) In order to explain the inner hole (Jura et al. 1995) and the black-body approximation for the 10–100 dust emission, Jura et al. (1998) proposed that the grains are largely composed of ice particles with a typical radius of which originate from a protocometary cloud; (4) In order to explain the entire 12.5 emission and the 20.8 residual emission unaccounted for by their simple model, Koerner et al. (1998) proposed the existence of a tenuous dust component at a distance of 3–6 from the star which is heated to about 200–300, similar to the zodiacal dust in our own solar system; (5) From the red reflectance of the disk, Schneider et al. (1999) argued that the mean dust size must be larger than several microns and the dust is circumstellar debris rather than interstellar in origin; (6) Based on a detailed modelling of the spectral energy distribution (SED) of the disk, Augereau et al. (1999) proposed a two-component model consisting of a cold annulus peaking at from the star (made of interstellar dust-type grains ranging from to a few meters) and a hot population at 9–10 from the star (made of comet-like grains of radii ); (7) Using the flux ratio at 10.8 and 18.2 and assuming “astronomical silicates”, Telesco et al. (2000) inferred a “characteristic” diameter of and argued that these grains are unlikely to be primordial; instead, they are probably products of recent collisions of large bodies.
It is the purpose of this work to constrain the dust properties (size, composition, and morphology) of the disk. In general, in a dusty system, dust spatial distribution and dust sizes cannot be uniquely determined by the SED alone. Given that the distribution of the dust in the disk is well constrained by the near-IR imaging of scattered starlight (Schneider et al. 1999) and, to a less degree, by the mid-IR imaging of dust thermal emission (Jayawardhana et al. 1998; Koerner et al. 1998; Telesco et al. 2000), an attempt is therefore made in this work to infer the dust properties by modelling the full spectral energy distribution from the mid-IR to the submillimeter wavelengths.
Lacking a priori knowledge of the composition of the dust in the disk, we consider two extreme dust types: (1) “cold-coagulation” dust – dust in protoplanetary disks is formed through cold aggregation of unaltered interstellar materials – this is the case in the outer parts of the disk where interstellar dust originating from the parent molecular cloud (out of which the disk forms) is not likely to have significantly changed its composition during passage through the weak shock front when the disk is first created, except volatile ice mantles around the refractory cores may partly sublimate, but the recondensation of volatiles occurs efficiently behind the shock (see Beckwith, Henning, & Nakagawa 2000 for a review); (2) “hot-nebula” dust – dust has undergone significant destruction and modification in protoplanetary accretion disks through annealing of amorphous silicates and oxidation of carbonaceous dust in the warm inner regions of the accretion disk (Gail 2001); turbulent radial mixing (Gail 2001) and/or outflows driven by “X-winds” (Shu, Shang, & Lee 1996) then carries these heavily processed dust into cold regions of the disk where it is mixed with freshly accreted material from the parent molecular cloud; as an extreme, we consider a dust model in which the carbonaceous dust component has been fully destroyed by oxidation so that only crystalline silicate dust remains. In reality, the dust in protoplanetary disks would undoubtedly be intermediate between heavily processed dust and aggregates of unaltered interstellar dust. Since planetesimals and cometesimals are formed by coagulation of such dust aggregates, the dust generated by collisions of planetesimals and cometesimals should resemble the original dust from which they are built up.
We first discuss in §2.1 the general constraints on the dust and disk properties. We then model the observed SED in §2.2 and §2.3 in terms of the “cold-aggregation” model of unaltered interstellar dust and the “hot-nebula” model with all amorphous silicate dust annealed and all carbonaceous dust oxidized, respectively. We find that, for both models, (1) highly porous grains with a porosity provide excellent fits to the entire SED; (2) there appears to be no need for a hot “zodiacal cloud” dust component (§3.3) which was previously suggested by Koerner et al. (1998) and Augereau et al. (1999). Therefore, the presence of either type of particles in the disk is possible. We show in §3.2 that, although good fits to the SED can be achieved by models with a single power-law dust spatial distribution, they are apparently in conflict with the imaging observations of scattered starlight and dust thermal emission. In §3.5 we calculate the dust IR intensities integrated over the SIRTF/IRAC and MIPS bands predicted for our best-fitting models. The major conclusions are summarized in §4.
2 Modelling the Dust IR Emission
A grain in the optically thin dust disk of absorbs stellar ultraviolet/optical photons and then re-radiates the energy in the IR. To calculate the disk’s emission spectrum, knowledge of its morphology, composition, and size is required.
2.1 General Considerations on Dust and Disk Properties
A fluffy structure is expected for dust in protoplanetary disks as a result of its coagulational growth process. We characterize its fluffiness by porosity , the fractional volume of vacuum. We assume all grains are spherical in shape.
In §A we estimate that the “cold-coagulation” model leads to porous dust consisting of amorphous silicate and carbonaceous materials (and H2O-dominated ices in regions colder than ) with a mixing ratio of [and for cold regions]. For the “hot-nebula” dust model, we assume that the dust is exclusively composed of crystalline silicate dust (and ices in cold regions).
We assume a power law dust size distribution which is characterized by a lower-cutoff , upper-cutoff and power-law index (where is the spherical radius). We take , the smallest value among previous estimations of (see §1);111A fluffy grain of with a porosity of consists of constituent individual (interstellar) particles which have a typical size of (see Li & Greenberg 1997). Models with a smaller () and a larger () will be discussed in §3.2 and (this is not a critical parameter since grains larger than are like blackbodies and their IR emission spectra are size-insensitive).
The dust spatial distribution is well constrained by the near-IR imaging of scattered starlight (Schneider et al. 1999) to be a sharply-truncated ring-like structure peaking at a radial distance of from the star with a characteristic width of . Therefore, we adopt a Gaussian function for the dust spatial density distribution:222Following Kenyon et al. (1999), we assume an exponential, radial-independent, vertical distribution where the vertical scale height is . Alternatively, can be determined from the vertical hydrostatic equilibrium assumption (; see Appendix B in Li & Lunine 2003). But the knowledge of the dust vertical distribution is not required and it does not affect our results since in modelling the SED of the disk, what actually involves is the dust surface density distribution . which is characterized by the radial position where peaks and the full width half maximum (FWHM) . The dust surface density distribution obtained by integrating over the perpendicular (to the disk plane) path lengths can be expressed as where is the mid-plane () surface density at . This distribution function, with and , was successful in modelling the scattered-light images (Kenyon et al. 1999). A Gaussian-type dust distribution was also adopted by Klahr & Lin (2000) to model the dynamics of the dust ring around . We fix to be at and take , the mean value of the determinations of Schneider et al. (1999; ) and Kenyon et al. (1999; ). The inner boundary is set to be where grains are heated to , and hence, is a function of dust size. For micron-sized grains, the inner boundary is roughly . The outer boundary is taken to be which is expected from the disk truncation caused by the tidal effects of , a companion star of (Jayawardhana et al. 1998).
Therefore, we are only left with two free parameters: (1) the dust porosity , and (2) the dust size distribution power index .
Dielectric functions are taken from (1) Draine & Lee (1984) for amorphous silicate dust; (2) Li & Draine (2001a) for crystalline silicate dust; (3) Li & Greenberg (1997) for carbonaceous dust; (4) Li & Greenberg (1998) for H2O-dominated ice. The Bruggman effective medium theory (Bohren & Huffman 1983) is used to calculate the mean dielectric functions for the fluffy heterogeneous dust aggregates. Absorption cross sections are obtained using Mie theory. Approximating the radiation field by the Kurucz model atmosphere spectrum for A0 V stars (Kurucz 1979), dust equilibrium temperatures are then derived by balancing absorption and emission. For a given dust size distribution and a given disk structure (dust spatial density distribution), the emergent IR emission spectrum can be obtained by integrating over the dust size range, and over the entire disk. The calculated IR spectrum is then compared with the available photometric data for the disk compiled by Augereau et al. (1999).
2.2 “Cold-Coagulation” Dust Model
We first model the SED in terms of the dust generated from collisions of planetesimals and cometesimals formed in the disk (see §3.4) through cold-coagulation of unaltered interstellar grains from its parent molecular cloud. Using the dust composition discussed in §A, we calculate the model IR spectra for a wide range of dust porosities and a wide range of dust size distribution power-indices to search for good fits. We note that refers to the porosity of refractory dust – will be reduced to for dust with ices (see §B).
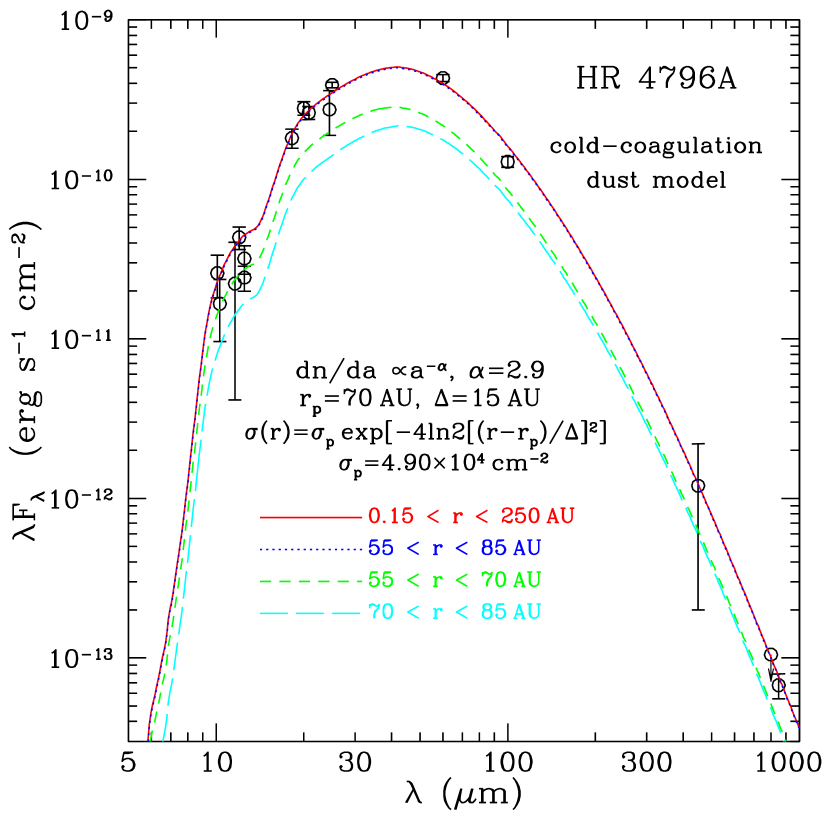
We illustrate in Figure 1 the best fits obtained for dust with a porosity of . Model parameters and results are tabulated in Table 1. It is seen that the best fit is provided by dust with (with a total mass of ; model no. 2) – dust more porous than this is somewhat too hot so that its emission is deficient in the submillimeter wavelength range (see Figure 1a); on the other hand, dust more compact than this is a bit too cold so that it produces too much emission in this wavelength range (see Figure 1b).
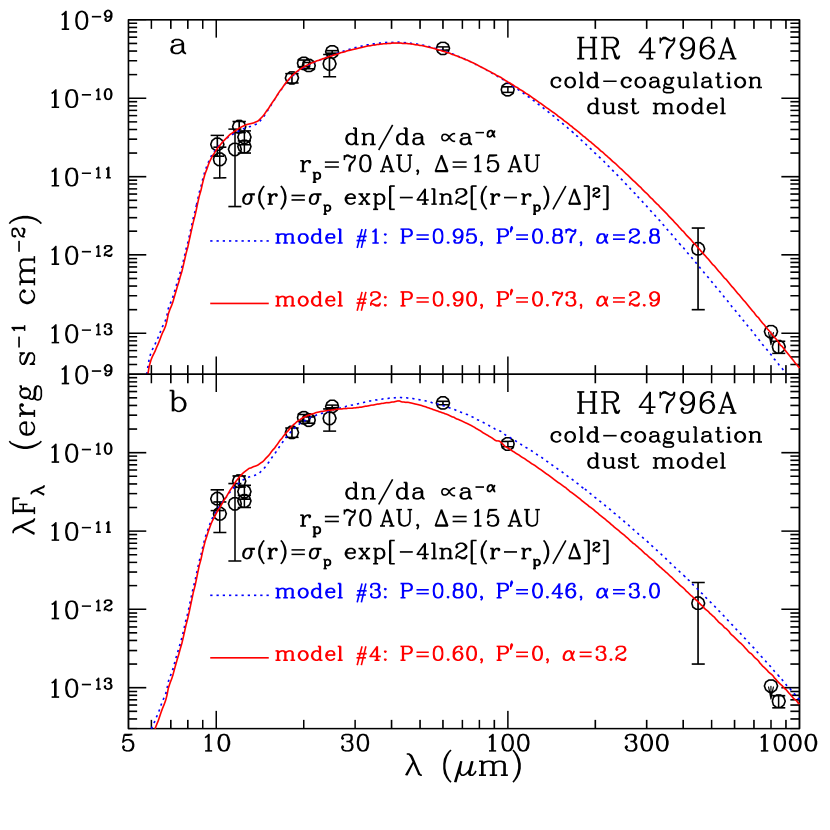
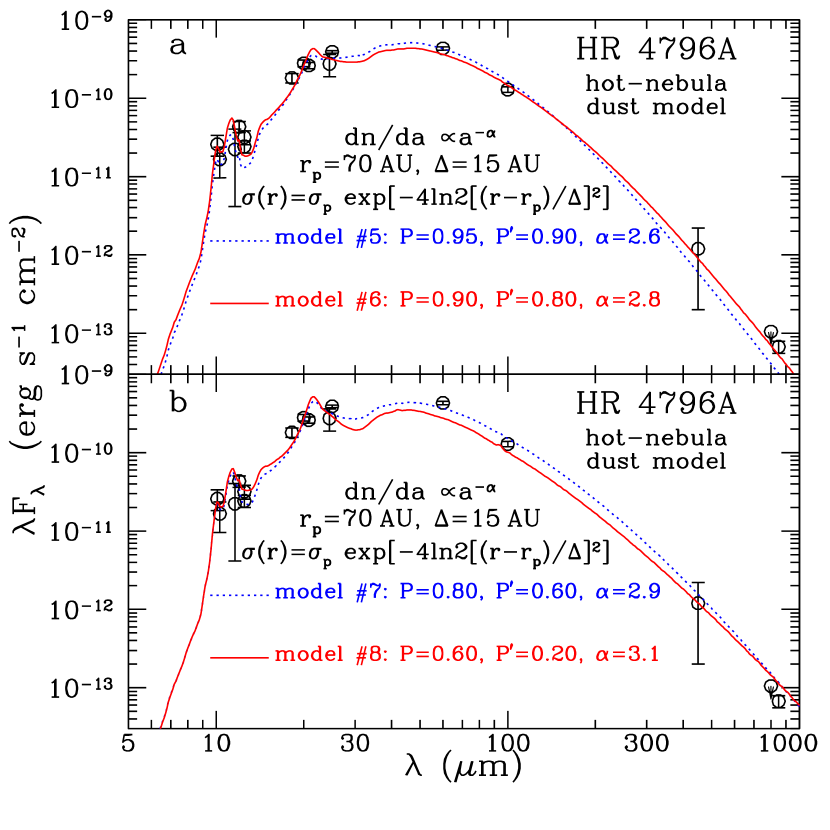
2.3 “Hot-Nebula” Dust Model
Now we consider another extreme case: dust in the inner disk regions has been so heavily processed that all amorphous silicate dust has been annealed () and all carbonaceous dust has been oxidized () by reacting with OH. The annealed silicate dust is then transported to (or the silicate vapour recondenses in crystalline form in) the cold outer regions of the disk where these grains grow into fluffy aggregates and are ultimately built into planetesimals/cometesimals. Apparently, only a fraction of the dust in the disk is accreted to the inner warm regions and, hence, only a fraction of the silicate dust is crystalline. But since we are considering an “extreme” case, in this section we model the “hot-nebula” dust as porous aggregates of pure crystalline silicate dust (plus ices in cold regions where dust reaches a temperature of ). We do not know how much ice would recondense on the silicate core seeds in the fluffy aggregate, but the assumption of full condensation of all condensible volatile elements (C, O, N) as ices (see §A) seems to be at the highest end. As a complement to §2.2 where full condensation is assumed, we take , a plausible value for dense molecular clouds.
Again, model IR spectra are calculated for a wide range of dust porosities and a wide range of dust power-indices . Except the sharp features at 11.3 and 23, the “hot-nebula” model spectra are very similar to those of the “cold-coagulation” model. For illustration, we show in Figure 2 the best-fit model spectra provided by dust with . Model parameters and results are also tabulated in Table 1. Similar to the cold-coagulation model, the best fit is given by dust with (with a total mass of ; model no. 6).
| model | dust | spatial | cc. The dust surface mass density can be written as with the mean dust mass where , for the “cold-coagulation” model; and , for the “hot-nebula” model (see §B). | cc. The dust surface mass density can be written as with the mean dust mass where , for the “cold-coagulation” model; and , for the “hot-nebula” model (see §B). | cc. The dust surface mass density can be written as with the mean dust mass where , for the “cold-coagulation” model; and , for the “hot-nebula” model (see §B). | ddVertical optical depth at and . The reason why is much smaller for models no. 9–11 is that the bulk of the dust is piled at the edge of the disk which is unphysical (see text [§3.2]). | note | ||||||||
|---|---|---|---|---|---|---|---|---|---|---|---|---|---|---|---|
| no. | type | distrib.bbDust spatial distribution – “Gaussian”: ; “power-law”: ; “Telesco”: for ; for ; for . | (AU) | (m) | () | () | () | () | |||||||
| 1 | cold-coag. | Gaussian | 0.95 | 0.87 | 15 | … | 2.8 | 2.25 | 47.8 | 9.46 | 2.67 | 2.97 | 0.041 | 2.85 | |
| 2 | cold-coag. | Gaussian | 0.90 | 0.73 | 15 | … | 2.9 | 2.11 | 28.7 | 4.34 | 4.03 | 4.90 | 0.042 | 1.81 | preferred |
| 3 | cold-coag. | Gaussian | 0.80 | 0.46 | 15 | … | 3.0 | 2.00 | 18.4 | 2.00 | 5.73 | 7.55 | 0.043 | 6.08 | |
| 4 | cold-coag. | Gaussian | 0.60 | 0 | 15 | … | 3.2 | 1.83 | 9.26 | 0.44 | 4.34 | 13.1 | 0.038 | 7.60 | |
| 5 | hot-nebu. | Gaussian | 0.95 | 0.90 | 15 | … | 2.6 | 2.66 | 155 | 45.5 | 6.02 | 0.85 | 0.040 | 5.29 | |
| 6 | hot-nebu. | Gaussian | 0.90 | 0.80 | 15 | … | 2.8 | 2.25 | 47.8 | 9.46 | 7.48 | 2.55 | 0.036 | 4.48 | preferred |
| 7 | hot-nebu. | Gaussian | 0.80 | 0.60 | 15 | … | 2.9 | 2.11 | 28.7 | 4.34 | 11.6 | 4.30 | 0.037 | 5.24 | |
| 8 | hot-nebu. | Gaussian | 0.60 | 0.20 | 15 | … | 3.1 | 1.91 | 12.6 | 0.93 | 9.25 | 8.04 | 0.031 | 9.94 | |
| 9 | cold-coag. | power-law | 0.90 | 0.73 | … | -2.3 | 3.2 | 1.83 | 9.26 | 0.44 | 8.43 | 0.42 | 0.0011 | 2.32 | |
| 10 | cold-coag. | power-law | 0.90 | 0.73 | … | -2.5 | 3.0 | 2.00 | 18.4 | 2.00 | 5.81 | 0.98 | 0.0054 | 3.28 | |
| 11 | hot-nebu. | power-law | 0.90 | 0.80 | … | -1.1 | 2.9 | 2.11 | 28.7 | 4.34 | 25.5 | 0.26 | 0.0022 | 9.71 | |
| 12 | hot-nebu. | power-law | 0.90 | 0.80 | … | 5.2 | 2.6 | 2.66 | 155 | 45.5 | 6.29 | 0.056 | 0.0026 | 2.02 | |
| 13 | cold-coag. | Telesco | 0.90 | 0.73 | 21 | … | 2.9 | 2.11 | 28.7 | 4.34 | 5.41 | 2.34 | 0.020 | 3.60 | |
| 14 | hot-nebu. | Telesco | 0.90 | 0.80 | 21 | … | 2.8 | 2.25 | 47.8 | 9.46 | 10.0 | 1.22 | 0.017 | 4.89 | |
| 15 | cold-coag. | Gaussian | 0.90 | 0.73 | 15 | … | 2.8 | 0.22 | 0.81 | 0.15 | 5.49 | 193 | 0.045 | 3.44 | |
| 16 | cold-coag. | Gaussian | 0.90 | 0.73 | 15 | … | 3.1 | 19.1 | 1048 | 117 | 2.98 | 0.13 | 0.042 | 5.88 |
3 Discussion
It is seen in §2 that, using a simple power-law dust size distribution ( with , ) and a Gaussian-type dust spatial distribution with a peak at and a FWHM as inferred from the near-IR imaging observation of scattered starlight (Schneider et al. 1999; Kenyon et al. 1999), both the “cold-coagulation” dust model (no. 2) and the “hot-nebula” dust model (no. 6) are successful in reproducing the observed SED, provided that the dust in the disk is very fluffy, with a porosity . We note that, since we use this dust spatial distribution, it is expected that our models are also able to reproduce the imaging observations.
Both the “cold-coagulation” model and the “hot-nebula” model predict a vertical optical depth at visible wavelengths of at (see Table 1). This justifies the optically-thin treatment employed in the entire paper. This is because that in these models, with a power-law index for the size distribution of (see Table 1), most of the mass of the particles is in the largest grains. However, the opacity per gram dust ( where is the absorption efficiency) for these macroscopic grains ( at visible wavelengths) is much smaller than that of micron-sized dust: . We note that although the maximum dust size is not well constrained, the predicted IR emission spectrum and the optical depth are not very sensitive to the precise value of since grains larger than have and emit like black-bodies.
3.1 Robustness
The extent to which dust in protostellar disks has been processed prior to incorporation into planetesimals and comets is not known. But it seems plausible that a fraction of precometary materials has been processed in protostellar nebulae, based on the observationally presence of crystalline silicate dust in comets (see Wooden 2002 for a summary of the evidence). While at most of the silicate material is crystalline in the interstellar medium (Li & Draine 2001a), in some comets the fraction of crystalline silicate dust is as high as . Accretion heating in protoplanetary disks is a probable source for the formation site of the crystalline silicate – although 26Al heating of comets and consequent release of heat in the amorphous-to-crystalline ice transition cannot be ruled out. The warm inner zone of the accretion disk is particularly appealing as a site for the annealing of amorphous silicate. As a result of diffusional mixing induced by turbulence in the optically thick disk (Gail 2001), or outflows driven by reconnecting magnetic field lines (the “X-winds” model of Shu, Shang, & Lee [1996]), a fraction of the annealed silicate dust arrives at the cooler outer part of the disk to be incorporated in icy “cometary” bodies.
Therefore, we expect that the dust generated by collisions among cometary bodies (see §3.4), for either origin of the crystalline silicate material, should be intermediate between the “cold-coagulation” dust and the “hot-nebula” dust. The mixing ratio of these two dust types is unclear. In principle, the 10 silicate emission feature should allow us to infer the thermal history of silicate dust through the absence or presence (and the mass fraction) of crystalline silicate dust. However, the only available 8–13 spectrum shows very weak thermal emission in the silicate feature; its quality is inadequate to discern the detailed spectral features expected from crystalline silicate dust (Sitko, Lynch, & Russell 2000). But in any case, the fact that the two extreme models are able to provide close fits to the observed SED, any linear combinations of these two dust types (i.e., any degree of processing/modification) are expected to be able to reproduce the observed SED as well. Therefore, our models are robust.
3.2 Uniqueness
In modelling SED, dust sizes and dust spatial distribution are coupled. Since the dust spatial distribution we adopted for the disk is well constrained by near-IR images of scattered light (Schneider et al. 1999), the dust properties are more or less uniquely determined: the dust must be very fluffy (with ); the dust power-law size distribution has an index with a mean dust size of (see Table 1); the dust composition should be somewhere between the “cold-coagulation” dust and the “hot-nebula” dust although its detailed composition (e.g. the crystallinity of the silicate dust) is yet unknown (see §3.1).
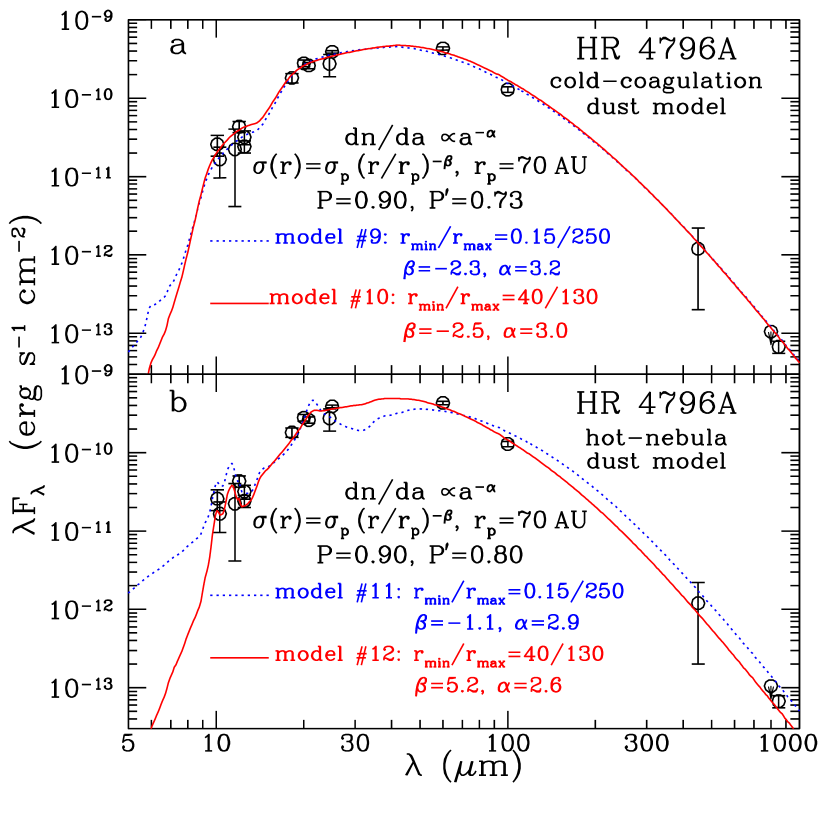
The dust spatial distribution in the disk was often modelled as a single power-law (Jayawardhana et al. 1998; Koerner et al. 1998; Wyatt et al. 1999) or two power-law components (Augereau et al. 1999). For the purpose of comparison, we have also modelled the SED assuming a single power-law dust distribution in terms of the () “cold-coagulation” dust model and the () “hot-nebula” dust model.333As in §2.1, the dust surface density distribution is written as . We consider two disk extents: (1) (see §2.1); and (2) . The latter takes into account the existence of an inner hole with a radius of which was first noticed by Jura et al. (1995) from an analysis of the IRAS (Infrared Astronomical Satellite) and ground-based photometry. The inner hole was later confirmed by mid-IR imaging of dust thermal emission carried out by three independent groups (Jayawardhana et al. 1998; Koerner et al. 1998; Telesco et al. 2000). These mid-IR imaging observations also implied an outer radius of for the disk. As can be seen in Figure 3, models with a single power-law dust spatial distribution are also successful in reproducing the observed SED. However, except the “hot-nebula” model (no. 12), all models (no. 9 – no. 11) require an increasing accumulation of dust toward the outer edge (i.e. ). This is neither physical nor consistent with the imaging observations of scattered light (Schneider et al. 1999) and dust thermal emission (Jayawardhana et al. 1998; Koerner et al. 1998; Telesco et al. 2000).
It is expected that models with two power-law dust spatial distributions are also able to reproduce the observed SED. But the constraints placed by the near-IR and mid-IR imaging observations would imply that the two-segment power-law distribution should not deviate much from the Gaussian function.
Assuming spherical silicate dust of a diameter of 2.5 (estimated from the 10.8 and 18.2 emission), Telesco et al. (2000) derived the dust spatial distribution from the 18.2 brightness distribution (see their Figure 5). We approximate their result as: for , (); for , ; for , . In Figure 4 we show that the best-fitting “cold-coagulation” (no. 13) and “hot-nebula” models (no. 14) with this dust distribution also provide close fits to the observed SED.
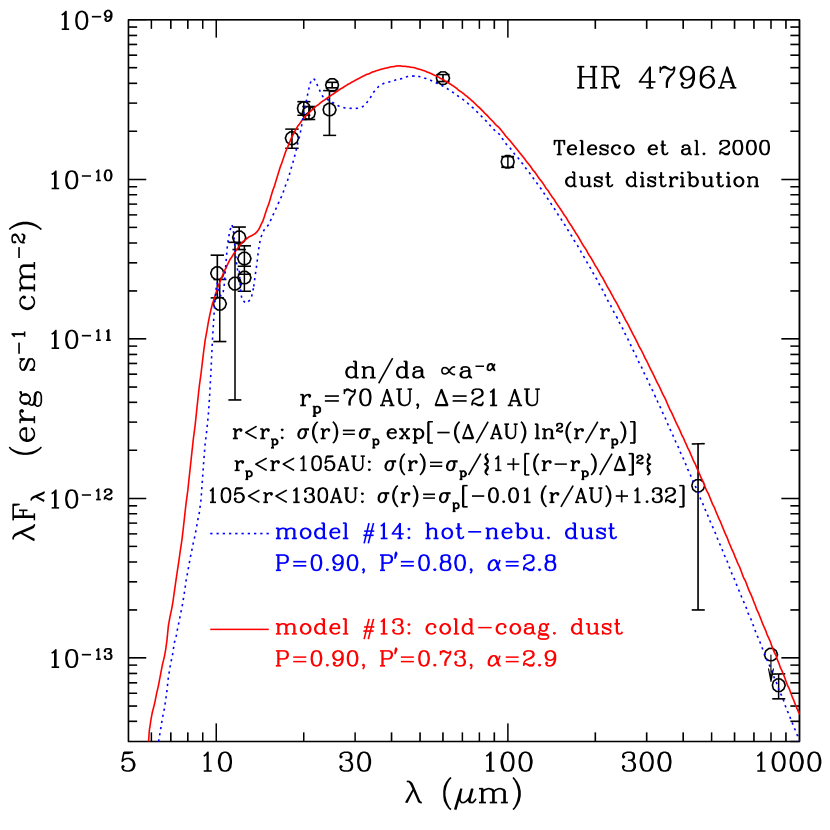
The overall shape of the Telesco et al. (2000) distribution resembles that of the Gaussian distribution, except that the former is relatively broader and has a flatter wing at . Since the Gaussian distribution was derived from scattered light images which reflect dust of all sizes while the Telesco et al. (2000) distribution was derived only from the 10.8 and 18.2 mid-IR-emitting dust, we prefer the Gaussian distribution although the real dust distribution may not be an exact Gaussian function.
To illustrate the disk regional contribution, we show in Figure 5 the IR emission from dust in the regions of , , and as well as calculated from the best-fitting “cold-coagulation” dust model (no. 2; , , ) with a Gaussian spatial distribution (, ). It is seen that the IR emission is exclusively contributed by dust confined in the ring region of .
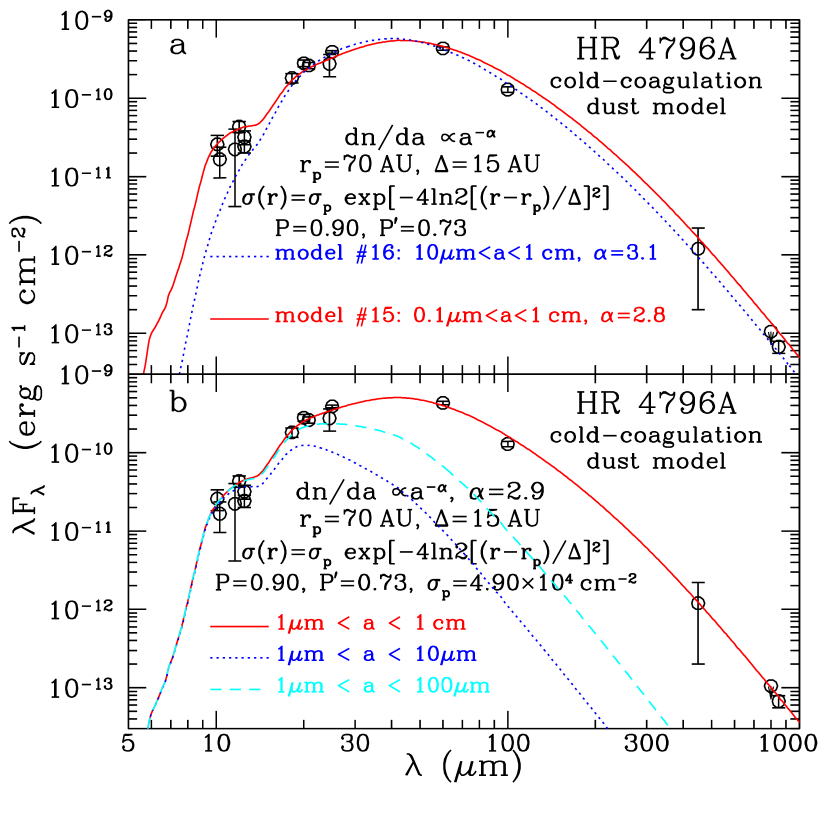
So far, all models assume . We now consider models with smaller or larger values. In Figure 6a we show the best-fit spectra calculated from models with (model no. 15) and (model no. 16). It is seen that (1) models with 444This requires that the constituent individual particles should be smaller than the typical interstellar dust (). emit a bit too much at ; decreasing the dust porosity improves the fit at but the fit to the part deteriorates; (2) models with emit too little at ; increasing the dust porosity does not solve this problem.
To illustrate the IR emission contributed by different dust sizes, we show in Figure 6b the emission spectra calculated from the best-fitting “cold-coagulation” model (no. 2; , , ) with (subject to radiative expulsion; see §3.4), (subject to Poynting-Robertson inward spiralling drag; see §3.4), and . It is seen that the mid-IR emission is dominantly produced by grains smaller than 100 in radius. Since these grains will be removed from the disk during its lifetime either through radiative expulsion or through Poynting-Robertson drag, there must exist a source of replenishment (see §3.4).
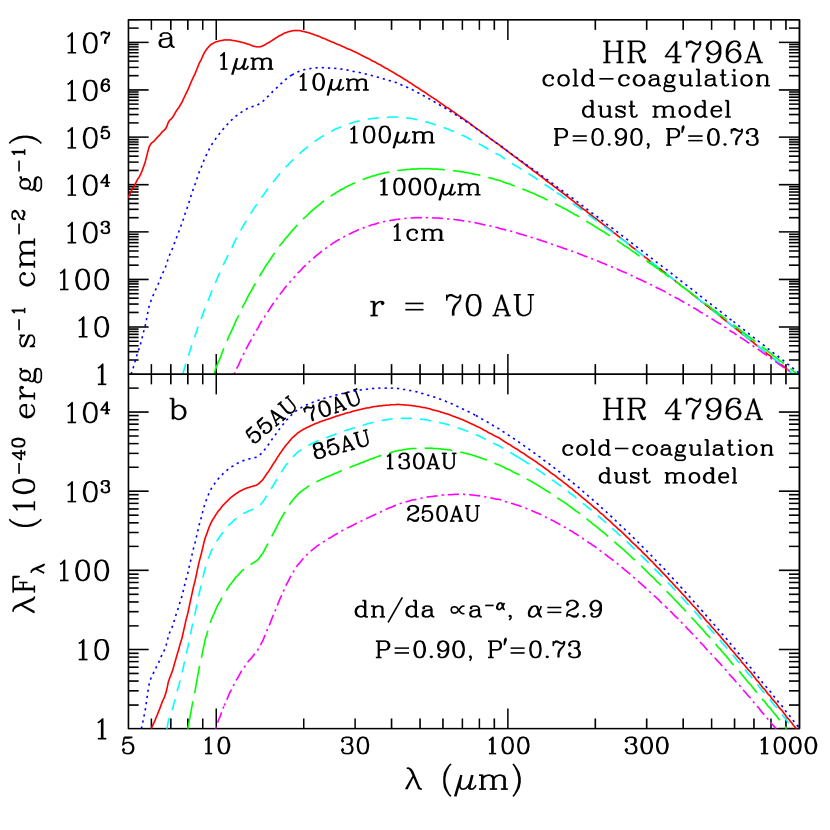
Finally, we show in Figure 7a the IR emission per unit dust mass received at the Earth produced by the () “cold-coagulation” dust at with a single size of (at , all grains are colder than 110 and have a porosity of [their constituent particles are coated by a layer of ice mantles] except the dust which attains an equilibrium temperature of and thus has no ice mantles and has a porosity of ). In Figure 7b we show the IR spectra emitted by a gram of the () “cold-coagulation” dust at with a distribution of sizes (, , ).
3.3 Is There A “Zodiacal Dust” Component?
In modelling the SED, Koerner et al. (1998) and Augereau et al. (1999) argued that, in addition to the dust responsible for the emission at , a hot “zodiacal dust” component which is confined within or of the star is required to account for the entire emission at and of the emission at . However, it can be seen clearly from Figure 1, Figure 2, and even the unphysical single power-law spatial distribution model of Figure 3 that, our models closely reproduce the observed SED over the entire wavelength range. There is thus no need to invoke a hot “zodiacal” dust component; indeed we may now ask how much such dust can be tolerated based on our models.
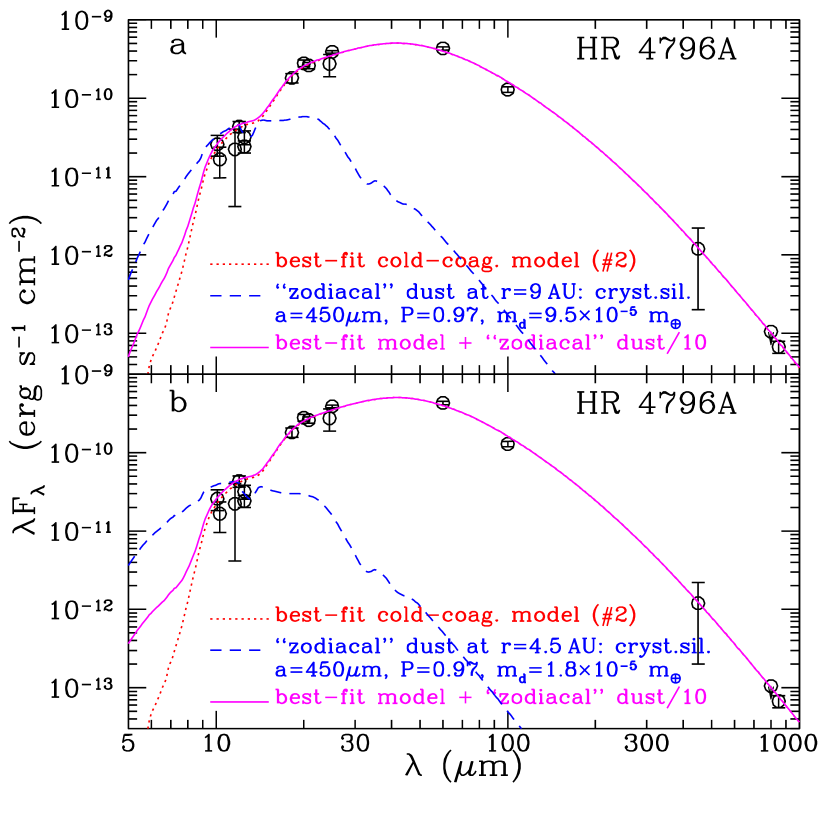
An upper limit on the “zodiacal” dust component can be obtained such that this abundance of hot dust, after added to the IR emission spectra of our best-fitting models (e.g., no. 2), would not exceed the observed emission at . Following Augereau et al. (1999), we assume that the “zodiacal” dust consists of porous () crystalline silicate grains of . As shown in Figure 8, if the observed emission at is entirely produced by the “zodiacal” dust, a total amount of is required if the “zodiacal” dust lies at . It is seen in Figure 8 that our best-fitting model (no. 2) allows at most 10% of this mass to be in the “zodiacal” dust component.
The reason why Koerner et al. (1999) required a population of “zodiacal dust” can be ascribed to the fact that they have not considered a distribution of dust sizes; instead, they simply approximated the dust emissivity as a one-parameter function: for and for where is a parameter characteristics of dust size. It would not be surprising if their model lacks hot dust emitting at since their approximation is essentially for single-sized dust models.
The reason why Augereau et al. (1999) needed a population of “zodiacal dust” may lie in the fact that they fixed the power-index of their dust size distribution to be . Using a steeper size distribution (in comparison with of our best-fitting models [no. 2 and no. 6; see Figures 1,2], Augereau et al. (1999) had to raise to in order to reproduce the long wavelength emission. This led to a paucity of small grains which are hot enough to emit at (this can also be seen in Figure 6a [dotted line]).
Also arguing against attributing the emission to a hot “zodiacal dust” component are the recent 10.8 and 18.2 mid-IR images of the disk that show that the disk’s size at 10 is comparable to its size at 18 (Telesco et al. 2000). This implies that the 18-emitting dust may also emit some, or all, of the 10 radiation (Telesco et al. 2000). This is in sharp contrast to the “zodiacal dust” assumption which suggested that the “zodiacal dust” component contributes to only of the 20 emission (Koerner et al. 1998; Augereau et al. 1999).
The tidal effects by sweeping inner planets together with the Poynting-Robertson drag may be responsible for the absence of a warm “zodiacal dust” population as well as the presence of an inner disk hole ().
3.4 Radiation Pressure and Poynting-Robertson Drag
In addition to the gravitational attraction from the central star, grains in the disk are subject to (1) radiative repulsion due to the momentum carried by stellar photons and (2) Poynting-Robertson drag which takes both energy and momentum from their orbits and causes them to spiral toward the gravitational force center (Burns, Lamy, & Soter 1979; Backman & Paresce 1993).
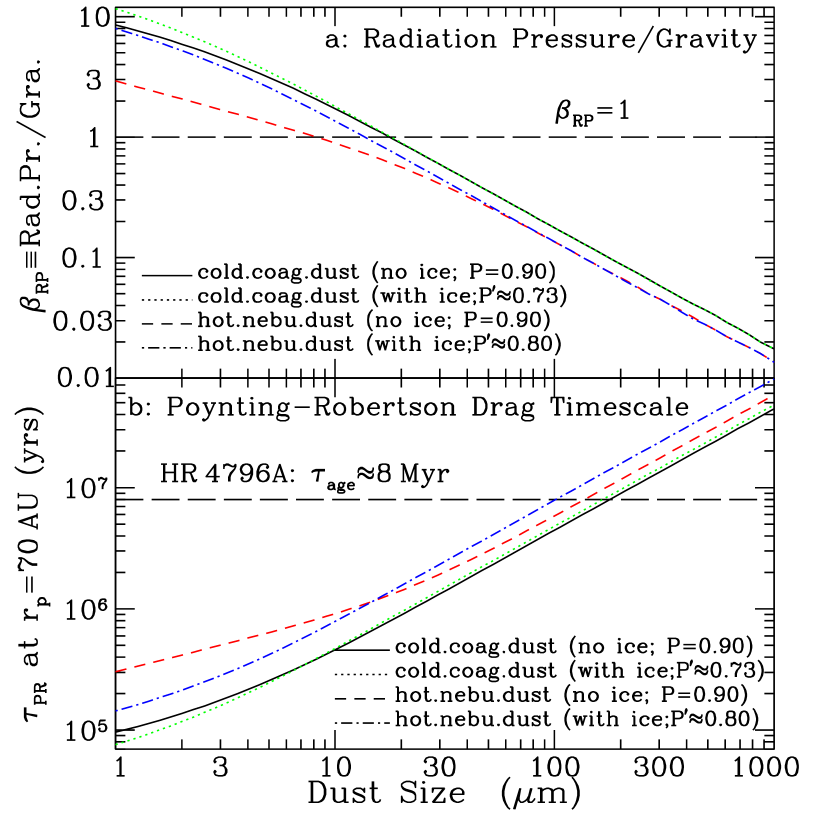
We have calculated – the ratio of radiative pressure (RP) force to gravitational force for the best-fitting “cold-coagulation” dust (no. 2; , ) and “hot-nebula” dust (no. 6; , ). As shown in Figure 9a, for grains smaller than , the radiation pressure overcomes the gravitational attraction (i.e. ) and, therefore, these grains will be blown out from the disk. The dust removal rate due to the radiation pressure expulsion can be estimated by integrating over the size range and over the entire disk. Assuming the RP timescale is comparable to the local dynamical timescale [], we estimate the RP dust mass loss rate to be for the best-fitting “cold-coagulation” model (no. 2) and for the best-fitting “hot-nebula” model (no. 6).
We have also calculated the Poynting-Robertson (PR) drag timescales (). In Figure 9b we show that, for grains smaller than at a radial distance of from the central star, their lifetimes (at ) due to the PR drag effect are shorter than the age and hence, for grains in the range of , although stable against radiation pressure ejection, the Poynting-Robertson drag could remove them from the disk. Since the best-fitting models have of the total surface areas in grains smaller than , these grains must be efficiently replenished by cascade collisions of planetesimals and larger grains. By integrating the PR dust removal rate over the whole size range and over the entire disk, we estimate the PR dust mass loss rate to be for the best-fitting “cold-coagulation” model (no. 2) and for the best-fitting “hot-nebula” model (no. 6).
Therefore, over the life span of , roughly of dust is lost by radiation pressure and Poynting-Robertson drag, which is about 3 times smaller than the estimation of Augereau et al. (1999; ). This is mainly because Augereau et al. (1999) attributed the dominant dust removal process to grain-grain collisions. We consider this unlikely since grain-grain collisions would not remove the dust from the disk, instead, they just re-distribute the dust over different size bins through fragmentation or sticking.555Since the grain-grain collision timescale at [ is the Keplerian frequency; () is the stellar mass; is the Gravitation constant] is comparable to the RP timescale (at ), a stable population of dust can also be obtained through a cascade production during collisions between larger grains.
It is well established (see e.g. Spangler et al. 2001, Zuckerman & Becklin 1993) that the amount of IR excess around main sequence stars decreases with the star’s age. There are at least two possible explanations for this result: (1) the particles are lost by the Poynting-Robertson drag effect; (2) the particles have coalesced into larger bodies which are undetectable as the opacity per gram decreases (, see §3). For the disk, the latter process seems to be the dominant one as reflected by its collisionally-replenished secondary nature – the amount of dust incorporated into larger bodies which act as a source of replenishment must be much larger than that of the dust lost through Poynting-Robertson drag.
3.5 Predictions for SIRTF
The Space Infrared Telescope Facility (SIRTF) will be capable of sensitive imaging using the Infrared Array Camera (IRAC) at 3.6, 4.5, 5.8, and 8.0, and using the Multiband Imaging Photometer (MIPS) at 24, 70, and 160. In Table 2 we show the band-averaged intensities for our preferred dust models.
SIRTF will also be able to perform low-resolution 5–40 and high-resolution 10–37 spectroscopic observations using the Infrared Spectrograph (IRS) instrument. IR spectroscopy and imaging will provide powerful constraints on the dust spatial distribution and its chemical composition. The “cold-coagulation” dust models all predict an almost featureless SED (the 9.7 amorphous silicate feature is very broad and smooth).666The 3.3, 6.2, 7.7, 8.6 and 11.3 vibrational bands characteristic for polycyclic aromatic hydrocarbon (PAH) molecules are not seen in our model spectra although their presence in the disk is expected in the context of the “cold-coagulation” model since PAHs are a significant constituent of interstellar dust (see e.g. Li & Draine 2001b). This is mainly because PAHs have condensed in the icy mantles of the porous aggregates at . In the inner regions of the disk, PAHs, sublimated from the icy mantles, would be rapidly photodissociated. Therefore, PAHs are not considered in this paper. The presence of PAHs in dusty disks will be discussed in a subsequent paper. In contrast, the “hot-nebula” dust models predict two sharp crystalline silicate features at 11.3 and 23. In order to produce noticeable 11.3 and 23 features, at least 20% of the silicate dust must be in the crystalline form. SIRTF spectroscopy will allow us to infer the degree of processing which the dust has experienced.
| model | IRAC | IRAC | IRAC | IRAC | MIPS | MIPS | MIPS |
|---|---|---|---|---|---|---|---|
| no. | 3.6 | 4.5 | 5.8 | 8.0 | 24 | 70 | 160 |
| 2 | 1.18 | 9.81 | 5.09 | 7.39 | 2.63 | 7.26 | 2.94 |
| 6 | 3.44 | 3.91 | 2.18 | 1.67 | 2.85 | 6.61 | 2.58 |
| 13 | 1.31 | 9.51 | 4.62 | 6.62 | 2.56 | 7.81 | 3.41 |
| 14 | 3.68 | 3.74 | 1.98 | 1.51 | 2.79 | 7.12 | 2.99 |
4 Conclusion
We have modelled the mid-infrared to submillimeter spectral energy distribution of the ring-like dust disk around the dustiest -old A-type star . We start with two extreme dust types: one formed through cold-coagulation of unaltered protostellar interstellar grains, and one formed through aggregation of grains highly-processed in the protostellar nebula with silicate dust annealed and carbon dust oxidized. We adopt a Gaussian-type dust spatial distribution with a peak at from the central star and a FWHM of as inferred from images of scattered light and dust thermal emission. We take a simple power-law for the dust size distribution ( with ) in the range of . Our principal results are:
-
1.
It is shown that both types of dust are successful in reproducing the observed SED, provided that the dust generated by collisions of planetesimals and cometesimals is highly fluffy, with a vacuum volume fraction of (§2). The fact that the dust in the disk must be somewhere intermediate between these two types implies that our models are robust. Future high resolution spectroscopy of the disk would allow us to infer the degree to which the dust has been processed (§3.1).
-
2.
Although models with a single power-law spatial distribution are also able to reproduce the observed SED, the derived dust distribution is both unphysical and inconsistent with the imaging observations of scattered light and dust mid-IR thermal emission (§3.2).
-
3.
Our models show no evidence for the existence of a hot “zodiacal dust” component suggested to lie in a radial distance of a few AU from the star by previous workers to account for the emission at (§3.3). Our upper limit on the total mass of this component is at least 10 times smaller than what would be obtained if the entire emission is attributed to this hot dust.
-
4.
Grains smaller than will be radiatively expelled from the disk; grains at in the range of will also be removed from the disk due to the Poynting-Robertson inward spiralling drag (at a closer distance from the star, larger grains will be removed). Collisions of planetesimals/cometesimals must continuously replenish the dust in the disk at a rate of (§3.4).
Appendix A Possible Dust Composition for Cold Protoplanetary Disk
The coagulation of interstellar grains that results in fluffy and inhomogeneous aggregates occurs in cold, dense molecular clouds and protostellar and protoplanetary dust disks. It plays an important role in the formation of planetary systems (Weidenschilling & Cuzzi 1993). In this section we approximately derive the proportional composition of the dust in circumstellar disks around (pre-)MS stars from the abundances of the condensible elements (C, N, O, Si, Fe, and Mg),777Some H will be present, mostly in combination with O, C, and N. assuming protostellar activities impose little modification on protostellar grain compositions (see Beckwith, Henning, & Nakagawa 2000).
Let be the cosmic abundance of X relative to H (we assume the cosmic elemental abundances are those of the solar values: parts per million (ppm), , , , , and [Sofia & Meyer 2001]); be the amount of X in gas phase (, , ; Fe, Mg and Si are highly depleted in dust; see Li & Greenberg 1997 and references therein); be the amount of X relative H locked up in dust (, , , , , ). Assuming a stoichiometric composition of MgFeSiO4 for interstellar silicates, the total mass of silicate dust per H atom is where is the atomic weight of X in unit of , and is the amount of O in silicate dust per H atom (i.e., we assign 4 O atoms for the average of the Fe, Mg, and Si abundances). The carbonaceous dust component is dominated by C, with little H, N, and O (we assume H/C=0.5, O/C=0.1). The total mass of carbon dust per H atom is . The C, O, and N atoms left over after accounting for the silicate and carbon dust components are assumed to condense in icy grains in the form of H2O, NH3, CO, CO2, CH3OH and CH4 (following Greenberg [1998], we assume CO:CO2:CH3OH:CH4:H2CO=10:4:3:1:1). The total mass of icy grains per H atom is , where the mass of C-containing ice ; the mass of NH3 ice ; the mass of water ice ; is the amount of O locked up in H2O ice (we assume H2O contains all the remaining available O).
Therefore, as a first approximation, we may assume a mixing ratio of and for cold regions (for hot regions where ices sublimate the dust can be simply modelled as porous aggregates of silicate and carbon particles with ). This does not deviate much from the in situ measurements of cometary dust (, ; see Greenberg & Li 1999 and references therein) which is often suggested to be porous aggregates of unaltered interstellar dust (Greenberg 1998; Greenberg & Li 1999).
Appendix B Dust Morphology
Dust formed through coagulation of many small subgrains has a porous structure. Let and be the total volumes taken up by the silicate and carbonaceous dust components, respectively; be the porosity – the fractional volume of vacuum; and ) be the mass densities of silicate and carbonaceous materials, respectively. The mass density for a fluffy aggregate of silicate and carbonaceous subgrains with a porosity of is . In regions colder than , pre-existing or recondensed ices around the silicate and carbonaceous dust cores would fill all or part of the vacuum in the aggregate. Let be the total volume taken up by the ice component; be the ice mass density. The porosity for the fluffy aggregate of ice-coated silicate and carbonaceous subgrains would be reduced to . Its mean mass density is . The dust “size” is defined as the radius of the sphere which encapsulates the whole fluffy aggregate. The mean mass densities defined here are independent on aggregate size.
References
- (1) Augereau, J.C., Lagrange, A.M., Mouillet, D., Papaloizou, J.C.B., & Gorod, P.A. 1999, A&A, 348, 557
- (2) Backman, D.E., & Paresce, F. 1993, in Protostars and Planets III, ed. E.H. Levy & J.I. Lunine (Tucson: Univ. Arizona Press), 1253
- (3) Beckwith, S.V.W., Henning, Th., & Nakagawa, Y. 2000, in Protostars and Planets IV, ed. V. Mannings, A.P. Boss, & S.S. Russell (Tucson: Univ. Arizona Press), 533
- (4) Bohren, C.F., & Huffman, D.R. 1983, Absorption and Scattering of Light by Small Particles (New York: Wiley)
- (5) Burns, J.A., Lamy, P.L., & Soter, S. 1979, Icarus, 40, 1
- (6) Draine, B.T., & Lee, H.M. 1984, ApJ, 285, 89
- (7) Gail, H.-P., 2001, A&A, 378, 192
- (8) Greenberg, J.M. 1998, A&A, 330, 375
- (9) Greenberg, J.M., & Li, A. 1999, Space Sci. Rev., 90, 149
- (10) Jayawardhana, R., Fisher, R.S., Hartmann, L., Telesco, C.M., Piña, R.K., & Fazio, G. 1998, ApJ, 503, L79
- (11) Jura, M. 1991, ApJ, 383, L79
- (12) Jura, M., Zuckerman, B., Becklin, E.E., & Smith, R.C. 1993, ApJ, 418, L37
- (13) Jura, M., Ghez, A.M., White, R.J., McCarthy, D.W., Smith, R.C., & Martin, P.G. 1995, ApJ, 445, 451
- (14) Jura, M., Malkan, M., White, R., Telesco, C.M., Piña, R.K., & Fisher, R.S. 1998, ApJ, 505, 897
- (15) Kenyon, S.J., Wood, K., Whitney, B.A., & Wolff, M.J. 1999, ApJ, 524, L119
- (16) Klahr, H.H., & Lin, D.N.C. 2000, ApJ, 554, 1095
- (17) Koerner, D.W., Ressler, M.E., Werner, M.W., & Backman, D.E. 1998, ApJ, 503, L83
- (18) Kurucz, R.L. 1979, ApJS, 40, 1
- (19) Li, A., & Draine, B.T. 2001a, ApJ, 550, L213
- (20) Li, A., & Draine, B.T. 2001b, ApJ, 554, 778
- (21) Li, A., & Greenberg, J.M. 1997, A&A, 323, 566
- (22) Li, A., & Greenberg, J.M. 1998, A&A, 331, 291
- (23) Li, A., & Lunine, J.I. 2003, ApJ, 594, 987
- (24) Schneider, G., et al. 1999, ApJ, 513, L127
- (25) Shu, F.H., Shang, H., & Lee, T. 1996, Science, 271, 1545
- (26) Sitko, M.L., Lynch, D.K., & Russell, R.W. 2000, AJ, 120, 2609
- (27) Sofia, U.J., & Meyer, D.M. 2001, ApJ, 554, L221
- (28) Spangler, C., Sargent, A.I., Silverstone, M.D., Becklin, E.E., & Zuckerman, B. 2001, ApJ, 555, 932
- (29) Telesco, C.M., et al. 2000, ApJ, 530, 329
- (30) Weidenschilling, S.J., & Cuzzi, J.N. 1993, in Protostars and Planets III, ed. E.H. Levy & J.I. Lunine (Tucson: Univ. Arizona Press), 1031
- (31) Wooden, D.H. 2002, Earth, Moon, & Planets, 89, 247
- (32) Wyatt, M.C., Dermott, S.F., Telesco, C.M., Fisher, R.S., Grogan, K., Holmes, E.K., & Piña, R.K. 1999, ApJ, 527, 918
- (33) Zuckerman, B., & Becklin, E.E. 1993, ApJ, 414, 793