The Astrophysical Journal,
vol. 594, 987–1010
Modeling the Infrared Emission from the HD 141569A Disk
Abstract
We model the infrared (IR) emission from the double-ring disk of , using a porous dust model that was previously shown successful in reproducing the spectral energy distributions (SEDs) of the disks around Pictoris and . The dust consists of either unaltered or highly processed interstellar materials and vacuum with a volume fraction of . Together with a population of polycyclic aromatic hydrocarbon (PAH) molecules of which a large fraction is charged, the porous dust model made of coagulated but otherwise unaltered protostellar interstellar grains provides an excellent fit to the entire SED from the mid-IR to millimeter wavelengths including the PAH mid-IR emission features. The nondetection of the 21 crystalline silicate feature predicted from the porous dust model composed of highly-processed grains (mainly crystalline silicate dust) imposes an upper limit of on the mass fraction of crystalline silicates. Spectroscopic and broadband photometric predictions are made for SIRTF observations which will provide further tests of the applicability of the porous dust model to circumstellar disks.
1 Introduction
Since dust disks around young stars, depending on their age, are the source material or the remnants of newly-formed planets, the physical, chemical, and dynamical properties of circumstellar disks and their constituent grains are crucial in understanding the formation process of planetary systems.
Over the past 2 decades, impressive evidence has been assembled for the commonality of circumstellar dust disks around pre-main-sequence stars (T Tauri stars and Herbig Ae/Be stars), main sequence (MS) stars, post-MS stars (red giants), and a white dwarf (see Backman & Paresce 1993, Habing et al. 2001, Zuckerman 2001, Lagrange, Backman, & Artymowicz 2001 for reviews). To date, at least 15% of the A–K type stars are found to have dust disks around them (see Lagrange, Backman, & Artymowicz 2001). The majority of these disks are spatially extensive, with their dust quantities and intensities of scattered-starlight and of dust thermal emission gradually decreasing outward from the central stars. However, so far there exist four exceptions: (1) Eridani – a old (Henry et al. 1996) K2V MS star – has a nearly face-on dust ring with a mass and radius () similar to the solar system Kuiper Belt and is thought to be an analog to the young solar system (Greaves et al. 1998); (2) Formahault ( PsA) – a old (Barrado y Navascués et al. 1997) A3V MS star – exhibits a “doughnut”-like dust annulus with a radial distance of from the star and a width of (Holland et al. 1998, 2003); (3) – a old A0V star (see Jura et al. 1998) – displays a ring-like disk peaking at from the central star and abruptly truncated both inward and outward with a width of (Schneider et al. 1999; Koerner et al. 1998; Jayawardhana et al. 1998; Telesco et al. 2000); (4) – a nearby (distance to the Earth ; van den Ancker, de Winter, & Tjin A Djie 1998) old (Weinberger et al. 2000) pre-MS Herbig Ae/Be star with a spectral type of B9.5V, an effective temperature of and a surface gravity of (Dunkin, Barlow, & Ryan 1997).
The presence of dust around was first reported by Jaschek, Jaschek, & Egret (1986), de Grijp, Miley, & Lub (1987), and Walker & Wolstencroft (1988) based on the IRAS (Infrared Astronomical Satellite) detection of infrared (IR) excess over expected from its photosphere. It has recently been imaged in scattered light and in thermal IR emission. With the discovery of its large and morphologically complicated debris disk (see below), has recently aroused considerable interest.
The disk around appears to have two ring-like structures: an outer ring at from the star with a width of ; and an inner ring at . The outer ring was reported independently by Augereau et al. (1999a) and by Weinberger et al. (1999), respectively based on the 1.6 and 1.1 imaging of the scattered-light. They both used the Near-IR Camera and Multiobject Spectrometer (NICMOS) on the Hubble Space Telescope (HST). The inner ring was discovered by Weinberger et al. (1999) at 1.1 using the same instrument. Weinberger et al. (1999) also reported the detection of a gap or “dip” (a region of depleted material) at from the star with a width of . They interpreted the gap as a sign of one or more planets orbiting within the disk (the planets do not have to be in the gap), but other explanations such as dust migration also exist (e.g. see Takeuchi & Artymowicz 2001).
This ring-gap-ring structure was later confirmed by optical coronagraphic observations made by Mouillet et al. (2001) at an effective wavelength of 5850 using the HST Space Telescope Imaging Spectrograph (STIS). With a higher spatial resolution and a higher signal-to-noise ratio than the NICMOS/HST data, Mouillet et al. (2001) found that the inner ring, with a FWHM (full width of half maximum) of , actually peaks at . Strong brightness asymmetry was also reported by Mouillet et al. (2001). This asymmetry, interpreted as a result of the gravitational perturbation caused by putative massive planets within the disk, by the two stellar companions and , or both types of objects (Mouillet et al. 2001), was confirmed by the ground-based 2.2 near-IR imaging observation at the Palomar 200 inch telescope using the adaptive optics system (Boccaletti et al. 2003).
In addition to the two annuli, the existence of a third dust component – a population of warm, mid-IR emitting dust within from the star – was recently reported by Fisher et al. (2000). It was shown that the 10.8 and 18.2 emission observed with the University of Florida Observatory Spectrometer and Camera for the Infrared (OSCIR) on the Keck II telescope extend out to from the star (Fisher et al. 2000). The existence of such an extended, warm source close to the star, originally suggested by Augereau et al. (1998) to account for the disk IR emission at wavelengths , was later confirmed by the 12.5, 17.9, and 20.8 imaging using the JPL Mid-InfraRed Large-well Imager (MIRLIN) on the Keck II telescope (Marsh et al. 2002).
More recently, the HRC (High Resolution Channel) coronagraphic B, V, and I images of the disk obtained with the HST Advanced Camera for Surveys (ACS) revealed a tightly-wound spiral structure with two arms, one of which stretches outward to reach the nearby companion stars (Clampin et al. 2003).
In a previous paper (Li & Lunine 2003), we have shown that the IR emission from the disk can be well fit by a model invoking highly porous cometary-type dust. The porous cometary dust model was originally proposed for the Pictoris disk and was shown successful in reproducing its spectral energy distribution from the near-IR to millimeter wavelengths including the 10 amorphous and the 11.3 crystalline silicate features (Li & Greenberg 1998). In this paper we will model the observed IR and millimeter photometric and mid-IR spectroscopic signatures of . The objectives of this paper are three-fold: (1) We wish to infer the physical and chemical properties of the dust in the disk and its relationship to the formation of planets. (2) We wish to know how widely applicable is the porous dust model; if it can be shown that the porous dust model is also valid for many other disks at different evolutionary stages and with different geometrical structures, it will be a valuable guide for interpreting future data sets. This is of particular importance given that the incoming Space Infrared Telescope Facilities (SIRTF) will accumulate a rich set of IR photometric and spectroscopic data for a large number of dust disks; we would hope that the porous dust model presented in this and related papers could serve as a starting point in analyzing these data. (3) We wish to make near- and mid-IR spectral and broadband photometry predictions for the disk; these predictions can be compared to future SIRTF observations in order to test further the validity of the porous dust model.
This paper is organized as follows: we first summarize in §2 the photometric and spectroscopic data available for the disk that are relevant in modeling the IR emission of the disk. We then give an overview discussion in §3.1 of the proposed dust model with emphasis on dust composition and morphology from the point of view of protoplanetary disk evolution, followed by detailed discussions of the PAH component in §3.1.1 and the porous dust component in §3.1.2. The IR emission modeling technique is presented in §3.1.3. In §3.1.4 the PAH photoelectric emission rates and the electron recombination rates are calculated, using the methods described in §A and §B. The key model parameters are discussed and specified in §3.1.5. Model results are presented in §3.2. In §4 we discuss (1) previous studies of the SED modeling of the disk, (2) comparison of the disk with the disk, (3) exploration of parameter space (§4.1), (4) PAH photodestruction (§4.2), and (5) dust loss through radiation expulsion and Poynting-Robertson drag (§4.3). In §4.4 we calculate the dust IR flux densities integrated over the SIRTF/IRAC and MIPS bands predicted for our best-fitting models. Spectroscopic predictions are also made for SIRTF/IRS observations. The major conclusions are summarized in §5.
2 Available Photometric and Spectroscopic Data
To facilitate modeling of the dust properties of the disk, we have assembled the available optical, IR, and millimeter photometric data and mid-IR spectra. These include (1) the BV optical photometry (Sylvester et al. 1996); (2) the JHKLL′M near-IR photometry obtained by Sylvester et al. (1996) using the single-channel bolometer UKT9 at the United Kingdom Infrared Telescope (UKIRT); (3) the 12, 25, 60, and 100 IRAS photometry (Sylvester et al. 1996); (4) the 10.8 and 18.2 OSCIR/KeckII imaging by Fisher et al. (2000); (5) the 12.5, 17.9, and 20.8 MIRLIN/KeckII imaging by Marsh et al. (2002); (6) the 7.5–13.5 (spectral resolution ) and 15.8–23.9 () spectroscopy obtained by Sylvester et al. (1996) using the UKIRT Cooled Grating Spectrometer 3 (CGS3); (7) the 1350 SCUBA (Submillimetre Common-User Bolometer Array) measurement by Sylvester, Dunkin, & Barlow (2001) using the James Clerk Maxwell Telescope (JCMT). Taking (Weinberger et al. 1999), we have corrected the interstellar reddening assuming a (total-to-selective extinction) interstellar extinction law (see Table 6 in Li & Draine 2001).
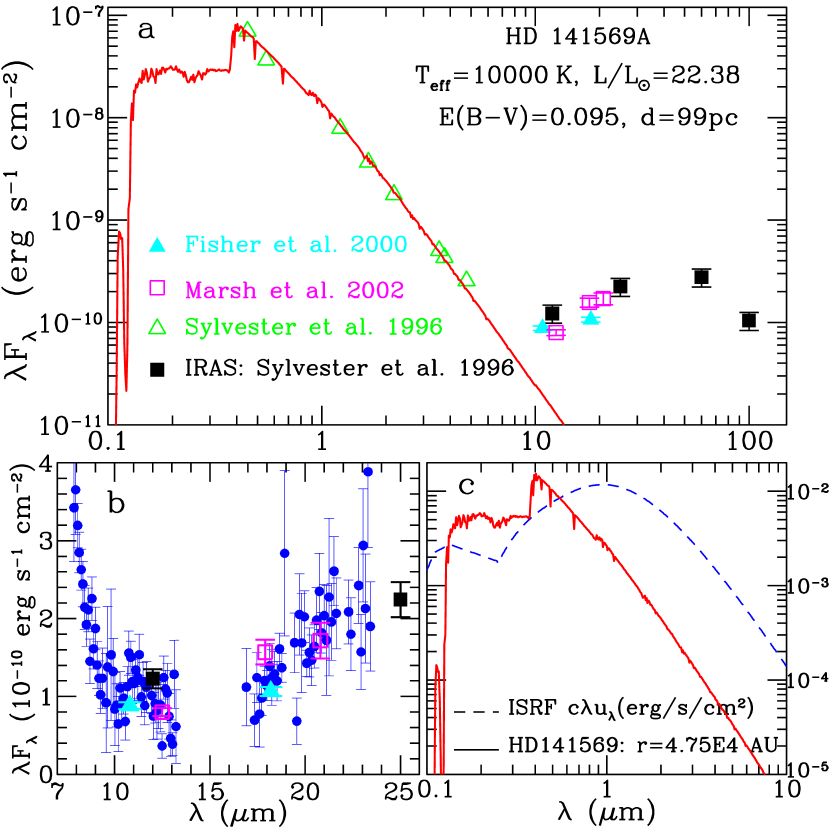
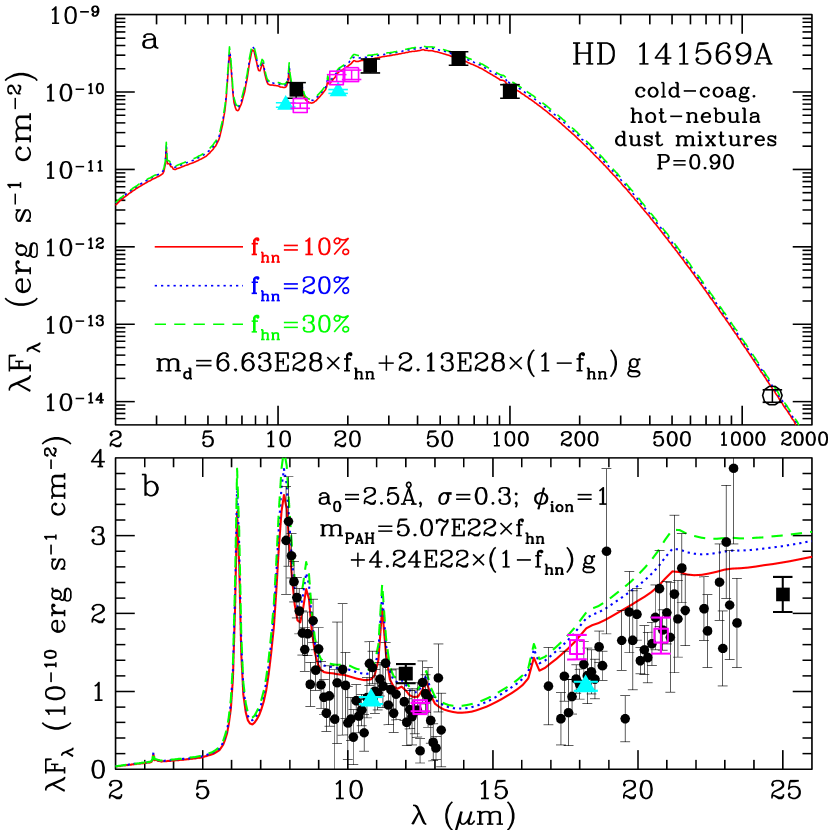
Table 1 summarizes the photometric data listed above, the instruments/telescopes and their beam sizes through which the observational data were obtained, and the stellar atmospheric and dust disk contributions to each photometric band. In Figure 1a we plot the reddening-corrected optical, IR, and millimeter photometric results as well as the and Kurucz model atmospheric spectrum. Figure 1b illustrates the CGS3 mid-IR spectrum which clearly exhibits the 11.3 out-of-plane C-H bending feature and the long-wavelength wing of the 7.7 C-C stretching feature (see Li & Draine 2001a for the PAH band assignment). For the sake of comparison, the 10.8, 18.2 OSCIR/KeckII data, the 12, 25 IRAS data, and the 12.5, 17.9, 20.8 MIRLIN/KeckII data, are also plotted in Figure 1b. It is seen that these mid-IR data closely agree with one another.111The 12 IRAS data is about 12% higher than the band-averaged CGS3 spectrum. We have therefore reduced the former by a factor of 1.12 to bring the 12 IRAS data into agreement with the CGS3 spectrum. The largest discrepancy () occurs for the 17.9 MIRLIN/KeckII (Marsh et al. 2002) data and the 18.2 OSCIR/KeckII data (Fisher et al. 2000). This discrepancy cannot be explained in terms of the difference in the aperture sizes of these two instruments. As a matter of fact, the former (which has a higher 17.9 flux density) was obtained using a smaller aperture. The CGS3 mid-IR spectrum, obtained with a 5.5′′ beam, appears to be intermediate between the MIRLIN and the OSCIR data. Therefore, we ascribe this discrepancy to observational uncertainties. Both data points will be included in our detailed dust modeling.
| bbTotal flux density observed from the Earth. | ccStellar photospheric contribution to the observed flux density. | ddDust IR excess from the disk. | bbTotal flux density observed from the Earth. | ccStellar photospheric contribution to the observed flux density. | ddDust IR excess from the disk. | Telescope/ | Beam/Aperture | Reference | |
| (m) | (Jy)ee. | (Jy) | (Jy) | () | () | () | Instrument | Size | |
| 0.45 (B) | 10.50 | 10.50 | - | - | - | - | Sylvester et al. 1996 | ||
| 0.55 (V) | 6.70 | 6.70 | - | - | - | - | Sylvester et al. 1996 | ||
| 1.22 (J) | 3.19 | 3.19 | - | - | UKIRT | 7.8′′ | Sylvester et al. 1996 | ||
| 1.65 (H) | 2.02 | 2.02 | - | - | UKIRT | 7.8′′ | Sylvester et al. 1996 | ||
| 2.18 (K) | 1.29 | 1.29 | - | - | UKIRT | 7.8′′ | Sylvester et al. 1996 | ||
| 3.55 (L) | 0.59 | 0.58 | 0.018 | UKIRT | 7.8′′ | Sylvester et al. 1996 | |||
| 3.76 (L′) | 0.54 | 0.50 | 0.040 | UKIRT | 7.8′′ | Sylvester et al. 1996 | |||
| 4.77 (M) | 0.40 | 0.33 | 0.070 | UKIRT | 5.0′′ | Sylvester et al. 1996 | |||
| 12 | 0.49 | 0.058 | 0.43 | IRAS | Sylvester et al. 1996 | ||||
| 25 | 1.87 | 0.014 | 1.86 | IRAS | Sylvester et al. 1996 | ||||
| 60 | 5.54 | 0.0024 | 5.54 | IRAS | Sylvester et al. 1996 | ||||
| 100 | 3.48 | 0.0009 | 3.48 | IRAS | Sylvester et al. 1996 | ||||
| 10.8 | 0.318 | 0.071 | 0.25 | OSCIR/KeckII | Fisher et al. 2000 | ||||
| 18.2 | 0.646 | 0.026 | 0.62 | OSCIR/KeckII | Fisher et al. 2000 | ||||
| 12.5ffThe MIRLIN/KeckII instrument has a field of view of . But the flux given in this table was obtained by an integration over a diameter circular aperture (see Marsh et al. 2002). | 0.333 | 0.054 | 0.28 | MIRLIN/KeckII | 5′′ | Marsh et al. 2002 | |||
| 17.9ffThe MIRLIN/KeckII instrument has a field of view of . But the flux given in this table was obtained by an integration over a diameter circular aperture (see Marsh et al. 2002). | 0.936 | 0.027 | 0.91 | MIRLIN/KeckII | 5′′ | Marsh et al. 2002 | |||
| 20.8ffThe MIRLIN/KeckII instrument has a field of view of . But the flux given in this table was obtained by an integration over a diameter circular aperture (see Marsh et al. 2002). | 1.19 | 0.020 | 1.17 | MIRLIN/KeckII | 5′′ | Marsh et al. 2002 | |||
| 1350 | 0 | 0.0054 | SCUBA | 22′′ | Sylvester et al. 2001 |
3 Modeling the Dust IR Emission
3.1 Dust Model
Interstellar grains undergo coagulational growth in cold, dense molecular clouds and protostellar and protoplanetary dust disks. This process creates dust with fluffy, inhomogeneous structures and fairly quickly leads to the formation of planetesimals of cometary to asteroidal sizes.
Based on its short lifetime due to radiative expulsion, the dust in the disk is thought to be of secondary debris origin (Weinberger et al. 1999, 2000; Fisher et al. 2000; Marsh et al. 2002); i.e, the dust is generated by the breaking down of large bodies like planetesimals, comets, and asteroids, rather than direct remnant left over from the star formation process. Since planetesimals and comets are formed through coagulation of porous dust aggregates (Cameron 1975, 1995; Weidenschilling & Cuzzi 1993; Greenberg & Li 1999; Beckwith, Henning, & Nakagawa 2000), the dust generated by collisions of planetesimals should resemble the original dust from which they are built up.
Following Li & Lunine (2003), we will model the dust as porous aggregates of either processed or unprocessed interstellar materials. We will consider two dust types – each represents an extreme case – the “cold-coagulation” dust model and the “hot-nebula” dust model. While the former assumes that the dust aggregate is formed through cold-coagulation of unaltered protostellar interstellar grains, the latter goes to the other extreme by assuming that the constituent grains in the dust aggregate are highly-processed in the protostellar nebula where the originally amorphous silicate grains all are annealed and the carbon grains all are destroyed by oxidization and are converted into CO (see Li & Lunine 2003 for details).
A porous dust grain is characterized by (1) its fluffiness or porosity (the fractional volume of vacuum); (2) its spherical radius (the radius of the sphere encompassing the entire aggregate; we assume all grains are spherical in shape); (3) composition – the “cold-coagulation” dust model assumes the dust to be composed of amorphous silicate and carbonaceous materials (and H2O-dominated ices in regions colder than ); the “hot-nebula” dust model assumes the dust to be composed of only crystalline silicates (and ices in cold regions). As discussed in Li & Lunine (2003), for the “cold-coagulation” dust model, the mixing mass ratios for the silicate, carbon and ice constituent grains are approximately derived, by assuming cosmic abundance, to be and where , , and are respectively the total mass of the silicate, carbon, and ice subgrains. For the “hot-nebula” dust model, we will take and (see Li & Lunine 2003). We adopt a mass density of , , and respectively for the silicate, carbonaceous, and ice materials.222For pure H2O ice we have . Since interstellar ice is a “dirty” mixture of H2O, NH3, CO, CO2, CH3OH, CH4 and many other molecules (see Appendix A in Li & Lunine 2003), we adopt for “dirty ice” material (Greenberg 1968).
In addition to the porous dust component discussed above, the presence of PAH molecules in the disk is clearly indicated by the red wing of the 7.7 feature and the 11.3 feature seen in the CGS3 mid-IR spectrum (Sylvester et al. 1996; see Fig. 1b). Therefore, we will consider two dust populations in our models: the porous dust component (§3.1.1) and the PAH component (§3.1.2).
3.1.1 Polycyclic Aromatic Hydrocarbon Dust
PAHs are excited by ultraviolet (UV), visible, and to a lesser extent by long wavelength photons (Li & Draine 2002a). Following Li & Draine (2002a), we define as the – starlight intensity incident on the disk at a distance of from the central star relative to the value for the Mathis, Mezger, & Panagia (1983; hereafter MMP) solar neighborhood interstellar radiation field333For radiation fields with the same 912 – 1 intensity, the 6–13.6 starlight intensity of the Kurucz radiation field is about 1.27 times that of the MMP field.
| (1) |
where is the stellar radius; is the flux per unit wavelength () at the top of the illuminating star’s atmosphere which is approximated by the Kurucz model atmospheric spectrum for B9.5 V stars ( and ; Kurucz 1979); is the speed of light; is the energy density of the MMP interstellar radiation field. In Figure 1c we plot the starlight spectrum at which corresponds to . Since the disk extends to a distance of only , the dust in this disk receives far more intense irradiation than the dust in the diffuse interstellar medium: !
Illuminated by starlight with an intensity of , the IR emissivity per gram dust () for a mixture of neutral and ionized PAHs with a size distribution of is
| (2) | |||||
where is the spherical radius of a PAH molecule;444Small PAHs (with carbon atoms) are expected to be planar (see Appendix A in Draine & Li 2001). The term “PAH radius” used in this paper refers to the radius of a spherical grain with the same carbon density as graphite () and containing the same number of carbon atoms : [or ]. is the lower-cutoff PAH size; and are the absorption cross sections for neutral and ionized PAH molecules, respectively (see Li & Draine 2001a); is the Planck function at temperature ; and , are, respectively, the probabilities that the vibrational temperature will be in for neutral and charged PAHs illuminated by starlight intensity ; is the probability of finding a PAH molecule of radius in a non-zero charge state; is the mass density of PAHs which is taken to be that of graphite ().
Based on the “thermal-discrete” method (Draine & Li 2001), the temperature distribution functions have been computed by Li & Draine (2002a) for neutral and charged PAHs and ultrasmall silicate grains of a range of sizes illuminated by stars with a range of effective temperatures and with a range of starlight intensities . In this work we take the Li & Draine (2002a) results for .
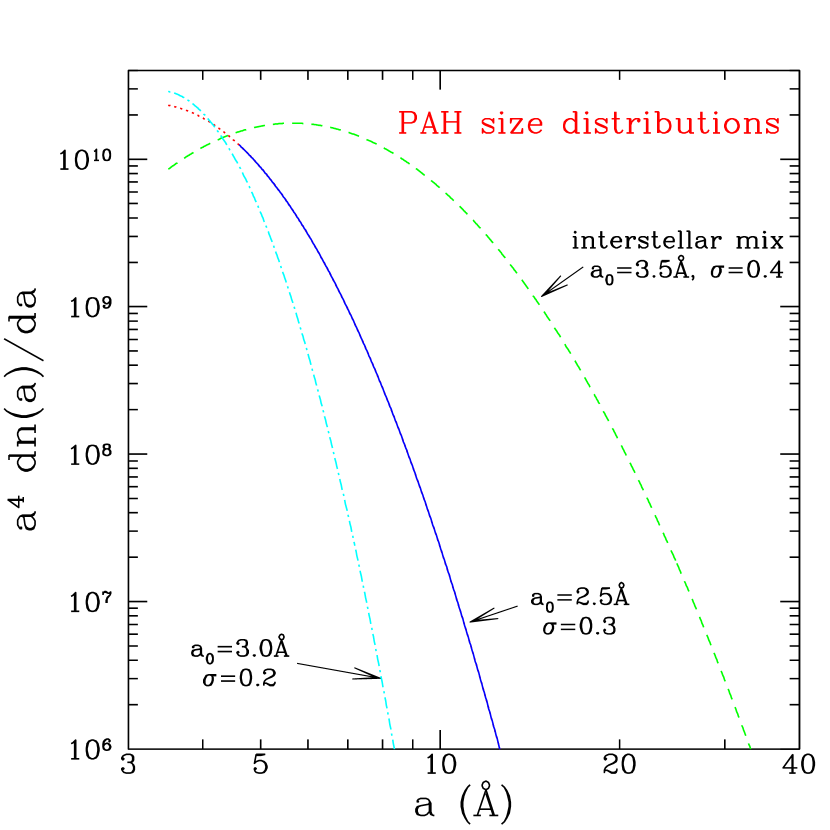
We adopt a log-normal size distribution for the PAHs in the disk, characterized by two parameters: and ; and respectively determine the peak location and the width of the log-normal distribution:
| (3) |
where is the error function. The log-normal functional form for the PAH size distribution was shown successful in modeling the PAH mid-IR emission spectra observed for the Milky Way diffuse interstellar medium (Li & Draine 2001a), reflection nebulae (Li & Draine 2002a), and the Small Magellanic Cloud (Li & Draine 2002b).
Lacking a priori knowledge of the balance between the photodestruction and collisional production of PAHs as a function of PAH size in the disk, we adopt a lower-cutoff of (corresponding to for PAHs) which is the minimum survival size for PAHs in the diffuse interstellar medium (see Li & Draine 2001a). It will be seen in §4.2 that PAHs smaller than will be photolytically unstable in the inner region around the star during the lifetime of the disk. PAHs are also subject to radiative expulsion. Continuous replenishment of this material, presumably by sublimation of the icy mantles (in which interstellar PAHs have condensed during the dense molecular cloud phase) coated on the individual subgrains of large porous dust produced by collisions of large parent bodies, is required to maintain the PAH disk. Therefore, it is reasonable to assume that small PAH molecules with are also continuously replenished so that there exists a stable distribution of small PAHs in the disk. Since the dust (including PAHs) in the disk originates from the interstellar medium (ISM), it is thus reasonable to adopt the interstellar lower-cutoff for the PAHs in the disk. But we will also see in §4.2 that models with are also capable of closely reproducing the observed SED including the PAH emission features.
3.1.2 Porous Dust
Large porous dust in the disk will attain a steady-state temperature determined by balancing absorption and emission,
| (4) |
where is the absorption cross section of porous dust of spherical radius at wavelength ; is the equilibrium temperature of dust of size at a radial distance of from the star.
The IR emissivity () for porous dust with a size distribution of located at a distance of from the central star is
| (5) |
We assume a power-law dust size distribution for the porous dust
| (6) | |||||
where is the spherical radius, is the lower-cutoff, is the upper-cutoff, and is the power-law index. We take ,555A fluffy grain of with a porosity of consists of constituent individual (interstellar) particles which have a typical size of (see Li & Greenberg 1997). Models with a smaller () and a larger () will be discussed in §4.1. and (this is not a critical parameter since grains larger than emit like blackbodies and their IR emission spectra are size-insensitive; see Figure 6).
We use Mie theory to calculate the absorption cross sections for porous dust. The fluffy heterogeneous dust aggregate is represented by an equivalent homogeneous sphere with an effective dielectric function . Dielectric functions for the constituent dust materials are taken from (1) Draine & Lee (1984) for amorphous silicate dust; (2) Li & Draine (2001b) for crystalline silicate dust; (3) Li & Greenberg (1997) for carbonaceous dust; (4) Li & Greenberg (1998) for H2O-dominated ice. Let , , and be the complex dielectric functions of silicate (either amorphous or crystalline), carbonaceous, and ice dust, respectively. Let , , and respectively be the volume fraction of silicate, carbonaceous, and ice dust in an aggregate, which can be obtained from the mass mixing ratio and and the fluffiness () of the aggregate (see §3.1). We first employ the Maxwell-Garnett effective medium theory (Bohren & Huffman 1983) to calculate the average dielectric functions for the ice-coated silicate subgrains and the ice-coated carbonaceous subgrains
| (7) |
| (8) |
where is the fraction of ice condensed on the silicate cores. For the “cold-coagulation” dust model, we assume (i.e. in an dust aggregate, the available ice equally condenses on the silicate subgrains and on the carbonaceous subgrains); for the “hot-nebula” dust model, we assume since we assume that all carbon dust has been destroyed by oxidation (see Li & Lunine 2003). We then use the Bruggman effective medium theory (Bohren & Huffman 1983) to calculate the mean dielectric functions for the porous heterogeneous dust aggregate
| (9) |
where the third term accounts for the contribution from the vacuum (). By definition, Eqs.(7-9) are valid for both the “cold-coagulation” dust model () and the “hot-nebula” dust model () either with () or without () ice mantles.
3.1.3 IR Emission Spectrum
For a given dust size distribution and a given disk structure (i.e., the dust spatial density distribution), the emergent IR emission spectrum can be obtained by integrating over the dust size range, and over the entire disk. Assuming an optically thin (see §3.2) and radially symmetric disk, the flux density () received at the Earth is
| (10) |
where is the distance from the star to the Earth; is the surface density for the porous dust component; and are respectively the inner and outer boundaries of the disk; is the total mass of the PAH dust required to account for the observed PAH IR emission bands if the PAH molecules in the disk are illuminated by starlight of an intensity of times that of the 912 – 1 MMP interstellar radiation field. We will justify the optical thin treatment in §3.2 (also see Table 2). The disk is actually asymmetric (Mouillet et al. 2001; Boccaletti et al. 2003; Clampin et al. 2003), therefore, our model, based on an assumption of a radially symmetric disk, is somewhat simplified. But this is not expected to affect the conclusion of this paper since the asymmetric dust spatial distribution which would account for the observed brightness asymmetry, with some fine tuning, would also be able to reproduce the observed SED as can be seen from Eq.(10).
Due to their single-photon heating nature, the IR emission spectral shape of PAHs is independent of the starlight intensity ; the absolute emissivity level simply scales with (Draine & Li 2001; see Fig. 13 in Li & Draine 2001a). Namely, remains identical over the entire dust disk, provided that the charging condition for PAHs does not vary in the disk.666The PAH ionization fraction depends on and where is the electron density in the disk and is the gas temperature (Weingartner & Draine 2001). For computing the PAH component, it is therefore not necessary to integrate over the disk; instead, it is sufficient just to calculate the PAH IR emission spectrum for a single radiation intensity (i.e., a single region in the disk). The required PAH mass is inversely proportional to .
The total mass for the porous dust component is
| (11) |
where is the mass density of the porous dust component (see Appendix B in Li & Lunine 2003).
The vertical optical depth is
| (12) |
where is the extinction cross section of the porous dust of spherical radius at wavelength . The optical depth from the PAH component is negligible (see §3.2).
The dust spatial distribution is well constrained by the near-IR imaging of scattered starlight (Weinberger et al. 1999; Augereau et al. 1999a) and mid-IR imaging of dust thermal emission (Marsh et al. 2002). We adopt the following analytical formula to approximate the dust distribution which was derived from the scattered light (see Fig. 3 of Weinberger et al. 1999) and dust thermal emission (see Fig. 4 of Marsh et al. 2002)777We assume that the dust vertical distribution is determined by the vertical hydrostatic equilibrium (see Eqs.[B2-B4] in §B).
| (13) | |||||
| (14) | |||||
| (15) |
where is the mid-plane surface density at . We note that, since we use this dust spatial distribution, it is expected that our models are also able to reproduce the imaging observations. Eq.(13) represents the 12.5, 17.9, 20.8 mid-IR emitting dust component (Marsh et al. 2002); Eq.(14) and Eq.(15) describe the two annular structures peaking at , respectively (Augereau et al. 1999a; Weinberger et al. 1999; Mouillet et al. 2001). The inner boundary is set at where grains are heated to . Therefore, is a function of dust size. For micron-sized grains, the inner boundary is roughly at . The outer boundary is taken to be which is expected from the disk truncation caused by the tidal effects of , a companion star of (Weinberger et al. 2000).888It was shown by Artymowicz & Lubow (1994) that circumstellar disks will be truncated by the tidal effects of a companion star in circular orbit at approximately 0.9 of the average Roche lobe radius. For the (; van den Ancker et al. 1998) and (; Weinberger et al. 2000) system with a mass ratio of , the Roche lobe radius is , where ( [Weinberger et al. 2000]; [Boccaletti et al. 2003]) is the physical separation between and . However, if is out of the disk plane, the physical separation must be much larger than 990. As will be discussed in §4.1, models with a larger value also provide good fits to the observed SED (see Figure 7). This is also consistent with the near-IR scattered light observations reported by Weinberger et al. (1999) and Augereau et al. (1999a) which show that the disk extends to a radial distance of about 500.
The mean starlight intensity , averaged over the different portions of the disk, and weighted by the surface density of the porous dust population, is
| (16) | |||||
PAHs smaller than will be photodestroyed in a time scale shorter than the age of the system (see §4.2). PAHs will also be efficiently removed from the disk by radiation pressure (see §4.3). Therefore, the PAH component in the disk must be continuously replenished, most likely through the evaporation of the icy mantles999PAHs are abundant and widespread in the interstellar medium (see Léger & Puget 1984, Allamandola, Tielens, & Barker 1985, Li & Draine 2001a). It is expected that the icy mantles of the grains in dust disks, formed from condensation of volatile molecular species in the dense cloud phase, contain a substantial amount of PAHs since the freeze-out of PAHs onto the icy mantles are also expected to occur in the dense cloud phase and during the aggregation process. of grains produced by the breakup of larger bodies. The evaporation of icy mantles takes place at for micron-sized dust and at for mm-sized dust (see Figure 6). Therefore, it is reasonable to assume that the free-flying PAH molecules, responsible for the observed PAH IR emission bands, are mainly distributed in the inner region. If we assume that the spatial distribution of PAHs follows that of the porous dust at , the mean starlight intensity to which the PAHs in the disk are exposed is (see Eq.[16]).
3.1.4 PAH Ionization
PAHs acquire charge through photoelectric emission and collisions with electrons and ions. Ideally, one can calculate the steady-state charge distribution for a PAH molecule of radius from the balance between the electron capture rates and the photoelectron emission rates plus the ion capture rates (e.g. see Weingartner & Draine 2001). Since little is known regarding the electron density and its distribution in the disk, we will not carry out detailed calculations of the PAH charge distribution; instead, we will just calculate and compare the photoionization rates (; see §A) and the electron recombination rates (; see §A and §B) for PAHs as a function of size and as a function of distance from the central star.
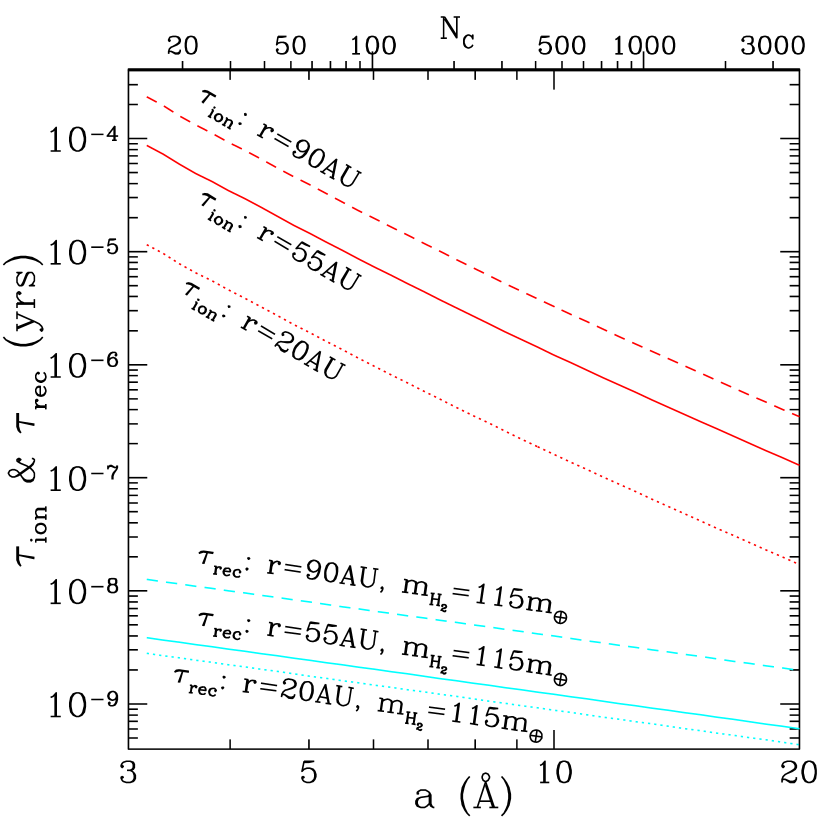
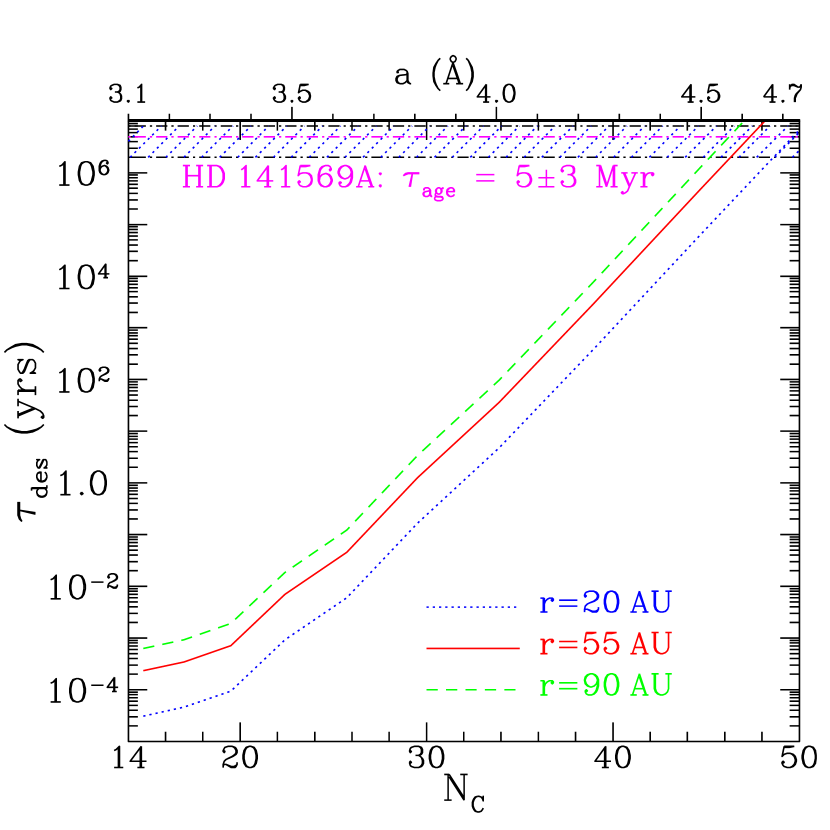
In Figure 2 we present the photoionization time scales () for PAHs of various sizes at 3 characteristic distances (corresponding to the maximum and half-maximums of the PAH distribution; see Eq.[13]), calculated from the method described in §A. It is seen in Figure 2 that decreases as PAHs become larger and as PAHs are closer to the central star. The former is because when PAHs become larger, their ionization thresholds decrease (see Eq.[A6]) and their UV/visible absorption cross sections increase so that their photoionization rates increase (see Eq.[A7]). The latter is because, closer to the illuminating star, the UV radiation field is more intense (; see Eq.[A7]).
Assuming that the source of the electrons in the disk is dominated by the cosmic ray ionization of , and adopting a total mass of inferred from submillimeter measurements of CO (Zuckerman, Forveille, & Kastner 1995), we calculate the electron recombination time scales (; see §B for details). As shown in Figure 2, the electron recombination time scales are by orders of magnitude smaller than . Therefore, PAHs in the disk will be negatively charged.
3.1.5 Model Parameters
We have two sets of parameters to be specified or constrained:
- 1.
- 2.
For a given set of and , the total amount of PAH dust is determined by the absolute level of the observed PAH flux density (see Eqs.[2,3,10]). Since little is known regarding the electron density and its distribution in the disk, it is impossible to perform accurate calculations on . But we have seen in §3.1.4 that PAHs in the disk will be negatively charged by capturing electrons from the cosmic ray ionization of . Since we do not distinguish the IR properties of PAH- anions from PAH+ cations (Li & Draine 2001a),101010It has been shown that the IR properties of PAH anions closely resemble those of PAH cations (e.g., see Szczepanski, Wehlburg, & Vala 1995; Langhoff 1996; Hudgins et al. 2000) except for the very strong 3.3 C-H stretch enhancement in the anion (Szczepanski et al. 1995; Hudgins et al. 2000). However, Bauschlicher & Bakes (2000) predict that PAH- anions have band strengths intermediate between those of neutrals (strong 3.3 C-H stretching and 11.3, 11.9, 12.7 out-of-plane C-H bending modes) and PAH+ cations (strong 6.2, 7.7 C-C stretching and 8.6 C-H in-plane bending mode). In any case, the detailed differences in the band strengths between PAH- anions and PAH+ cations would not alter our conclusions since, as shown in §4.1, models containing a fraction () of neutral PAHs are also capable of fitting the observed PAH mid-IR spectrum (see Figures 8b,c). it is appropriate to take . But we will also consider models with (see §4.1 and Figures 8b,c).
As shown in Li & Greenberg (1998) and Li & Lunine (2003), cometary-type porous dust with is able to reproduce the observed SEDs from the IR to millimeter for the disks around the MS star Pictoris and the pre-MS star ; therefore, we will start with in modeling the SED; but models with larger or smaller will also be discussed (see §4.1 and Figure 7).
It is interesting to note that, as early as 1965, based on a Monte Carlo simulation, Cameron & Schneck (1965) showed that a very open structure (“fairy castle”) with a porosity in the range of (Cameron & Schneck [1965] used the term “underdense”) is expected for dust aggregates assembled from randomly incident particles, depending on their shapes, sizes and incidence angles (also see Cameron 1995). A porosity of for the “cold-coagulation” dust (which implies a mass density of for this dust assuming ice mantles coated on the individual subgrains []; see Appendix B in Li & Lunine 2003) is consistent with the mean mass density of cometary nuclei determined from studies of comet splitting and of non-gravitational forces (Rickman 2003; Whipple 1999). Comets are likely to have been formed initially through the cold accumulation of interstellar dust (e.g. see Greenberg & Li 1999). Hence, the ice-coated “cold-coagulation” dust aggregates we consider here are plausible building blocks of cometesimals and, hierarchically, comets.
Similar to the PAH mass parameter , for a given set of and , the total amount of porous dust (characterized by ; see Eqs.[11,13,14,15]) is determined by the absolute level of the observed flux density at wavelengths .
Therefore, we are left with adjustable parameters: , , and .
For a model with adjustable parameters, the goodness of fit is measured by
| (17) |
where is the model spectrum (see Eq.[10]), and is the (dereddened, stellar photospheric contributions subtracted) observational spectrum which includes the 10 IRAS, OSCIR, MIRLIN, and SCUBA photometric data points and the 95 CGS3 spectroscopic data points (see Table 1).
3.2 Model Results
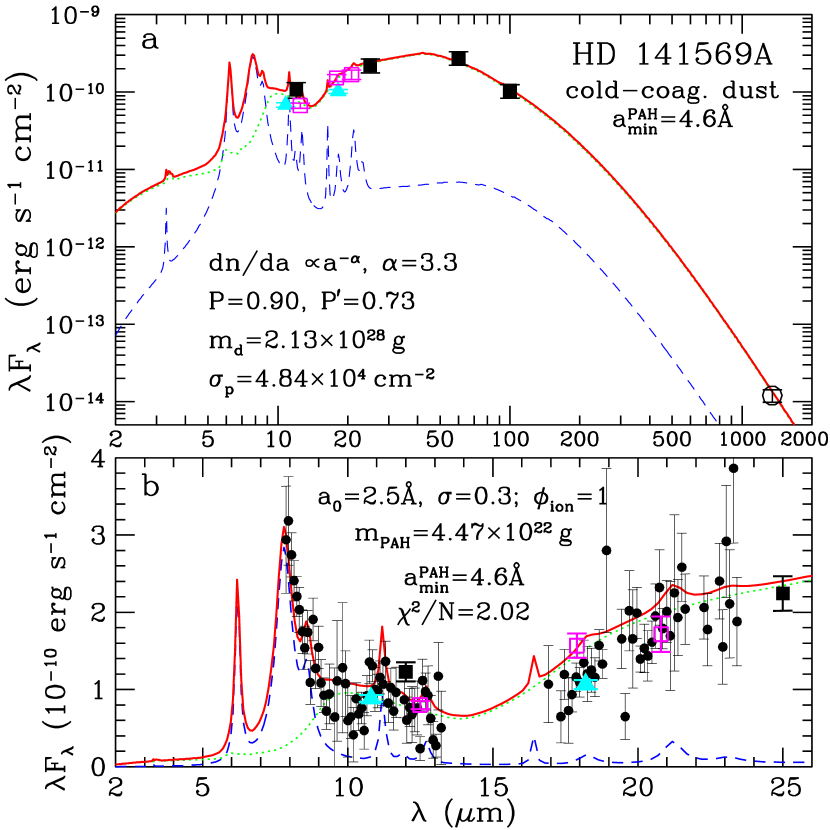
We first consider the “cold-coagulation” dust model. As shown in Figure 3, our best-fit model (no. 1) provides an excellent fit to the entire spectrum (including both the broadband photometry and the PAH emission features) with emission from a mixture of PAH cations () and porous dust with a porosity of , a power-law size distribution index of , and a total dust mass of . The PAH component is characterized by , , and . See Table 2 for a full set of model parameters. For the sake of convenience, hereafter we call this model the “canonical cold-coagulation model”.
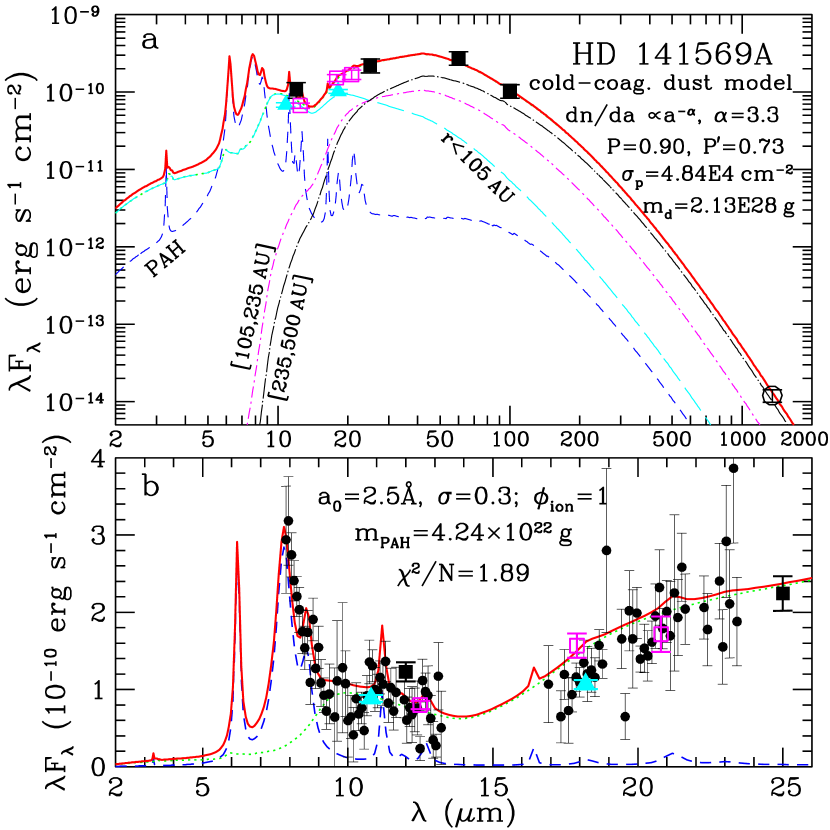
To illustrate the contributions to the observed IR emission from dust in different regions, we show in Figure 3a the IR emission from warm dust in the inner region of , and from cool dust in the inner () and outer rings (). While the cool dust in the two rings dominates the emission at and accounts for of the IRAS flux (it is the dust in the outer ring that is responsible for the SCUBA emission), the mid-IR 10.8 and 18.2 radiation detected by the OSCIR/KeckII instrument (Fisher et al. 2000; plotted as filled-triangles in Figure 3) are exclusively emitted by warm dust at . This confirms earlier work of Fisher et al. (2000) and Augereau et al. (1999a) who suggested the existence of two separate populations of dust grains in the disk: inner, warmer grains that emit the mid-IR (10 and 18) radiation, and more distant grains that are responsible for the scattered near-IR flux seen in the NICMOS image and the far-IR (60 and 100) emission detected by IRAS. It is worth noting that in our model, the warm dust fully accounts for both the 10.8 and the 18.2 emission, with very little contribution from the PAH component (also see Figure 3b). This is consistent with the discovery of Fisher et al. (2000) that the emitting regions at both wavelengths are of comparable size and therefore the same population of dust may emit both the 10.8 and 18.2 radiation.
Our model yields a total dust IR flux of , corresponding to an IR luminosity of , of the total stellar luminosity (). The fractional contributions of the PAH component, the inner warm dust component, the inner ring, and the outer ring (see Figure 3a), are approximately 12%, 26%, 25%, and 37%, respectively.
Our model predicts a vertical optical depth at visible wavelengths of at (see Table 2). The vertical optical depths at other radial distances are smaller than this as can be seen from Eqs.(12-15). The in-plane optical depth is also much smaller than one.111111The in-plane optical depth can be calculated from where is the vertical scale height (see Eq.[B4]). Our best-fit model leads to . This justifies the optically-thin treatment employed in the entire paper. The PAH component causes little extinction: its contribution to the visual vertical optical depth at where the distribution of PAHs in the disk peaks (see §3.1.3) is only .121212At a first glance, one may argue that the PAH optical depth at visual wavelengths would also be about 12% of the total since the PAH component emits of the total flux so that it must have absorbed of the total stellar radiation. We remind the reader that in our model the PAH dust lies closer to the star () so that it is exposed to a radiation field times stronger than that of the porous dust component (see Eq.[16] and §3.1.3). Another reason lies in the fact that PAHs absorb more efficiently in the UV compared to the visible than do micron-sized silicate or carbon grains (see Figure 2 in Li & Draine 2001a, Figure 1 in Li & Draine 2002a, Figures 4a and 5a in Draine & Lee 1984).
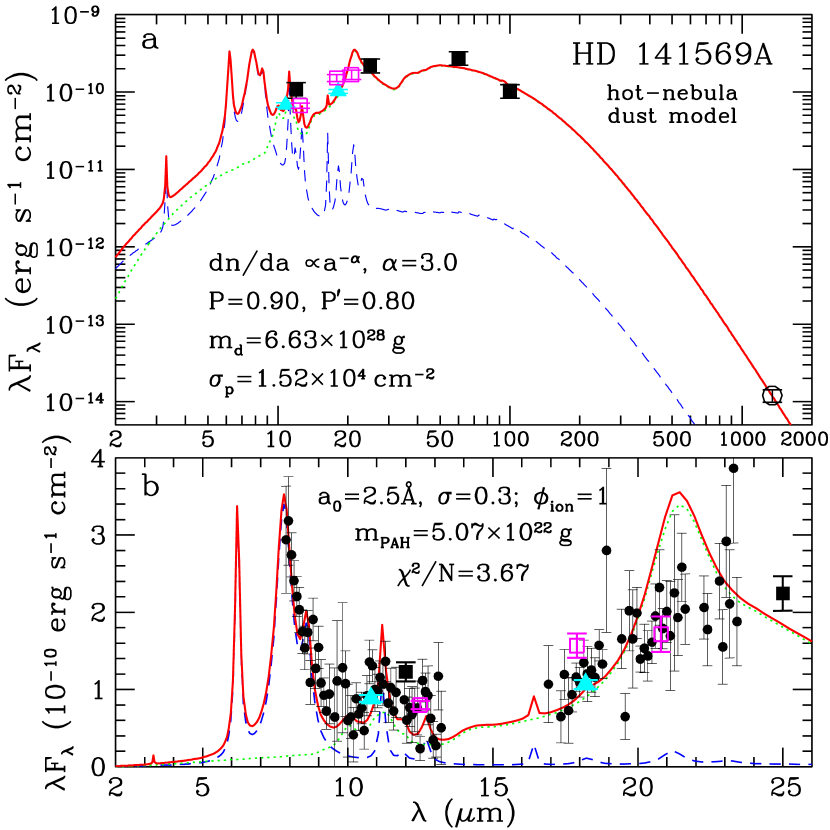
Similar results are obtained for the “hot-nebula” dust model. We show in Figure 4 the best-fit () “hot-nebula” dust model spectrum (model no. 2; see Table 2 for model parameters). In comparison with the observed SED, the overall fit is acceptable except that the model predicts a strong crystalline silicate emission band at which is not seen in the CGS3 spectrum (Sylvester et al. 1996), suggesting that only a small fraction of the hot silicate dust is in crystalline form.
One should keep in mind that the “cold-coagulation” model and the “hot-nebula” model represent two extremes; the actual dust in the disk is likely to be somewhere intermediate between these two types. Therefore, we consider a dust model consisting of a mixture of these two dust types with various mass mixing ratios.131313For simplicity, we assume that they are separate populations. In reality, it is more likely that the highly processed “hot-nebula” dust and the “unaltered” protostellar interstellar dust are mixed to some extent and hence form porous heterogeneous aggregates. Let be the mass fraction of the “hot-nebula” dust in the mixture of highly-processed dust and “unaltered” dust. Let and respectively be the IR flux for per gram “cold-coagulation” dust (model no. 1) and “hot-nebula” dust (model no. 2). Let and respectively be the dust mass required for the “cold-coagulation” model (no. 1) and the “hot-nebula” model (no. 2) to reproduce the observed SED. The model spectrum expected from a mixture of these two kinds of dust with a mixing mass fraction of is simply
| (18) |
In Figure 5 we plot the model spectra with , 20% and 30%. As can be seen in Figure 5b, the non-detection of the 21 crystalline silicate feature places an upper limit of .
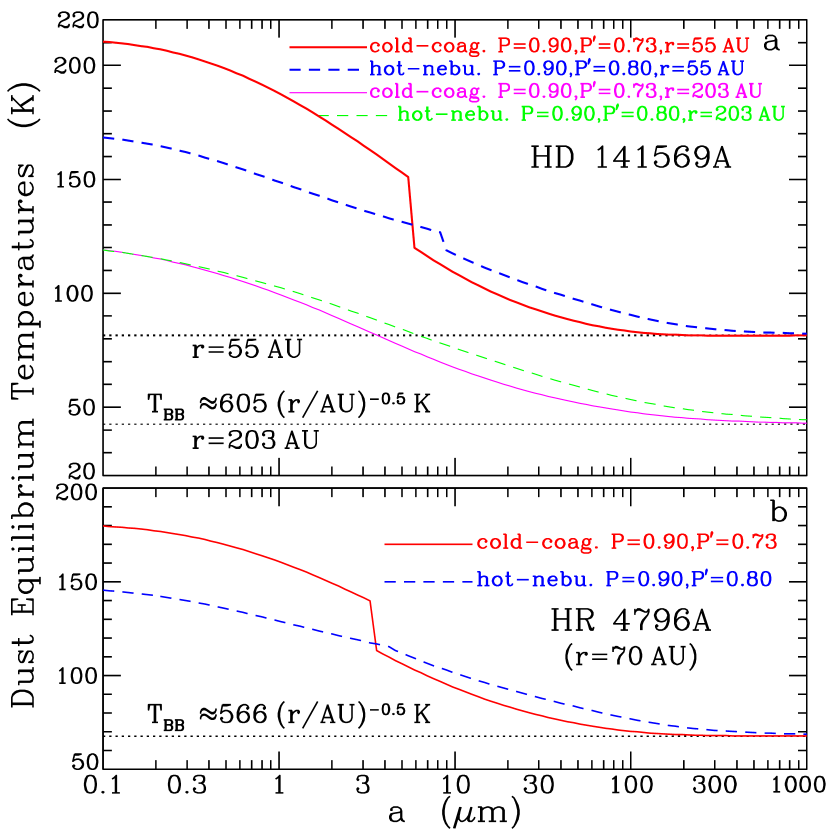
Finally, we present in Figure 6 the equilibrium temperatures for the best-fit “cold-coagulation” dust (, ) and “hot-nebula” dust (, ) as a function of grain size at a distance of , from , and from .
| model | dust | bbThe porosity of the ice-coated porous aggregate (see Appendix B in Li & Lunine [2003]). | ccThe index of the power-law size distribution for the porous dust component: for (see Eq.[6]). | dd. The dust surface mass density can be written as with the mean dust mass where , for the “cold-coagulation” model; and , for the “hot-nebula” model (see Appendix B in Li & Lunine [2003]). | dd. The dust surface mass density can be written as with the mean dust mass where , for the “cold-coagulation” model; and , for the “hot-nebula” model (see Appendix B in Li & Lunine [2003]). | dd. The dust surface mass density can be written as with the mean dust mass where , for the “cold-coagulation” model; and , for the “hot-nebula” model (see Appendix B in Li & Lunine [2003]). | eeThe mid-plane surface density () at for the porous dust component (see Eq.[14]). | ffWe assume that the spatial distribution of the PAH component follows that of the inner warm porous dust (which is responsible for the 10.8 and 18.2 mid-IR emission observed by Fisher et al. [2000]; see Figure 3a and Eq.[13]) at (see §3.1.3). | ggThe vertical optical depth at and . The contribution to from the PAH component is negligible (see §3.2). | note | |||
|---|---|---|---|---|---|---|---|---|---|---|---|---|---|
| no. | type | (m) | () | () | () | () | () | () | |||||
| 1 | cold-coag. | 0.90 | 0.73 | 3.3 | 1.77 | 7.18 | 0.21 | 2.13 | 4.84 | 4.24 | 2.41 | 1.89 | preferred |
| 2 | hot-nebu. | 0.90 | 0.80 | 3.0 | 2.00 | 18.4 | 2.00 | 6.63 | 1.52 | 5.07 | 1.85 | 3.67 | |
| 3 | cold-coag. | 0.90 | 0.73 | 3.2 | 0.18 | 0.099 | 0.0027 | 2.52 | 430.5 | 4.29 | 2.18 | 2.27 | |
| 4 | cold-coag. | 0.90 | 0.73 | 3.6 | 16.2 | 426.5 | 9.65 | 1.66 | 0.081 | 5.51 | 2.21 | 1.72 | |
| 5 | cold-coag. | 0.90 | 0.73 | 3.3 | 1.77 | 7.18 | 0.21 | 3.01 | 4.66 | 4.32 | 2.32 | 1.70 | |
| 6 | cold-coag. | 0.95 | 0.87 | 3.2 | 1.83 | 9.26 | 0.44 | 1.73 | 3.89 | 4.28 | 2.38 | 2.00 | |
| 7 | cold-coag. | 0.80 | 0.46 | 3.5 | 1.67 | 4.95 | 0.049 | 1.38 | 6.58 | 4.22 | 2.21 | 2.13 | |
| 8 | cold-coag. | 0.90 | 0.73 | 3.3 | 1.77 | 7.18 | 0.21 | 2.13 | 4.84 | 4.45 | 2.41 | 2.34 | |
| 9 | cold-coag. | 0.90 | 0.73 | 3.3 | 1.77 | 7.18 | 0.21 | 2.13 | 4.84 | 6.19 | 2.41 | 4.97 | |
| 10 | cold-coag. | 0.90 | 0.73 | 3.3 | 1.77 | 7.18 | 0.21 | 2.13 | 4.84 | 9.95 | 2.41 | 24.4 | |
| 11 | cold-coag. | 0.90 | 0.73 | 3.3 | 1.77 | 7.18 | 0.21 | 2.13 | 4.84 | 4.47 | 2.41 | 2.02 |
4 Discussion
The narrow, ring-like structure was originally suggested by Sylvester & Skinner (1996) for the disk in modeling the IRAS data (plus the JCMT upper limit at ). However, their best-fitting models required a huge inner cavity with a radius of . On the other hand, it was shown by Malfait, Bogaret, & Waelkens (1998) that a flat, conventional disk extending from to with a power-law index of for the dust spatial distribution was also able to fit the IRAS data.
Malfait et al. (1998) modelled the IRAS data in terms of dust with a hypothetical opacity law of and a hypothetical radial-dependent temperature of . Their inferred dust spatial distribution of with is inconsistent with the current view of a central void at (e.g. Marsh et al. 2002; Mouillet et al. 2001). In the work of Sylvester & Skinner (1996), the dust in the disk was modelled either as a mixture of two separate components (amorphous silicate and amorphous carbon) or as a single pure amorphous carbon component. The dust was taken to be compact spheres with a power-law size distribution of in the size range of . The variation of dust density within the disk with distance from the star was also treated as a power-law. Their model did not treat the PAH emission bands. It is therefore not surprising that their model spectrum was deficient at .
Using the OSCIR/KeckII 10.8 and 18.2 flux ratio, Fisher et al. (2000) placed an upper limit of on the radius of the dust grains responsible for the mid-IR emission at both wavelengths if they are made of compact silicate spheres. Since this conclusion was drawn from the assumption that the dust is located at a distance of 20 from the star, a wide range of grain sizes may be allowed if the mid-IR emitting dust is wide spread within (see Eq.[13]).
In contrast, a lower limit of was derived by Boccaletti et al. (2003) for grains with a porosity of , assuming that the slight surface brightness difference between their ground-based 2.2 imaging data and the HST NICMOS data at 1.1 (Weinberger et al. 1999) and 1.6 (Augereau et al. 1999a) is caused by the color effect of the grains. A grain size distribution steeper than was also inferred from such an analysis. However, these conclusions are very sensitive to the scaling factor between the target star and the calibrator star which is uncertain. Once the scaling factor uncertainty is included in their analysis, a much wider range of grain sizes is allowed.
In comparison with the narrow, sharply bounded disk (Schneider et al. 1999), the dust annulus around is about 9–10 times wider and displays a more complex ring-gap-ring morphology (Augereau et al. 1999a; Weinberger et al. 1999; Clampin et al. 2003). In addition, for the disk, there is clear evidence for the existence of a warm dust population at inward of the inner ring (Marsh et al. 2002). While a warm “zodiacal” dust component at a radial distance of a few AU from was invoked by Koerner et al. (1998) and Augereau et al. (1999b) to account for the emission at , it was shown later by Li & Lunine (2003) that the porous dust model naturally explains the entire dust emission including that at and therefore, there does not seem to be any strong evidences for a “zodiacal” dust component in the inner disk of . Very recently, Marsh et al. (2002) found that the radial optical depth profile of the disk at appears to increase inside of at a level. Does this indicate the existence of a “zodiacal” dust component in the disk? SIRTF imaging at the 3.6, 4.5, and 5.8 IRAC bands (see Table 3 and §4.4) may be able to address this question since the “zodiacal” dust may also reveal its existence by emitting at the IRAC bands. It is interesting to note that the M band (4.77) photometry does appear to show a small excess over the stellar photosphere (see Figure 1a). But the uncertainties both in the photometric flux determination and in the Kurucz model atmosphere representation prevent a definite conclusion.
The time for complete sublimation of the ice mantles coated on the individual tenth-micron subgrains of a porous aggregate of temperature (see Figure 6) is (Backman & Paresce 1993) where is the ice mantle thickness. By integrating over the dust size distribution , we estimate the mean sublimation time scales to be respectively for the best-fit “cold-coagulation” dust at a distance of , from , and from . If PAHs in dust disks indeed originate from the sublimation of icy mantles, we expect to see PAHs in the inner warm region of the disk () where , but not in the ring regions of the () and disks () where .
The 3.3, 6.2, 7.7, 8.6 and 11.3 vibrational bands diagnostic of PAH molecules are not seen in the disk. As mentioned above, this is mainly because in the ring region, the sublimation of icy mantles which ejects PAHs is too slow (). Even if PAHs are produced by mechanisms other than sublimation (e.g. shattering of carbonaceous grains), the recondensation of PAHs in the icy mantles of the porous dust component occurs on a time scale of a few thousand years, much shorter than the age of the system: where is the gas temperature; is the average mass of the PAH molecules with a size distribution like that of the disk (i.e., and ; see §3.2); is the vertical scale height (Kenyon et al. 1999); (Li & Lunine 2003) and are respectively the mid-plane surface density and volume density of the porous dust component at ; (Li & Lunine 2003) is the total grain surface areas integrated over the size distribution with (see Table 1 [model no. 2] in Li & Lunine 2003). Similarly, the time scale for the accretion of PAHs on grains at from the disk is about , shorter than the age of the system. Therefore, free-flying PAH molecules are unlikely to exist in the ring regions of the and disks.
To summarize, the respective presence and absence of free-flying PAHs in the and disks can be attributed to the structural differences between these two disks. It is worth noting that the Pictoris disk, modelled best as a wedge-shaped disk with a constant opening angle (Artymowicz, Burrows, & Paresce 1989, Backman, Gillett, & Witteborn 1992), is more like the disk than the disk does in the sense that the Pictoris disk also extends to the inner warm region where the sublimation of icy mantles occurs. However, the existing mid-IR spectra of the Pictoris disk do not appear to show any evidence of PAHs (Telesco & Knacke 1991, Knacke et al. 1993, Pantin, Waelkens, & Malfait 1999, Weinberger, Becklin, & Zuckerman 2003). It is not clear whether the absence of PAHs in the Pictoris disk is due to its evolutionary status or just because the PAH emission features are swamped by the strong 9.7 and 11.3 silicate bands. With an age of (Barrado y Navascués et al. 1999, Zuckerman et al. 2001), the Pictoris disk is more evolved than the disk. SIRTF spectroscopy of Pictoris at will allow us to draw a more definite conclusion regarding the presence or absence of PAHs in the inner disk of Pictoris.
The presence of transiently heated PAH molecules in the dusty environments of Herbig Ae/Be stars has been observationally well established (see e.g. Whittet et al. 1983; Brooke, Tokunaga, & Strom 1993; Sylvester et al. 1996; Siebenmorgen et al. 2000). Natta & Krügel (1995) have calculated the mid-IR emission spectra expected for PAHs around Herbig Ae/Be stars, assuming a spherical shell geometry for the dust distribution. Sylvester, Skinner, & Barlow (1997) have modelled the SEDs of 8 Vega-like dust disks with temperature-fluctuating small silicate and amorphous carbon grains of and included. So far, however, little has been done in modeling the PAH component in the disk. This work actually represents the first successful modeling of its entire SED, including the PAH emission features.
4.1 Robustness
The dust model presented here is fully described by 10 parameters: (1) , , , and for the PAH component; (2) , , , and for the porous dust component; (3) and for the dust spatial distribution . But, as discussed in §3.1.5, we actually have only 3 free parameters: , , and .
Other parameters have been constrained by rather general considerations: (1) we take , the radius of the smallest survival interstellar PAH molecule (§3.1.1); (2) we take since PAHs in the disk are expected to be negatively charged (§3.1.4); (3) we take since this is the smallest size that makes sense in the framework of interstellar dust aggregation (see Footnote-5); (4) we take ; this size is not well constrained but neither is it crucial, since grains larger than emit like blackbodies and their IR emission spectra are size-insensitive (see Figure 6); (5) we take since dust of such a high porosity reproduces the SEDs of the Pictoris disk and the disk; a porosity of is expected for fluffy aggregates formed by the accumulation of interstellar dust and is also consistent with the low density nature of cometary nuclei (§3.1.5); (6) we take to be the radial distance where the refractory dust starts to evaporate (§3.1.3); (7) we take which is expected from disk truncation caused by the tidal effects of (Footnote-8). The dust spatial distribution is taken to be that derived from the near-IR imaging of scattered starlight and mid-IR imaging of dust thermal emission (Eqs.[13-15] and §3.1.3).
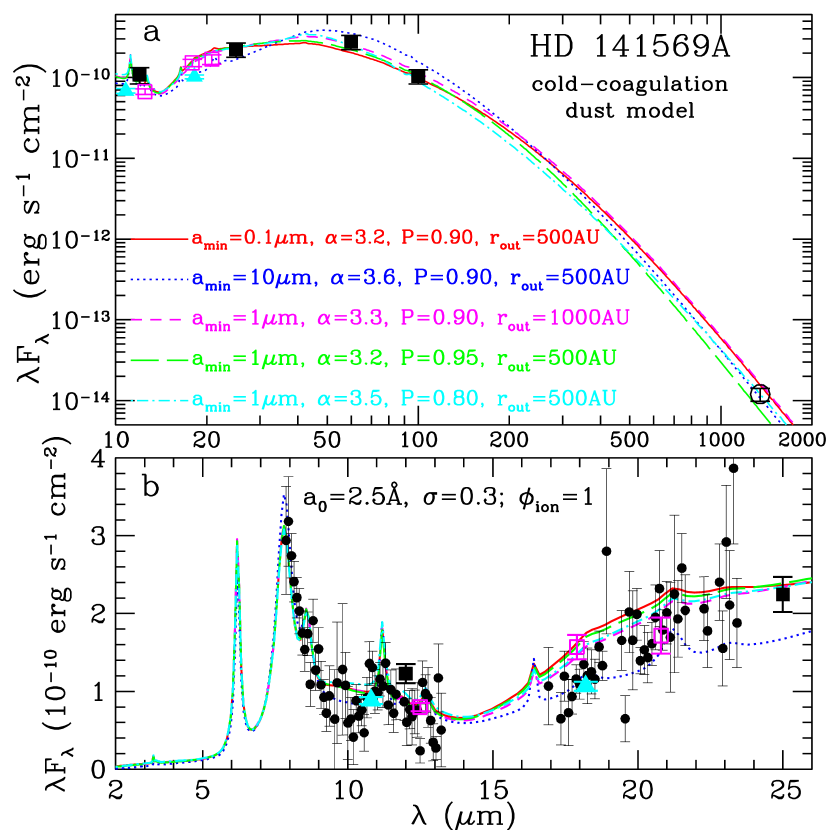
To be complete, we have also considered models with parameters differing from the nominal ones described above. In the following, except the specifically stated parameters, all other parameters remain the same as those of the canonical “cold-coagulation” model derived in §3.2 (model no. 1; see Figure 3). See Table 2 for all the key parameters.
- •
-
•
The model (no. 4; ; Figure 7; blue dotted line) — emits too much at the IRAS 60 and 100 bands, and too little at the MIRLIN/KeckII 17.9, 20.8 bands and the IRAS 25 band.
- •
- •
- •
In summary, although the canonical “cold-coagulation” dust model presented in §3.2 is preferred, some flexibilities are allowed in modeling the SED; i.e., no fine tuning is needed in order for our models to achieve an excellent fit to the observed entire SED. Therefore, the porous dust model made of interstellar materials, previously shown successful in reproducing the SEDs of the dust disks around Pictoris and , is also robust in modeling the IR emission from the disk.
We have also tried to fit the observed SED using the interstellar PAH size distribution, characterized by and (Li & Draine 2001a). As shown in Figure 8a, the model spectrum predicted from the interstellar mixture of PAH cations (model no. 8) is also in an excellent agreement with the observed mid-IR spectrum. In comparison with the canonical best-fit mixture ( and ; model no. 1; see Figure 3), the interstellar mixture, rich in relatively large PAHs (see Figure 9), emits a little bit more (less) at wavelengths longward (shortward) of . This is because large PAHs do not reach temperatures as high as do small PAHs when heated by energetic photons.
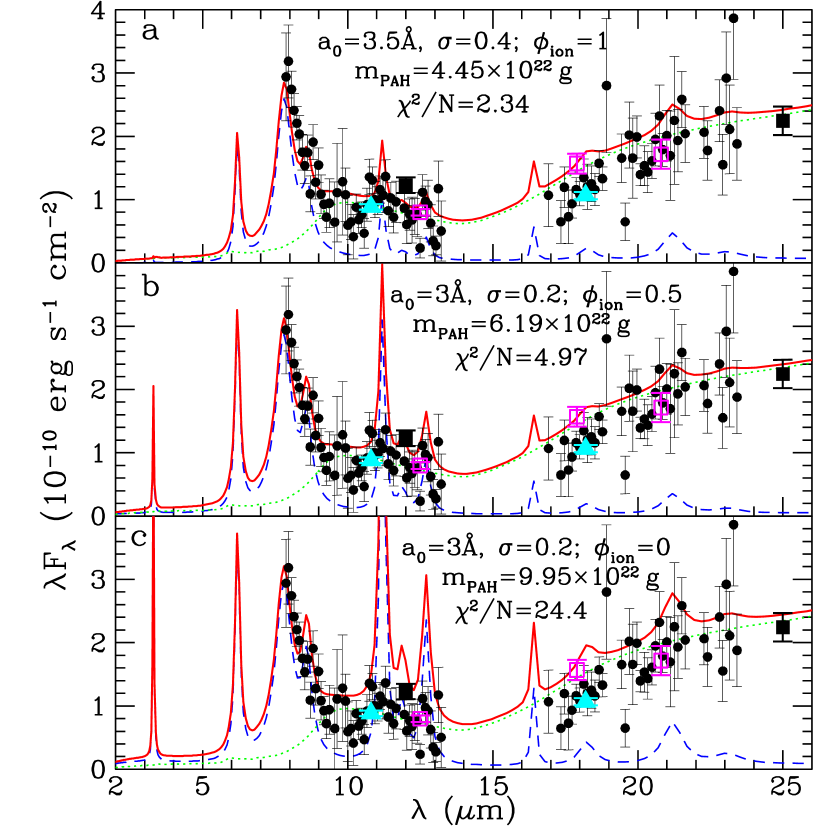
So far, all models assume . We now consider models containing neutral PAHs. For illustration, two models are considered: a model with a mixture of both neutral and ionized PAHs (; model no. 9), and a model only consisting of pure neutral PAHs (; model no. 10). In Figure 8b and 8c we respectively show the best-fit model spectra calculated from the model and from the neutral PAH model. The PAH component of both dust models has a size distribution of and (see Figure 9). Again, other parameters (see Table 2) are the same as those of the canonical “cold-coagulation” model (no. 1). An inspection of Figure 8c would immediately lead us to rule out the neutral PAH model since this model produces too strong an 11.3 feature (as well as a 12.7 feature) to reconcile with the CGS3 spectrum of Sylvester et al. (1996). The fit to the CGS3 spectrum by the model is acceptable except that it also appears to emit a bit too much in the 11.3 band, although the quality of the CGS3 spectrum is inadequate to disprove this model. Note that the model-predicted 11.3 feature is much sharper than the observed one since we adopt the mean interstellar PAH bandwidths (see Table 7 of Li & Draine 2001a). As a matter of fact, the integrated flux in the calculated 11.3 feature is comparable to the observed. The determination of the band strength of the 11.3 feature is also complicated by its adjacent continuum. In our dust model, the warm porous dust in the inner region () dominates the continuum underneath the 11.3 feature. Future observational studies (e.g. SIRTF) will provide more information on . But at this moment, it is safe to state that a large fraction of the PAH molecules responsible for the observed mid-IR spectrum in the disk must be ionized.
4.2 PAH Destruction
Upon absorption of an energetic photon, small PAHs, with an insufficient number of internal vibrational modes in which to distribute this photon energy, may be dissociated by ejection of a hydrogen atom, a hydrogen molecule, and/or an acetylene molecule (C2H2). See §A for a detailed discussion of this photoprocess. Following the method described in §A, we have calculated the photodestruction rates () for small PAHs exposed to stellar UV photons in the disk, represented by the photoejection rates of an acetylene molecule. In Figure 10 we show the PAH destruction time scales () for PAHs at as a function of PAH size. Apparently, PAHs smaller than at are photolytically unstable: they are expected to be photodestroyed in a timescale shorter than the lifetime of the system. Larger PAHs are more stable since they have a larger number of vibrational modes so that they can easily accommodate the absorbed photon energy and it is therefore less likely for photodissociation to occur.
In order to maintain a stable distribution of small PAHs in the inner region () of the disk, there must exist a source continuously replenishing the small PAHs at a rate of
| (19) |
where the PAH surface density distribution, , is taken to be the same as that of the inner warm porous dust (; see §3.1.3 and Eq.[13])
| (20) |
where is the PAH mid-plane surface density at . For the canonical “cold-coagulation” dust model (no. 1; §3.2; Figure 3) with , , , and , we arrive at ! However, the PAH photodestruction time scales derived above may have been substantially underestimated for two reasons: (1) the photoejection of an acetylene molecule is not equivalent to the complete destruction of a PAH molecule; (2) PAHs can be repaired by accreting carbon atoms and/or ions from the gas (e.g. see Allain et al. 1996); the presence of carbon ions in the disk was revealed by the detection of the [CII] 158 emission (see Lorenzetti et al. 2002). Therefore, it is very likely that the required PAH replenishment rate estimated above has been considerably overestimated.
But even if we assume that the above derived PAH mass loss rate due to photodestruction is valid and there is insufficient replenishment implying that there will be no PAHs smaller than , our model with is still able to reproduce the observed SED. This is demonstrated in Figure 11 for the “cold-coagulation” dust model with (model no. 11). Therefore, the exact knowledge of the PAH lower-cutoff size is not critical in modeling the SED.
4.3 Radiation Pressure and Poynting-Robertson Drag
In addition to the gravitational attraction from the central star, grains in the disk are subject to (1) radiative outward propulsion as a consequence of momentum transfer from stellar photons, and (2) Poynting-Robertson drag which causes them to spiral toward the gravitational force center as a consequence of angular momentum loss through radiation (Burns, Lamy, & Soter 1979; Backman & Paresce 1993; Krügel 2003).
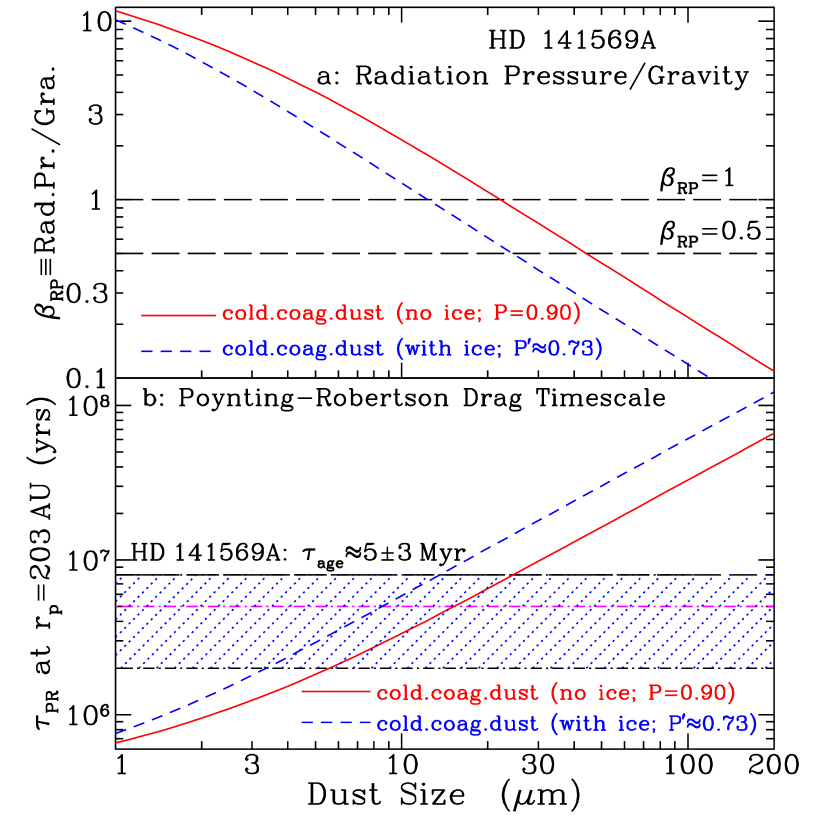
The ratio of the radiative force to the gravitational force is
| (21) |
where is the gravitational constant, () is the stellar mass, is the scattering cross section for a grain of size at wavelength , (“asymmetry factor”) is the average value of the cosine of the scattering angle.
We have calculated as a function of dust size for the best-fit canonical “cold-coagulation” dust model (no. 1; see Figure 3 and §3.2). As shown in Figure 12a, for grains smaller than , the radiation pressure (RP) overcomes the gravitational attraction (i.e. ) and, therefore, these grains will be blown out from the disk. But we note that a stable distribution of small grains () in the disk is possible provided that they are continuously replenished by collisions of larger bodies and/or larger grains so that at any time the disk contains a substantial population of small particles (see Krivov, Mann, & Krivova 2000).
The dust removal rate due to the radiation pressure (RP) expulsion can be estimated from
| (22) |
| (23) |
where , the RP timescale, is assumed to be comparable to the local dynamical timescale where is the Keplerian frequency. For the best-fit canonical “cold-coagulation” model (no. 1; see Figure 3 and §3.2), the RP dust mass loss rate is .
We have also calculated the Poynting-Robertson (PR) drag timescale (the time it takes for a grain of size at a distance of to fall into the central star) from
| (24) |
In Figure 12b we show that, for grains smaller than at a radial distance of , the lifetime associated with the PR drag is shorter than the age and hence, these grains will fall into the central star even if they are not ejected by radiation pressure. For the inner warm dust component at , grains in the range of , although stable against radiation pressure ejection, will be removed from the disk by the PR drag. Since the best-fit “cold-coagulation” model (no. 1) has of the total surface areas in grains smaller than , these grains must be efficiently replenished by cascade collisions of planetesimals and larger grains. By integrating the PR dust removal rate over the whole size range and over the entire disk, we estimate the PR dust mass loss rate to be for the best-fit canonical “cold-coagulation” model (no. 1). Therefore, over the life span of , roughly of dust is lost by radiation pressure and Poynting-Robertson drag.
For the PAH component, the ratio of radiation pressure to gravity is almost independent of size. This is because PAHs are in the Rayleigh limit at UV/visible wavelengths where the absorption of stellar photons is such that and (Bohren & Huffman 1983; Krügel 2003). The PR time scale for PAHs at is about 6000, also independent of size for the same reason. The PAH mass loss rates due to radiation pressure and Poynting-Robertson drag are and , respectively. This implies that a total amount of of PAH molecules needs to be replenished over the life span of .
4.4 Predictions for SIRTF
The Space Infrared Telescope Facility (SIRTF) will be capable of sensitive imaging using the Infrared Array Camera (IRAC) at 3.6, 4.5, 5.8, and 8.0, and using the Multiband Imaging Photometer (MIPS) at 24, 70, and 160. In Table 3 we show the band-averaged intensities for our preferred dust models.
SIRTF will also be able to perform low-resolution 5–40 and high-resolution 10–37 spectroscopic observations using the Infrared Spectrograph (IRS) instrument. IR spectroscopy and imaging will provide powerful constraints on the dust spatial distribution and its chemical composition.
Our best-fit canonical “cold-coagulation” dust model (no. 1; Figure 3) predicts strong PAH C-C stretching features at 6.6 and 7.7, a weak in-plane C-H bending feature at 8.6, a weak out-of-plane C-H bending feature at 11.3, a very weak C-H stretching feature at 3.3, very weak out-of-plane C-H bending features at 11.9 and 12.7, and very weak C-C bending features at 16.4, 18.3, 21.2 and 23.1 (see Li & Draine 2001a for details). With neutral PAHs included (e.g., see Figure 8b for the model [no. 9] which is not ruled out in the present study), stronger 3.3 and 11.3 features are expected. SIRTF spectroscopy at will provide an important test of the PAH model with respect to the PAH size distribution, charging, and survival in the disk.
The “cold-coagulation” dust model (no. 1) produces a broad, smooth amorphous silicate feature at 9.7 which forms a plateau underneath the 11.3 PAH feature (see Figure 3 and §3.2). In contrast, the “hot-nebula” dust model (no. 2; see Figure 4 and §3.2) predicts two crystalline silicate features at 11.3 and 23. While the 11.3 feature is swamped by the PAH C-H out-of-plane bending mode which is also at 11.3, the 21 feature is prominent and the CGS3 mid-IR spectrum readily places an upper limit of about 10% on crystalline silicate dust (see Figure 5 and §3.2). With high resolution spectroscopy, SIRTF will allow us to perform more detailed studies of the silicate emission features so as to infer the degree of processing which the dust has experienced.
| model | IRAC | IRAC | IRAC | IRAC | MIPS | MIPS | MIPS |
|---|---|---|---|---|---|---|---|
| no. | 3.6 | 4.5 | 5.8 | 8.0 | 24 | 70 | 160 |
| 1 | 0.011 | 0.018 | 0.12 | 0.41 | 1.86 | 4.45 | 2.27 |
| 8 | 0.0098 | 0.015 | 0.090 | 0.38 | 1.94 | 4.57 | 2.37 |
| 9 | 0.034 | 0.023 | 0.14 | 0.43 | 1.91 | 4.52 | 2.32 |
| 11 | 0.0098 | 0.016 | 0.10 | 0.40 | 1.91 | 4.55 | 2.35 |
5 Conclusion
We have modelled the mid-infrared to submillimeter spectral energy distribution of the double-ring disk around in terms of the porous dust model previously shown successful in reproducing the SEDs observed for the disks around Pictoris (Li & Greenberg 1998) and (Li & Lunine 2003). The dust is modelled as porous aggregates of either unaltered or heavily processed interstellar materials. While the former (“cold-coagulation” dust) is made of amorphous silicate dust, carbonaceous dust, H2O-dominated ices, and vacuum, the latter (“hot-nebula” dust) consists of a mixture of crystalline silicates, ices, and vacuum (§3.1). For both dust types, a vacuum volume fraction of 90% is assumed (§3.1.5). The dust spatial distribution is taken to be that derived from imaging observations of scattered light and dust thermal emission (Eqs.[13-15]; §3.1.3). We take a simple power-law for the dust size distribution () in the size range of . In addition, a population of PAH molecules with a log-normal size distribution characterized by a peak-parameter and a width-parameter of is invoked to account for the observed 7.7 and 11.3 “unidentified infrared” emission features that are generally attributed to PAHs. Our principal results are:
- 1.
-
2.
Although the “hot-nebula” dust model provides an overall good fit to the observed SED, it predicts a strong crystalline silicate emission feature at which is not seen in the currently available observational spectrum (§3.2; Figure 4). This places an upper limit of on the fraction of “hot-nebula” dust (i.e. crystalline silicates; §3.2; Figure 5).
-
3.
The PAH molecules in the disk are expected to be negatively charged (Figure 2; §3.1.4; §A), assuming that the cosmic ray ionization of H2 is the dominant source of electrons (§B). But it has also been shown that models consisting of a mixture of both neutral and charged PAHs are also capable of reproducing the observed PAH IR emission features, provided that the fraction of neutral PAHs is smaller than 50% (Figure 8; §4.1).
-
4.
Approximating the photodestruction rate of a PAH molecule by the photoejection rate of an acetylene molecule, PAHs smaller than will be photodestroyed in a time scale shorter than the age of the system (Figure 10; §4.2; §A). In order to have a stable distribution of small PAHs () in the disk, we require a continuous replenishment of this component at a rate of . Such a high replenishment rate may not be essential, since (1) the photoejection of a C2H2 molecule does not necessarily lead to the complete destruction of a PAH molecule, and (2) the repair of a PAH molecule with a broken C-C bond through reacting with gas-phase C atoms and/ions is ignored in deriving the PAH destruction time scale. Furthermore, we have shown in §4.2 (Figure 11) that a model exclusively consisting of PAHs larger than also achieves a good fit to the observed SED.
-
5.
Grains smaller than will be radiatively expelled from the disk; grains at in the size range of will also be removed from the disk due to the Poynting-Robertson inward spiralling drag (at a closer [further] distance from the star, larger [smaller] grains will be removed). Collisions of planetesimals must continuously replenish the dust in the disk at a rate of (§4.3). PAHs will also be rapidly removed from the disk by radiation pressure and, to a less degree, by Poynting-Robertson drag. A replenishment rate of is needed to maintain the PAH disk (§4.3).
-
6.
Spectroscopic and broadband photometric predictions are made for SIRTF observations (§4.4).
Appendix A Photophysics of Polycyclic Aromatic Hydrocarbon Molecules in the HD 141569A Disk
Following the absorption of an energetic photon, a PAH molecule has 3 major competing decay channels to relax its energy: emission;141414The emission process is dominated by fluorescence (transitions between vibrational states of same multiplicity) in the IR and part in the visible. Phosphorescence (transitions between vibrational states of different multiplicity) is less important. In this work we will thus only consider IR emission via fluorescence. ionization; and photodissociation. The photodissociation process, critical for small PAHs, has 3 major loss channels: the loss of a hydrogen atom, a hydrogen molecule, and an acetylene molecule (C2H2).
We use the Rice, Ramsperger, and Kassel (RKK) theory (Forst 1973) for the photodissociation rate for a PAH molecule of internal energy after excitation
| (A1) | |||||
where is the number of atoms in the molecule; is the activation energy for the loss of the species- () related to bond dissociation (i.e., the minimum energy required for the dissociation to occur); is the frequency factor for the -loss channel which reflects the efficiency of intramolecular redistribution of the energy over the vibrational levels of the molecule’s ground electronic state after internal conversion. In Table 4 we tabulate the and parameters for the loss of H, H2 and C2H2 experimentally obtained by Jochims et al. (1994) for small PAHs.
| loss channel | ||
|---|---|---|
| x | (eV) | (s-1) |
| H | 2.8 | |
| H2 | 2.9 | |
| C2H2 | 2.9 |
The IR photon emission rate for a PAH molecule of internal energy is
| (A2) |
where the vibrational temperature is obtained from the vibrational energy using the Debye-model approximation for the PAH enthalpy (see Eq.[15] in Li & Draine 2001).
Assuming that IR emission, ionization, and dissociation are the only relaxation processes for a PAH molecule excited by an energetic photon, the photodestruction rate (approximated by the ejection of an acetylene molecule) , and the dehydrogenation rate for PAHs at a distance of from the central star can be obtained from following equations151515For simplicity, we assume that the absorbed photon will either ionize the neutral PAH molecule or participate in the photodissociation and vibrational relaxation.
| (A3) |
| (A4) |
Following Allain, Leach, & Sedlmayr (1996), we adopt an analytical formula for the ionization yield which was based on the experimental data of pyrene and coronene (Verstraete et al. 1990)
| (A5) | |||||
where and (ionization threshold) are in units of . We adopt a simple expression for the ionization threshold (see Eq.[2] in Weingartner & Draine 2001 for ),
| (A6) |
where the PAH radius is in unit of angstrom. The photoionization rate for a PAH molecule located at a distance of from the central star is
| (A7) |
The electronic recombination rate for a PAH cation is
| (A8) |
where is the electron density; is the electron thermal velocity; is the electron mass; is the electron charge; is the PAH electrostatic potential; is the Boltzmann constant; is the gas temperature. We will take for the disk. In Eq.(A8) we have assumed that the sticking probability for recombination of an electron on the PAH cation equals one. The term accounts for the “Coulomb focussing” effect (Spitzer 1941).
Appendix B Electron Density in the HD 141569A Disk
Molecular CO gas in the disk has been detected in emission through its rotational transitions at submillimeter wavelengths (Zuckerman, Forveille, & Kastner 1995) and through its ro-vibrational transitions at near-IR (Brittain & Rettig 2002; Brittain et al. 2003). Brittain & Rettig (2002) also reported the detection of emission in the disk. In principle, one can estimate the electron density from the and CO measurements based on the following assumptions – (1) is produced mainly through the cosmic ray (CR) ionization of to : and the ion-neutral reaction: ; (2) is destroyed primarily by its recombination with an electron: and by the ion-neutral reaction with CO: (McCall et al. 1998). Let , , , and be the number densities of electrons, , CO, and , respectively; be the cosmic ionization rate; and be the rate constants for the -electron recombination and the -CO reaction, respectively. One can derive the electron density from
| (B1) |
Brittain & Rettig (2002) estimated the column densities of CO and respectively to be and from the CO and emission spectra obtained for the disk with the NASA Infrared Telescope (IRTF) using the Cryogenic Echelle Spectrograph (CSHELL).161616This assumes that both CO and are contained in the region around . With , , (see McCall et al. 1998 and references therein), and the nominal (Thi et al. 2001), one finds from Eq.(B1)! This suggests that CO and may be distributed in different regions. Brittain & Rettig (2002) suggest that may originate from the extended envelope of a gas giant protoplanet at .
Therefore, it is not appropriate to derive from the data; instead, we will place an upper limit on from assuming that the cosmic ray ionization of is the major source of electrons: where is the stellar age.171717Atomic gas has also been seen in the disk. A double-peaked H emission was detected by Andrillat, Jaschek, & Jaschek (1990) and Dunkin, Barlow, & Ryan (1997), indicating a rotating gas disk close to the star. Dunkin et al. (1997) also detected circumstellar NaI and CaII absorption lines. Recently, Lorenzetti et al. (2002) reported the detection of C+ gas. However, little is known regarding the atomic gas column density and its contribution to the electrons in the disk. Since it is shown in §3.1.4 that the amount of electrons provided by alone is sufficient to (negatively) charge the PAH molecules in the disk, inclusion of electrons from the cosmic ray ionization of atomic gas would further support our conclusion (i.e., a large fraction of the PAH molecules are [see §3.1.4 and Figure 2] and must be [see §4.1 and Figure 8] charged in the disk). Furthermore, an additional amount of electrons would be provided by the X-ray ionization of . Below we will discuss how the number density of molecular hydrogen is obtained.
Assuming that the disk is in vertical hydrostatic equilibrium, the spatial distribution of molecular hydrogen is
| (B2) |
| (B3) |
where is the surface density of ; the vertical scale height is
| (B4) |
where is the stellar mass, is the mass of a hydrogen atom, is the mean molecular weight ( for a mixture of and He). The total molecular hydrogen mass in the region around was estimated to be based on the IRAM (Institut de Radio-Astronomie Millimetrique) observations of the and rotational transitions of CO (Zuckerman et al. 1995).181818Zuckerman et al. (1995) originally gave . But this was derived from the assumption that the distance from to the Earth is . Adopting (van den Ancker et al. 1998), should be reduced by a factor of . More recently, Brittain & Rettig (2002) found that the CO gas, pumped by strong stellar UV radiation, is confined to the region with a total mass of . Assuming the standard ratio of to CO (about ), this leads to a total mass of .
The mass inferred by Brittain & Rettig (2002) differs by a factor of from that of Zuckerman, Forveille, & Kastner (1995). This is because the UV-pumped CO detected by Brittain & Rettig (2002) only represents material near the star/disk interface and is not indicative of the total gas mass. The UV radiation is quickly scattered by dust and may be influential for only a small annulus of the disk. Submillimeter measurements of CO can measure the cold regions inward of (Zuckerman et al. 1995), where most of the cold CO molecules are in the ground vibrational state to which the near-IR observations are not sensitive (Brittain et al. 2003; T.W. Rettig, private communication). Therefore, we will adopt the Zuckerman et al. (1995) results for the mass.
We assume that in the region, the spatial distribution of follows that of the dust (see Eq.[13]), i.e.,
| (B5) |
where is the mid-plane surface density of at which can be derived from (; Zuckerman et al. 1995)
| (B6) |
References
- (1) Allain, T., Leach, S., & Sedlmayr, E. 1996, A&A, 305, 602
- (2) Allamandola, L.J., Tielens, A.G.G.M., & Barker, J.R. 1985, ApJ, 290, L25
- (3) Andrillat, Y., Jaschek, M., & Jaschek, C. 1990, A&A, 233, 474
- (4) Artymowicz, P., & Lubow, S.H. 1994, ApJ, 421, 651
- (5) Artymowicz, P., Burrows, C., & Paresce, F. 1989, ApJ, 337, 494
- (6) Augereau, J.C., Lagrange, A.M., Mouillet, D., & Ménard, F. 1999a, A&A, 350, L51
- (7) Augereau, J.C., Lagrange, A.M., Mouillet, D., Papaloizou, J.C.B., & Gorod, P.A. 1999b, A&A, 348, 557
- (8) Backman, D.E., & Paresce, F. 1993, in Protostars and Planets III, ed. E.H. Levy & J.I. Lunine (Tucson: Univ. Arizona Press), 1253
- (9) Backman, D.E., Gillett, F.C., & Witteborn, F.C. 1992, ApJ, 385, 680
- (10) Barrado y Navascués, D., Stauffer, J.R., Hartmann, L., & Balachandran, S.C. 1997, ApJ, 475, 313
- (11) Barrado y Navascués, D., Stauffer, J.R., Song, I., & Caillault, J.-P. 1999, ApJ, 520, L123
- (12) Bauschlicher, C., & Bakes, E.L.O. 2000, Chem. Phys., 262, 285
- (13) Beckwith, S.V.W., Henning, Th., & Nakagawa, Y. 2000, in Protostars and Planets IV, ed. V. Mannings, A.P. Boss, & S.S. Russell (Tucson: Univ. Arizona Press), 533
- (14) Boccaletti, A., Augereau, J.C., Marchis, F., & Hahn, J. 2003, ApJ, 585, 494
- (15) Bohren, C.F., & Huffman, D.R. 1983, Absorption and Scattering of Light by Small Particles (New York: Wiley)
- (16) Brittain, S.D., & Rettig, T.W. 2002, Nature, 418, 57
- (17) Brittain, S.D., Rettig, T.W., Simon, T., Kulesa, C., DiSanti, M.A., & Dello Russo, N. 2003, ApJ, 588, 535
- (18) Brooke, T.Y., Tokunaga, A.T., & Strom, S.E. 1993, AJ, 106, 656
- (19) Burns, J.A., Lamy, P.L., & Soter, S. 1979, Icarus, 40, 1
- (20) Cameron, A.G.W. 1975, Icarus, 24, 128
- (21) Cameron, A.G.W. 1995, Meteoritics, 30, 133
- (22) Cameron, A.G.W., & Schneck, P.B. 1965, Icarus, 4, 396
- (23) Clampin, M., et al. 2003, AJ, in press
- (24) Draine, B.T., & Lee, H.M. 1984, ApJ, 285, 89
- (25) Draine, B.T., & Li, A. 2001, ApJ, 551, 807
- (26) Dunkin, S.K, Barlow, M.J., & Ryan, S.G. 1997, MNRAS, 286, 604
- (27) Fisher, R.S., Telesco, C.M., Piña, R.K., Knacke, R.F., & Wyatt, M.C. 2000, ApJ, 532, L141
- (28) Forst, W. 1973, Theory of Unimolecular Reactions (New York: Academic)
- (29) Greaves, J.S., et al. 1998, ApJ, 506, L133
- (30) Greenberg, J.M. 1968, in Stars and Stellar Systems, Vol. VII, ed. B.M. Middlehurst & L.H. Aller (Chicago: Univ. of Chicago Press), 221
- (31) Greenberg, J.M., & Li, A. 1999, Space Sci. Rev., 90, 149
- (32) de Grijp, M.H.K., Miley, G.K., & Lub, J. 1987, A&AS, 70, 95
- (33) Habing, H.J., et al. 2001, A&A, 365, 545
- (34) Henry, T.J., Soderblom, D.R., Donahue, R.A., & Baliunas, S.L. 1996, AJ, 111, 439
- (35) Holland, W.S., et al. 1998, Nature, 392, 788
- (36) Holland, W.S., et al. 2003, ApJ, 582, 1141
- (37) Hudgins, D.M., Bauschlicher, C.W., Allamandola, L.J., & Fetzer, J.C. 2000, J. Phys. Chem., 104, 3655
- (38) Jaschek, M., Jaschek, C., & Egret, D. 1986, A&A, 158, 325
- (39) Jayawardhana, R., Fisher, R.S., Hartmann, L., Telesco, C.M., Piña, R.K., & Fazio, G. 1998, ApJ, 503, L79
- (40) Jochims, H.W., Rühl, E., Baumgärtel, H., Tobita, S., & Leach, S. 1994, ApJ, 420, 307
- (41) Jura, M., Malkan, M., White, R., Telesco, C.M., Piña, R.K., & Fisher, R.S. 1998, ApJ, 505, 897
- (42) Kenyon, S.J., Wood, K., Whitney, B.A., & Wolff, M.J. 1999, ApJ, 524, L119
- (43) Knacke, R.F., Fajardo-Acosta, S.B., Telesco, C.M., Hackwell, J.A., Lynch, D.K., & Russell, R.W. 1993, ApJ, 418, 440
- (44) Koerner, D.W., Ressler, M.E., Werner, M.W., & Backman, D.E. 1998, ApJ, 503, L83
- (45) Krivov, A.V., Mann, I., & Krivova, N.A. 2000, A&A, 362, 1127
- (46) Krügel, E. 2003, Physics of Interstellar Dust (Bristol: IoP)
- (47) Kurucz, R.L. 1979, ApJS, 40, 1
- (48) Lagrange, A.-M., Backman, D.E., & Artymowicz, P. 2000, in Protostars and Planets IV, ed. V. Mannings, A.P. Boss, & S.S. Russell (Tucson: Univ. Arizona Press), 639
- (49) Langhoff, S.R. 1996, J. Phys. Chem., 100, 2819
- (50) Léger, A., & Puget, J.L. 1984, A&A, 137, L5
- (51) Li, A., & Draine, B.T. 2001a, ApJ, 554, 778
- (52) Li, A., & Draine, B.T. 2001b, ApJ, 550, L213
- (53) Li, A., & Draine, B.T. 2002a, ApJ, 572, 232
- (54) Li, A., & Draine, B.T. 2002b, ApJ, 576, 762
- (55) Li, A., & Greenberg, J.M. 1997, A&A, 323, 566
- (56) Li, A., & Greenberg, J.M. 1998, A&A, 331, 291
- (57) Li, A., & Lunine, J.I. 2003, ApJ, 590, 368
- (58) Lorenzetti, D., Giannini, T., Nisini, B., Benedettini, M., Elia, D., Campeggio, L., & Strafella, F. 2002, A&A, 395, 637
- (59) Malfait, K., Bogaret, E., & Waelkens, C. 1998, A&A, 331, 211
- (60) Marsh, K.A., Silverstone, M.D., Becklin, E.E., Koerner, D.W., Werner, M.W., Weinberger, A.J., & Ressler, M.E. 2002 ApJ, 573, 425
- (61) Mathis, J.S., Mezger, P.G., & Panagia, N. 1983, A&A, 128, 212
- (62) McCall, B.J., Geballe, T.R., Hinkle, K.H., & Oka, T. 1998, Science, 279, 1910
- (63) Mouillet, D., Lagrange, A.M., Augereau, J.C., & Ménard, F. 2001, A&A, 372, L61
- (64) Natta, A., & Krügel, E. 1995, A&A, 302, 849
- (65) Pantin, E., Waelkens, C., & Malfait, K. 1999, in The Universe as Seen by ISO, ed. P. Cox & M.F. Kessler (ESA SP-427; Noordwijk: ESA/ESTEC), 38
- (66) Rickman, H. 2003, in ASP Conf. Ser., Cometary Nuclei in Space and Time, ed. M.F. A’Hearn (San Francisco: ASP), in press
- (67) Schneider, G., et al. 1999, ApJ, 513, L127
- (68) Siebenmorgen, R., Prusti, T., Natta, A., & Müeller, T.G. 2000, A&A, 361, 258
- (69) Spitzer, L., Jr. 1941, ApJ, 93, 369
- (70) Sylvester, R.J., & Skinner, C.J. 1996, MNRAS, 283, 457
- (71) Sylvester, R.J., Skinner, C.J., & Barlow, M.J 1997, MNRAS, 289, 831
- (72) Sylvester, R.J., Dunkin, S.J., & Barlow, M.J 2001, MNRAS, 327, 133
- (73) Sylvester, R.J., Skinner, C.J., Barlow, M.J, & Mannings, V. 1996, MNRAS, 279, 915
- (74) Szczepanski, J., Wehlburg, C., & Vala, M. 1995, Chem. Phys. Lett., 232, 221
- (75) Takeuchi, T., & Artymowicz, P. 2001, ApJ, 557, 990
- (76) Telesco, C.M., & Knacke, R.F. 1991, ApJ, 372, L29
- (77) Telesco, C.M., et al. 2000, ApJ, 530, 329
- (78) Thi, W.F., et al. 2001, ApJ, 561, 1074
- (79) van den Ancker, M.E., de Winter, D., & Tjin A Djie, H.R.E. 1998, A&A, 330, 145
- (80) Verstraete, L., Léger, A., d’Hendecourt, L., Defourneau, D., & Dutuit, O. 1990, A&A, 237, 436
- (81) Walker, H.J., & Wolstencroft, R.D. 1988, PASP, 100, 150
- (82) Weidenschilling, S.J., & Cuzzi, J.N. 1993, in Protostars and Planets III, ed. E.H. Levy & J.I. Lunine (Tucson: Univ. Arizona Press), 1031
- (83) Weinberger, A.J., Becklin, E.E., & Zuckerman, B. 2003, ApJ, 584, L33
- (84) Weinberger, A.J., Rich, R.M., Becklin, E.E., Zuckerman, B., & Matthews, K. 2000, ApJ, 544, 937
- (85) Weinberger, A.J., Becklin, E.E., Schneider, G., Smith, B.A., Lowrance, P.J., Silverstone, M.D., Zuckerman, B., & Terrile, R.J. 1999, ApJ, 525, L53
- (86) Weingartner, J.C., & Draine, B.T. 2001, ApJS, 134, 263
- (87) Whipple, F.L. 1999, Planet. Space Sci., 47, 301
- (88) Whittet, D.C.B., Williams, P.M., Zealy, W.J., Bode, M.F., & Davies, J.K. 1983, A&A, 123, 301
- (89) Wyatt, M.C., Dermott, S.F., Telesco, C.M., Fisher, R.S., Grogan, K., Holmes, E.K., & Piña, R.K. 1999, ApJ, 527, 918
- (90) Zuckerman, B. 2001, ARA&A, 39, 549
- (91) Zuckerman, B., Forveille, T., & Kastner, J.H. 1995, Nature, 373, 494
- (92) Zuckerman, B., Song, I., Bessell, M.S., & Webb, R.A. 2001, ApJ, 562, L87