Probing the Redshift Desert Using the Gemini Deep Deep Survey: observing galaxy mass assembly at
Abstract
The aim of the Gemini Deep Deep Survey is to push spectroscopic studies of complete galaxy samples (both red and blue objects) significantly beyond ; this is the redshift where the current Hubble sequence of ellipticals and spirals is already extant. In the Universe at the only currently spectroscopically confirmed galaxies are blue, star-forming and of fragmented morphology. Exploring this transition means filling the ‘redshift desert’ where there is a dearth of spectroscopic measurements. To do this we need to secure redshifts of the oldest, reddest galaxies (candidate ellipticals) beyond which has led us to carry out the longest exposure redshift survey ever done: 100 ksec spectroscopic MOS exposures with GMOS on Gemini North. We have developed an implementation of the CCD “nod & shuffle” technique to ensure precise sky-subtraction in these ultra-deep exposures. At the halfway mark the GDDS now has galaxies in the redshift desert extending up to and with secure redshifts based on weak rest-frame UV absorption features complete for both red, old objects and young, blue objects. The peak epoch of galaxy assembly is now being probed by direct spectroscopic investigation for the first time. On behalf of the GDDS team I present our first results on the properties of galaxies in the ‘redshift desert’.
Department of Physics & Astronomy, Johns Hopkins University, Baltimore, MD 21218-2686, United States
1. Introduction: the ‘redshift desert’
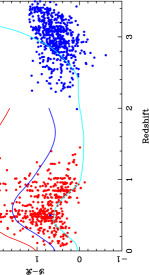
The ‘redshift desert’ is the well known gap between and where there is a dearth of spectroscopic redshifts. This is illustrated in Figure 1 which shows a color-redshift plot of some of the deepest Keck spectroscopic samples now available. Generally galaxies fall in too two groups: pure magnitude selected samples which now reach as faint as and redshifts and at higher redshifts the ‘Lyman Break’ galaxies. These are color-selected via their Lyman break and are easily found for (Steidel et al. 2003) and are being extended down to (Erb et al. 2003).
These samples are selected optically and as a result the galaxies selected at high-redshift have turned out to be those with the strongest ultraviolet (UV) emission because for the observed optical probes the rest-frame UV. Of note are the Lyman break galaxies which all have spectra characteristic of starburst galaxies: blue UV continua, ISM absorption lines and evidence of outflows.
Other high-redshift populations, which emit less strongly in the UV, have been found. Examples include the sub-mm selected SCUBA sources (Chapman et al. 2003) and the class of objects known as ‘Extremely Red Objects’ selected via their strong near-infrared (NIR) emission and red optical-NIR colors (e.g. Smail et al. 2002). While some spectra of such objects have been achieved there has been a lack of success in securing large samples of both red and blue galaxies above .
The reason for this is primarily that the K-correction above has such a strong effect. Most galaxies apart from strong starbursts are significantly less luminous in the near-UV than at optical wavelengths, this is especially true of galaxies with SEDs characteristic of old stellar populations. Furthermore there is a lack of strong emission lines, even in starforming galaxies, between [OII] (3727Å) and Lyman- (1216Å). Thus spectroscopy must reach sufficient signal:noise to robustly detect the continuum and hence achieve absorption line redshifts.
2. Galaxy Spectroscopy with Nod & Shuffle
Our goal with the ‘Gemini Deep Deep Survey’ (GDDS) was to achieve a complete NIR magnitude limited sample of both red and blue galaxies pushing well above with the aim of reaching . In order to do this we need to be able to secure absorption line spectra of the reddest galaxies — candidate elliptical galaxies with redshifts which are the hardest to get redshifts of as all the flux comes out in the red and there are no emission lines. Therefore one needs efficient red spectroscopy. In principle the best option would be near-IR 1–2m spectroscopy but too date there are no known examples of normal galaxies with absorption line NIR redshifts. This is because the sky is extremely bright in the NIR and because the detectors are very noisy. Moreover the field-of-view of the instrumentation is limited by the expense of NIR detector technology.
For the GDDS the compromise approach we adopted was to push on the red-end of the optical passband (5000-10 000Å) using CCD technology. The readnoise and sky brightness are reduced with respect to the near-IR, but so are the fluxes of the target objects. A simple estimate shows that a elliptical could be as faint as requiring a ksec spectroscopic exposure to reach in the continuum at low resolution. Such long exposures are subject to many possible systematic effects making sky removal difficult — objects are of the sky. However if such long exposures were possible then the optical approach would have a grant advantage: because CCDs are relatively inexpensive instruments typically offer much wider fields-of-view and hence greater multiplex advantage.
We adopted an approach known as ‘nod & shuffle’ (Glazebrook & Hawthorn 2001) to facilitate long exposures with accurate sky-subtraction in the red. (Figure 2). Briefly part of the CCD acts as a storage area and the telescope is nodded between an ‘object’ and a ‘sky position’. (In our case these were two neighboring positions along a slit). The spectrum at the sky position is stored in the storage area by ‘charge shuffling’ which introduces no additional noise provided a CCD has good charge transfer efficiency.
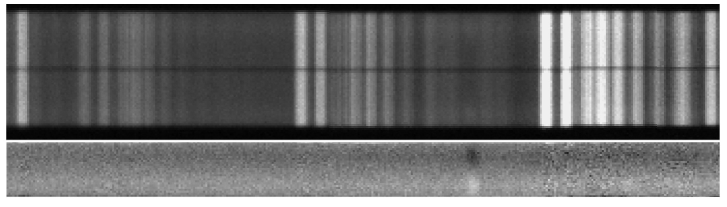
The nodding & shuffling is typically done many times throughout the course of a long exposure before reading out. Sky subtraction simply consists of subtracting the image from itself after being shifted by the shuffle distance.
For the GDDS we cooperated with the Gemini Observatory to implement nod & shuffle on the optical GMOS spectrograph (Crampton et al. 2000). This is notable as the first implementation of nod & shuffle on an 8m telescope. Commissioning tests in July 2002 indicated that sky-subtraction performance better than 0.1% was being achieved with a 60s object60s sky nod & shuffle cycle. For more details about nod & shuffle with GMOS and the modes used with the GDDS see Abraham et al. (2003).
3. The Gemini Deep Deep Survey
The scientific design of the GDDS required spectroscopy of a near-IR selected sample to . Targets were selected from the Las Campanas Infrared Survey which has deep optical and NIR data over many square degrees and has good photometric redshift estimates (Chen et al. 2003). The advantages of near-IR selection are well known (Glazebrook et al. 1994). If one selects in the -band then the K-corrections are SED independent to roughly . Moreover the light is dominated by the old stellar population, selecting in is a very good proxy for selecting by stellar mass. Thus a near-IR selected sample can select massive galaxies at high-redshift if they exist even if they are not actively star-forming and have weak UV. (The K20 survey has similar motivations and goals but is less deep; see Cimatti et al., 2002.) The survey design consisted of:
-
1.
A primary selected sample. The photo-z distribution of the LCIRS indicated we needed to go this deep in order to penetrate to . For the reddest galaxies at this limit .
-
2.
A fill-in sample of low-priority targets, anything with where there was space on the mask.
-
3.
Photometric redshifts were used to weed out objects with . This has to be done or else the low redshift foreground dominates. At low redshifts photo-z’s work the best because of the vastly better calibration, so this robustly leaves us with a sample.
-
4.
Four fields were picked which lay within GMOS tiles, typically 70 slits could be allocated within each field. With nod & shuffle the slits only needed to be 2 arcsec long.
-
5.
Each field was observed for ksec total using a 60s60s nod & shuffle cycle, reading out every 1800s. Low resolution () 5000–10,000Å GMOS spectra were taken.
All four fields were observed on Gemini-North between August 2002 and July 2003 and have been completely reduced. Redshifts and spectral classes were assigned by eye (by committee!) — in particular for the early-type galaxies by comparing with low-redshift templates. The final catalogs are currently being prepared for publication.
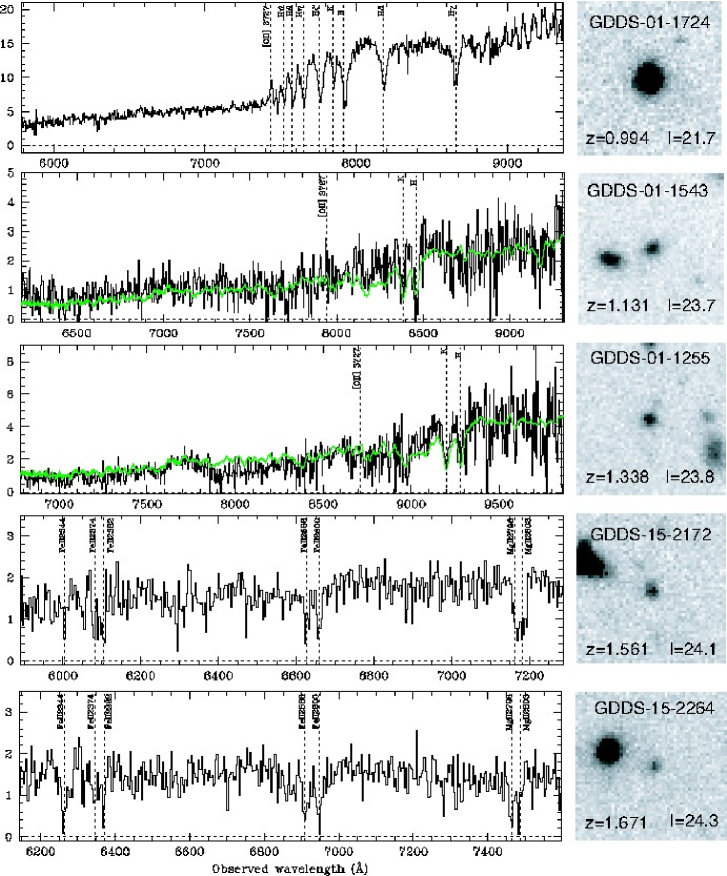
Some example spectra are shown in Figure 3, absorption line redshifts are obtained for both blue star-forming galaxies (ISM absorptions in FeII and MgII) and red early-type spectra (from matching to low-redshift UV templates which exhibit the same broad F features).
4. GDDS early results
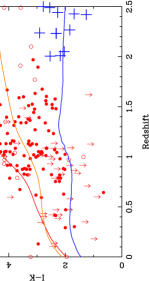
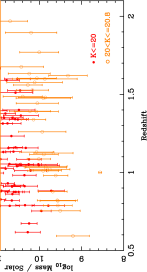
Figure 4 shows the GDDS color-redshift plot from the first two fields for the -selected primary sample. The spectroscopic completeness is 77%. There are 36 galaxies with spectroscopically confirmed galaxies with secure redshifts . It can be seen that we are picking up a complete range of SED types to and identifying objects much redder than Lyman break galaxies at comparable redshifts.
It is of course natural to ask ‘how massive are these galaxies’ ? The typical Lyman Break objects have stellar masses M⊙ (Papovich et al. 2001). We might expect that our objects being much brighter in the -band will be considerably more massive.
To answer this question we have fit SEDs to our multicolor data to determine -band mass-to-light values for the stellar population and hence derive stellar masses. Our procedure will be described in detail elsewhere; however we note that to first order the -band values vary much less than they do in the optical (typically only a factor of two) and are far less sensitive to extinction and metallicity uncertainties. We do use throughout a full calculation fitting over a grid of 95,864 model galaxy SEDs computed using the PEGASE.2 code (Fioc & Rocca-Volmerange 1997). These models include a full range of dust extinction, metallicity, multiple bursts and different long-term star-formation histories.
Our results are shown in Figure 5. This shows the masses of our galaxies as a function of our -band limit. It can be seen that for we reach a mass limit of M⊙ at , and that a considerable number of galaxies have masses M⊙, greatly in excess of the LBG population. This is natural given the galaxies are red and -luminous. Many of these are spectroscopically confirmed to have old stellar populations. Such an abundance of massive galaxies may present a considerable problem for CDM models of hierarchical galaxy formation which typically predict a factor of drop in the number of M⊙ galaxies between and . (Baugh et al. 2003).
We are currently working on finalizing the space density of these massive galaxies at , this work will be published as Glazebrook et al. (2004). The beauty of the GDDS is that we have spectra as well. We can assess whether a galaxy is spectroscopically old or a reddened starburst. We can also determine abundances from the spectra (see Savaglio et al. 2004, in press).
5. Conclusions
The Gemini Deep Deep Survey has succeeded in obtaining spectroscopic redshifts of galaxies in the former redshift desert. We have closed the gap, but more importantly we are highly complete for both red and blue galaxies. A catalog paper (Abraham et al. 2004) is in preparation. Our results to date are:
-
1.
An abundance of massive galaxies at . (Glazebrook et al. 2004, in prep.) These may be problematic for CDM models of heircharchical growth of massive halos.
-
2.
Many of the massive red galaxies at have spectra of pure old stellar populations (McCarthy et al. 2003, in prep.)
-
3.
Massive starburst galaxies at have high metal columns and are close to solar in abundances (Savaglio et al. 2004 in press).
At the time of this meeting we had just received the Gemini data for the final two of our four fields. The complete sample will be more than double the size of the one presented here. To come we have been awarded Cycle 12 time to image our fields with the Advanced Camera for Surveys on the Hubble Space Telescope. Thus we hope to connect our results to physical galaxy morphology. It is clear we are now living in an age where the formation of galaxies and the Hubble Sequence can be observed directly.
6. Acknowledgments
This work is based on observations obtained at the Gemini Observatory, which is operated by the Association of Universities for Research in Astronomy, Inc., under a cooperative agreement with the NSF on behalf of the Gemini partnership: the National Science Foundation (United States), the Particle Physics and Astronomy Research Council (United Kingdom), the National Research Council (Canada), CONICYT (Chile), the Australian Research Council (Australia), CNPq (Brazil) and CONICET (Argentina). Karl Glazebrook acknowledges genereous funding from the David & Lucile Packard Foundation.
References
Abraham R.G., Glazebrook K., McCarthy P., Carlberg R., Chen H-W, Crampton D., Hook I., Jørgensen I., Marzke R., Murowinski R., Roth K., Savaglio S., 2003, Gemini Observatory Newsletter, 2003, 26, 6.
Baugh C. M., Benson A. J., Cole S., Frenk C. S., Lacey C., 2003, In: n the proceedings ‘The Mass of Galaxies at Low and High Redshift’, eds. R. Bender, A. Renzini, 91
Chapman S. C., Blain A. W., Ivison R. J., Smail I. R., 2003, Natur, 422, 695
Chen H., Marzke R. O., McCarthy P. J., Martini P., Carlberg R. G., Persson S. E., Bunker A., Bridge C. R., Abraham R. G., 2003, ApJ, 586, 745
Cimatti A., Mignoli M., Daddi E., Pozzetti L., Fontana A., Saracco P., Poli F., Renzini A., Zamorani G., Broadhurst T., Cristiani S., D’Odorico S., Giallongo E., Gilmozzi R., Menci N., 2002, A&A, 392, 395
Crampton D., Fletcher J. M., Jean I., Murowinski R. G., Szeto K., Dickson C. G., Hook I., Laidlaw K., Purkins T., Allington-Smith J. R., Davies R. L., 2000, SPIE, 4008, 114
Cohen J. G., 2001, AJ, 121, 2895
Erb D. K., Shapley A. E., Steidel C. C., Pettini M., Adelberger K. L., Hunt M. P., Moorwood A. F. M., Cuby J., 2003, ApJ, 591, 101
Fioc M., Rocca-Volmerange B., 1997, A&A, 326, 950
Glazebrook K., Peacock J. A., Collins C. A., Miller L., 1994, MNRAS, 266, 65
Glazebrook K., Bland-Hawthorn J., 2001, PASP, 113, 197
Papovich C., Dickinson M., Ferguson H. C., 2001, ApJ, 559, 620
Smail I., Owen F. N., Morrison G. E., Keel W. C., Ivison R. J., Ledlow M. J., 2002, ApJ, 581, 844
Steidel C. C., Giavalisco M., Pettini M., Dickinson M., Adelberger K. L., 1996, ApJ, 462, L17
Steidel C. C., Adelberger K. L., Shapley A. E., Pettini M., Dickinson M., Giavalisco M., 2003, ApJ, 592, 728