Central DM density cuspiness in LSB’s: a stellar kinematics approach.
Abstract
We present preliminary results from spectroscopic observations of a sample of 11 low surface brightness galaxies (LSB). We measured the stellar and gaseous kinematics along their major and minor axes. Such information will allow us to accurately investigate the dark matter (DM) content within their optical regions, providing further constraints on the predictions of standard CDM models. Although dynamical modeling is still in progress, our observations already show that the derived stellar kinematics is more regular than the ionized gas one, which often shows evidence for non-circular and asymmetric motions.
Dipartimento di Astronomia, Universitá di Padova, Italy
Physics Department, University of Oxford, UK
Vatican Observatory, Tucson, USA
1. Observations and results
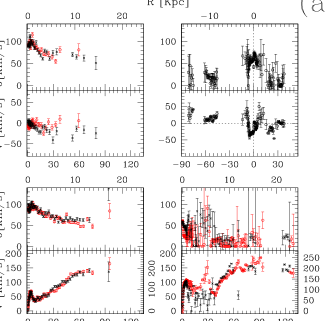
We obtained long-slit spectroscopic data with the VLT FORS2 spectrograph () in the Hβ, [OIII]5007Å, MgII and Fe region for 11 LSBs with the aim of constructing dynamical mass models based on both the stellar and ionized gas kinematics to constrain their DM density radial profiles, in particular in their nuclear regions. This part of the work is still in progress. However, we should already stress the following two important observational results: 1) The ionized gas is subject to non-circular motion in the majority of our sample galaxies. 2) The stellar kinematics is generally very regular. The high degree of symmetry of the stellar velocity and velocity dispersion curves and the small scatter between the points allows to derive the stellar kinematical profiles with small error-bars and without applying any smoothing to the data. This is not always true for the gas kinematics. Such precise kinematical measurement are therefore very encouraging for the forthcoming dynamical mass models. In Fig.1a we plot the velocity and velocity dispersion radial profiles of ESO 189-07: Left and right panels represent the stellar and ionized gas kinematics respectively. The lower and upper panels represent the major and minor axis respectively. The curves have been folded around the kinematical center and the two symbols refer to the two side of the galaxy (with the exception of the gaseous minor axis which has not been folded). Deprojected velocities and radii in Kpc are also shown. The remarkable degree of symmetry of the stellar kinematics also allows to check the positioning of the slit and an accurate determination of the kinematical center. Conversely, the ionized gas kinematics is much less defined and such operations would be less reliable if based on it.
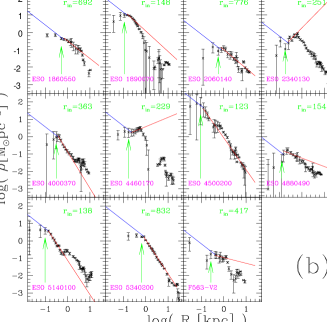
Following the scheme indicated by previous authors (de Blok et al 2001, Swaters et al. 2003) we derived the central mass density radial profile directly from the major axis ionized gas velocity curve with the only assumption of spherical mass distribution. We took the major axis velocities, deprojected, smoothed and derived the density . The resulting radial density profiles are plotted in Fig.1b. In the figure we show the value of (in parsec) defined as the innermost radius at which we can derive a reliable density value (i.e. the velocity measurement in not affected by seeing smearing or pixel size). The inner line is the density profile passing through . We also show as a more external line the density fit in the external regions adiacent to as comparison. From the figure it is possible to see that we find both galaxies showing a density radial profile less peaked or as peaked as in the center. It is also evident that there are cases as ESO4460170 or ESO2340130 where the density decreases inward in the center. This is an artifact due to the presence of ionized-gas non-circular motions in the core region, motions that we can not see from the major axis alone but we know are present since we have minor axis kinematical information. But is the gas the best tracer of the potential in the core region ?
References
de Blok, W. J., McGaugh, S., Bosma, A., & Rubin, V. C. 2001, ApJ, 552, L26
Swaters, R. A., Madore, B. F., van den Bosch, Frank C., & Balcells, M. 2003, ApJ, 583, 732