First detection of triply-deuterated methanol
We report the first detection of triply-deuterated methanol, with 12 observed transitions, towards the low-mass protostar IRAS 162932422, as well as multifrequency observations of 13CH3OH, used to derive the column density of the main isotopomer CH3OH. The derived fractionation ratio [CD3OH]/[CH3OH] averaged on a 10′′ beam is 1.4%. Together with previous CH2DOH and CHD2OH observations, the present CD3OH observations are consistent with a formation of methanol on grain surfaces, if the atomic D/H ratio is 0.1 to 0.3 in the accreting gas. Such a high atomic ratio can be reached in the frame of gas-phase chemical models including all deuterated isotopomers of H.
Key Words.:
ISM: abundances – ISM: molecules – Stars: formation – ISM: individual: IRAS1629324221 Introduction
Despite the relatively low elemental abundance of deuterium in space (a factor of 1.510-5 less abundant than H; Linsky 1998), extremely large amounts of doubly-deuterated formaldehyde (D2CO/H2CO 10%) have been observed in the solar-type protostar IRAS 162932422 (hereafter IRAS 16293, Ceccarelli et al. 1998, Loinard et al. 2000, Ceccarelli et al. 2001), initiating the search for other multiply deuterated molecules. Subsequently, doubly deuterated formaldehyde, doubly deuterated hydrogen sulfide and multiply deuterated ammonia have been observed in other protostars and dark clouds from where protostars form (Roueff et al. 2000, Loinard et al. 2001, Ceccarelli et al. 2002, van der Tak et al. 2002, Lis et al. 2002, Vastel et al. 2003). These studies have been interpreted in terms of two different routes for formaldehyde, hydrogen sulfide and ammonia deuteration: active grain chemistry followed by at least partial desorption into the gas for formaldehyde and hydrogen sulfide on the one hand and gas-phase chemistry for ammonia on the other hand. However, ammonia may also be a grain surface product, provided a large D/H atomic ratio in the accreting gas. Recently, doubly-deuterated methanol was detected towards IRAS 16293 (Parise et al. 2002). This observation provided new constraints for chemical models. The observations of the deuterated methanols CH2DOH and CHD2OH were both consistent with the formation of methanol from successive hydrogenations of CO by reaction with atomic H on grain surfaces, but required an atomic D/H ratio of 0.2 to 0.3 in the accreting gas. At the time of the observation of doubly-deuterated methanol, no gas-phase model was able to predict such a high atomic D/H ratio. Meantime, observations of doubly deuterated formaldehyde in a sample of pre-stellar cores showed that the degree of deuteration increases with increasing CO depletion (Bacmann et al. 2002, 2003). This deuteration of formaldehyde in pre-stellar cores may occur partially in the CO-depleted gas-phase and partially on the surface of dust grains, followed by some inefficient desorption mechanism. A further spectacular confirmation of enhanced deuteration in CO-depleted gas came from the detection of abundant H2D+, likely the most abundant ion, in the prestellar core L1544 (Caselli et al. 2003). Phillips and Vastel (2003) suggested that in CO-depleted gas, even the multiple deuterated forms of H may be abundant and play a role in the molecular deuteration enhancement. The suggestion has been fully confirmed by the modelling of Roberts et al. (2003), which shows that including HD and D in the chemical network increases dramatically the molecular deuteration, and allows the production of the large atomic D/H ratio predicted by the methanol observations (Parise et al. 2002).
In this paper, we report the first detection of triply-deuterated methanol CD3OH in space, performed towards the solar-type protostar IRAS 16293. We also present a multifrequency observation of 13CH3OH, used to derive the column density of the main isotopomer CH3OH. These observations provide yet another stringent test to confirm the validity of grain surface models.
2 Observations and results
| Frequency | Transition | Eup | Tmb | v | ||
| GHz | Debye2 | K | K km s-1 | mK | km s-1 | |
| CD3OH | ||||||
| 156.237016⋆ | 41-31 E2 | 2.94 | 21.5 | 0.102 0.023 | 51 | 1.8 0.4 |
| 156.239295 | 42-32 A- | 2.44 | 42.0 | 0.032 0.012 | 26 | 1.2 0.5 |
| 156.242613 | 40-30 A+ | 3.13 | 18.8 | 0.059 0.018 | 31 | 1.8 0.5 |
| 156.253079 | 42-32 A+ | 2.44 | 42.0 | 0.056 0.015 | 38 | 1.4 0.4 |
| 156.260737⋆ | 43-33 E2 | 1.39 | 55.5 | 0.061 0.018 | 46 | 1.3 0.4 |
| 156.262936 | 43-33 E1 | 1.37 | 46.9 | 0.044 0.011 | 43 | 1.0 0.2 |
| 156.275238 | 41-31 E1 | 2.93 | 33.1 | 0.034 0.021 | 26 | 1.2 1.2 |
| 156.285288⋆ | 42-32 E2 | 2.35 | 36.3 | 0.065 0.021 | 54 | 1.1 0.3 |
| 156.581519 | 81-70 E2 | 4.15 | 70.2 | 0.050 0.010 | 46 | 1.0 0.2 |
| 160.640122 | 20-21 E2 | 2.38 | 15.95 | 0.090 0.019 | 26 | 3.2 0.5 |
| 160.718291 | 62-51 E1 | 2.22 | 50.2 | 0.039 0.009 | 29 | 1.3 0.2 |
| 160.753934 | 10-11 E2 | 1.45 | 12.2 | 0.038 0.009 | 35 | 1.0 0.2 |
| 13CH3OH | ||||||
| 156.299374 | 505-5-15 | 0.697 | 47.1 | 0.190.08 | 65 | 3.0 0.5 |
| 160.507694 | 212-303 | 0.300 | 21.3 | 0.080.02 | 29 | 2.4 0.6 |
| 330.194042 | 7-17-6-16 | 5.55 | 69.0 | 0.510.16 | 120 | 3.8 0.6 |
| 330.252798 | 707-606 | 5.66 | 63.4 | 0.430.15 | 100 | 4.0 1.2 |
| 330.265233 | 7-61-6-60 | 1.50 | 253.4 | 0.150.10 | 80 | 1.7 1.0 |
| 330.277270 | 761-660 | 1.50 | 258.1 | 0.120.08 | 60 | 2.0 0.7 |
| 330.277270 | 762-661 | 1.50 | 258.1 | 0.120.08 | 60 | 2.0 0.7 |
| 330.319110 | 752-651 | 2.78 | 202.0 | 0.450.21 | 90 | 4.8 0.9 |
| 330.319110 | 753-652 | 2.78 | 202.0 | 0.450.21 | 90 | 4.8 0.9 |
| 330.342534 | 744-643 | 3.81 | 144.2 | 0.070.05 | 50 | 1.3 6.7 |
| 330.342534 | 743-642 | 3.81 | 144.2 | 0.070.05 | 50 | 1.3 6.7 |
| 330.408395 | 734-633 | 4.61 | 111.4 | 0.910.19 | 200 | 4.2 0.7 |
| 330.442421 | 716-615 | 5.69 | 84.49 | 0.420.12 | 140 | 2.8 0.9 |
| 330.535822 | 725-624 | 5.14 | 85.80 | 0.250.11 | 40 | 5.6 1.2 |
| 330.535890 | 7-26-6-25 | 5.20 | 89.45 | 0.250.11 | 40 | 5.6 1.2 |
1The fluxes were derived using Gaussian fits, and the uncertainty given is where is the statistical error and the calibration uncertainty (15%). 2The noise rms is 8 mK for the CD3OH data and 37 mK for the 13CH3OH data. 3A star following the frequency indicates that the line is close to a CH2DCN line and was fitted by a two-component Gaussian fit (see text).
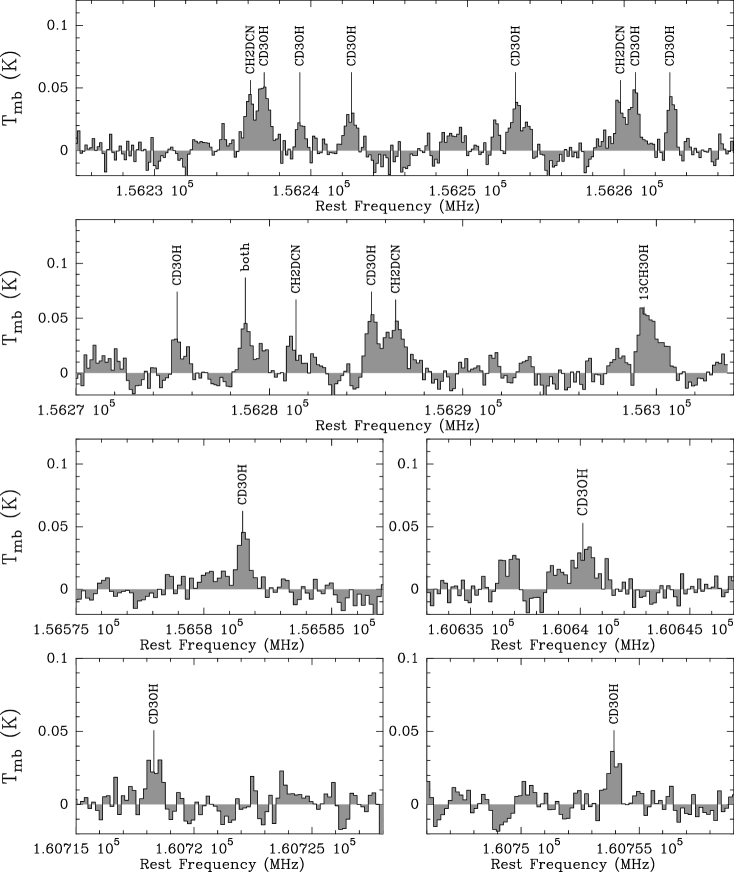
Using the IRAM 30-meter telescope (Pico Veleta, Spain), we detected the 12 CD3OH lines reported in Table 1. The telescope was pointed at the coordinates (2000) = 16h32m22.6s and (2000) = -24∘28′33.0′′. The observations were performed in April 2003. Two receivers were used simultaneously at 2 mm, to observe two bands around 156 and 160 GHz, with typical system temperatures of about 230 and 250 K respectively. These receivers were connected to the VESPA autocorrelator divided in six units. The telescope beam width is approximately 15′′ at 160 GHz. All observations were performed using the wobbler switching mode with an OFF position 4′ from the source. The pointing accuracy was monitored regularly on strong continuum sources, and was found to be better than 3′′. All spectra were obtained with an integration time of 750 minutes. The rms noise is equal to 8 mK (Tmb) for a spectral resolution of 0.3 km s-1.
Observed spectra are shown in Fig. 1. The measured intensities, linewidths and main-beam temperatures are reported in Table 1. The frequencies of all detected lines have previously been measured in the laboratory with an accuracy of 25 kHz (Walsh et al. 1998), while the transition strengths and energy levels were estimated from the published spectroscopic constants (Predoi-Cross et al. 1998) using the methanol program at Ohio State.
Some of the CD3OH lines (indicated by a star in Table 1) are close to CH2DCN lines. In that case, the intensity was derived by using a two-component Gaussian fit, so the quoted fluxes have a further uncertainty due to the relative line contribution.
Two 13CH3OH lines at 156 GHz were observed simultaneously to the CD3OH lines. In addition, we analysed 330 GHz 13CH3OH observations obtained using the JCMT in January 2000, with an rms noise of 37 mK. The beam size of the JCMT is 15′′ at the considered frequencies, i.e. equivalent to the beam size of the 30-meter at 160 GHz. Detailed information concerning the 13CH3OH spectra is presented in Table 1.
3 Derivation of the column densities
We derived the abundance of CD3OH using the method of rotational diagrams. The A and E species are considered to be linked by ion-molecule reactions that transfer molecules from one species to the other. We then computed one single rotational diagram for the two species, presented in Fig. 2 (a). We averaged the level column densities on a 10′′ beam, as in Parise et al. (2002), following the suggestion by van Dishoeck et al. (1995) of enhanced methanol emission in the central 10′′ region of IRAS 16293. A more recent study of the spatial distribution of CH3OH was performed by Schoier et al. (2002), and showed evidence for an abundance jump of methanol of two orders of magnitude in the inner part of the envelope ( 150 AU). However, in the following we consider averaged abundances on a 10′′ beam for consistency with the Parise et al. (2002) study.

The ground E state is estimated to lie about 4.6 K above the ground A state. An A state has a relative spin-torsional weight of 11 whereas the relative spin-torsional weight of an E state is 16. The partition function was computed from the asymmetric-top approximation :
where , with A = 3.3957 K, B = 0.9529 K and C = 0.9247 K, as determined by Walsh et al. (1998).
By fitting a straight line to the data in the rotational diagram, we derive a rotational temperature of 85 28 K, consistent with the rotational temperature of CH3OH (van Dishoeck et al. 1995). The CD3OH column density is (1.4 0.9)1014 cm-2. We also derived the CD3OH column density by fixing the rotational temperature to the one inferred from the CH2DOH and CHD2OH molecules (Trot = 47 7 K, Parise et al. 2002). The CD3OH column density is then (7.8 2.3)1013 cm-2. Table 2 lists the column densities for all deuterated methanols observed in IRAS 16293.
The column density of 13CH3OH was derived using the same method, with the molecular parameters taken from the Cologne Database for Molecular Spectroscopy (Muller et al. 2001). The rotational diagram is presented in Fig 2 (b). The inferred rotational temperature is 208 70 K and the column density averaged over a 10′′ beam is (2.6 1.8)10cm-2. We also computed the column density for fixed rotational temperatures of 50 K and 80 K. The inferred value is (1.4 0.6)10cm-2, independent of the temperature in this range. Using the 12C/13C ratio of 70 derived by Boogert et al. (2000), we derive a column density of (9.8 4.2)1015 cm-2 for CH3OH. This value is nearly 3 times higher than the column density used by Parise et al. (2002), inferred from CH3OH observations from van Dishoeck et al. (1985). The fractionation ratios, relative to this new estimate of the CH3OH column density, are reported in Table 2 for all deuterated isotopomers of methanol.
| Molecule | Trot(K) | N (cm-2) | fractionation |
|---|---|---|---|
| CD3OH | 85 28 | (1.4 0.9)1014 | 1.4 1.4 % |
| 47 7a | (7.8 2.3)1013 | 0.8 0.6 % | |
| CHD2OHb | 47 7 | (6.0 2.2)1014 | 6 5 % |
| CH2DOHb | 48 3 | (3.0 0.6)1015 | 30 20 % |
| CH3ODb | 20 4 | (1.5 0.7)1014 | 2 1 % |
afixed temperature, see text. bObserved in Parise et al. 2002
4 Discussion and conclusions
The main result of this Letter is the first detection of triply-deuterated methanol in space, with 12 detected transitions. This discovery follows the detection of doubly-deuterated as well as singly-deuterated isotopomers towards the same object (Parise et al. 2002). Observations of multiple isotopomers of methanol represent a powerful constraining tool for chemical processes that lead to such a high deuteration.
It is interesting to compare these observations to the predictions of the simple grain chemistry scheme of Rodgers & Charnley (2002). If the D atoms are randomly distributed in the methanol isotopomers (i.e. this scheme does not consider any activation barrier for the reactions but rather assumes that all reactions are equiprobable), the fractionation ratios R of each isotopomer relative to CH3OH should scale as follows: R(CH3OD) = , R(CH2DOH) = 3, R(CHD2OH) = 3 and R(CD3OH) = , where is the accreting atomic D over H ratio. The three independent observations of CH2DOH, CHD2OH and CD3OH are consistent within the error bars with a value of 0.10.2 for the D over H accretion rate. Accounting for the different mass of the atoms, this ratio corresponds to an abundance ratio in the gas-phase of D/H = (0.10.2) = 0.150.3. However, this simple scheme fails to explain the observed low abundance of CH3OD.
More accurate grain chemical models accounting for different activation barriers for the reactions have been developed in the last few years. We compare in the following our observations with the model developed by Stantcheva & Herbst (2003). This model is based on the direct solution of the master equation and therefore gives essentially the same predictions as the Monte Carlo models described by Caselli et al. (2002) or Charnley et al. (1997). Fig. 3 shows predictions for fractionation ratios of deuterated isotopomers of methanol relative to CH3OH versus the atomic D/H ratio in the accreting gas (Stantcheva & Herbst 2003) when the various isotopomers are formed by active grain chemistry. In the limit of low temperature (10 K), this model essentially gives the ratios corresponding to a random distribution of deuterium atoms. Observed fractionation ratios with their error bars have been overlaid on each curve, allowing the derivation of the required atomic D/H ratio in the gas-phase. The CD3OH, CHD2OH and CH2DOH observations are consistent with a formation on grain surfaces with an atomic D/H abundance ratio of 0.10.2. Such a high atomic fractionation ratio in the gas phase is predicted by the recent gas-phase model of Roberts et al. (2003), which involves not only H2D+ but also D2H+ and D as precursors for deuterium fractionation, when the density of gas is very high and heavy species such as CO are strongly depleted.
As can be seen in Fig. 3, CH3OD appears to be under-deuterated when compared with the grain chemical predictions. It is possible that the CH3OD fractionation may be affected in the warm gas; e.g., this isotopomer may be preferentially converted into CH3OH when released in the gas-phase by protonation reactions followed by dissociative recombination with an electron (Charnley et al. 1997, Parise et al. 2002) :
The corresponding reactions with H2D+, HD and D come of little importance in view of their low abundance in the warm gas of the hot core. This hypothesis, which assumes that protonation reactions attack the oxygen end of the methanol only (Osamura, Roberts & Herbst, in prep), could be tested by observing the CH2DOD isotopomer. This observation may be difficult due to the expected low intensity of the lines.

Acknowledgements.
E. Herbst acknowledges the support of the National Science Foundation (US) for his research program in astrochemistry.References
- (1) Bacmann, A., Lefloch, B., Ceccarelli, C., Castets, A., Steinacker, J., & Loinard, L. 2002, A&A 389, L6
- (2) Bacmann, A., Lefloch, B., Ceccarelli, C., Steinacker, J., Castets, A., & Loinard, L. 2003, A&A 585, L55
- (3) Boogert, A.C.A., Ehrenfreund, P., Gerakines, P.A., Tielens, A.G.G.M., Whittet, D.C.B., Schutte, W.A., van Dishoeck E.F., de Graauw, Th., Decin, L., & Prusti T. 2000, A&A 353, 349
- (4) Caselli, P., Stantcheva, T., Shalabiea, O., et al. 2002 Planet. Space Sci., 50, 1257
- (5) Caselli, P., van der Tak, F.F.S., Ceccarelli, C., & Bacmann, A. 2003, A&A 403, L37
- (6) Cazaux, S., Tielens, A.G.G.M., Ceccarelli, C., Castets, A., Wakelam, V., Caux, E., Parise, B. & Teyssier, D. 2003, ApJL in press
- (7) Ceccarelli, C., Vastel, C., Tielens, A. G. G. M., Castets, A., Boogert, A. C. A., Loinard, L., & Caux, E. 2002, A&A, 381, L17
- (8) Ceccarelli, C., Loinard, L., Castets, A., Tielens, A. G. G. M., Caux, E., Lefloch, B., & Vastel, C. 2001, A&A, 372, 998
- (9) Ceccarelli, C., Castets, A., Loinard, L., Caux, E., & Tielens, A. G. G. M. 1998, A&A, 338, L43
- (10) Charnley S.B., Tielens A.G.G.M., & Rodgers S.D. 1997, ApJ 482, L203
- (11) Linsky, J. L. 1998, Space Sci. Rev., 84, 285
- (12) Lis, D. C., Roueff, E., Gerin, M., Phillips, T. G., Coudert, L. H., van der Tak, F. F. S., & Schilke, P. 2002, ApJ, 571, L55
- (13) Loinard, L., Castets, A., Ceccarelli, C., Caux, E., & Tielens, A. G. G. M. 2001, ApJ, 552, L163
- (14) Loinard, L., Castets, A., Ceccarelli, C., Tielens, A. G. G. M., Faure, A., Caux, E., & Duvert, G. 2000, A&A, 359, 1169
- (15) Maret S. et al. in prep
- (16) Muller, H.S.P., Thorwirth, S., Roth, D.A., & Winnewisser, G. 2001, A&A, 370, L49
- (17) Parise, B., Ceccarelli, C., Tielens, A. G. G. M., Herbst, E., Lefloch, B., Caux, E., Castets, A., Mukhopadhyay, I., Pagani, L., & Loinard, L. 2002, A&A, 393, L49
- (18) Phillips, T. & Vastel, C., 2003, in Chemistry as a Diagnostic of Star Formation, ed. C.L. Curry & M. Fish, in press (astro-ph/0211610)
- (19) Predoi-Cross, A., Xu. L.-H., Walsh, M.S., Lees, R.M., Winnewisser, M., & Lichau H. 1998, J. Mol. Spec., 188, 94
- (20) Roberts, H., Herbst, E., & Millar T. J. 2003, ApJ 591, 41
- (21) Rodgers, S. D., & Charnley, S. B. 2002, Planet. Space Sci., 50, 1125
- (22) Roueff, E., Tiné, S., Coudert, L. H., Pineau des Forêts, G., Falgarone, E., & Gerin M. 2000, A&A, 354, L63
- (23) Schoier, F.L., Jorgensen, J.K., van Dishoeck, E.F., & Blake, G.A. 2002, A&A 390, 1001
- (24) Stantcheva, T., & Herbst, E. 2003, MNRAS, 340, 983
- (25) van der Tak, F. F. S., Schilke, P., Müller, H. S. P., Lis, D. C., Phillips, T. G., Gerin, M., & Roueff, E. 2002, A&A, 388, L53
- (26) van Dishoeck, E. F., Blake, G. A., Jansen, D. J., & Groesbeck, T. D. 1995, ApJ, 447, 760
- (27) Vastel, C., Phillips, T.G., Ceccarelli, C., & Pearson, J. 2003, ApJL 593, L97
- (28) Walsh, M. S., Xu, L.-H., & Lees, R. M. 1998, J. Mol. Spectrosc.,188, 85