Searching for signs of triggered star formation toward IC 1848
We have carried out an in-depth study of three bright-rimmed clouds SFO 11, SFO 11NE and SFO 11E associated with the HII region IC 1848, using observations carried out at the James Clerk Maxwell Telescope (JCMT) and the Nordic Optical Telescope (NOT), plus archival data from IRAS, 2MASS and the NVSS. We show that the overall morphology of the clouds is reasonably consistent with that of radiative-driven implosion (RDI) models developed to predict the evolution of cometary globules. There is evidence for a photoevaporated flow from the surface of each cloud and, based upon the morphology and pressure balance of the clouds, it is possible that D-critical ionisation fronts are propagating into the molecular gas. The primary O star responsible for ionising the surfaces of the clouds is the 06V star HD17505. Each cloud is associated with either recent or ongoing star formation: we have detected 8 sub-mm cores which possess the hallmarks of protostellar cores and identify YSO candidates from 2MASS data. We infer the past and future evolution of the clouds and demonstrate via a simple pressure-based argument that the UV illumination may have induced the collapse of the dense molecular cores found at the head of SFO 11 and SFO 11E.
Key Words.:
Stars: formation – ISM: HII regions – ISM: Individual object: IC 1848 – ISM: Clouds – ISM: Dust – ISM: Molecules1 Introduction
IC 1848 is a large HII region, forming part of the W5 HII region-molecular cloud complex in the Perseus Arm. The HII region component of W5 (also known as S 199) is made up of two roughly circular thermal shells W5 East and W5 West, which are separated by a dust lane. IC 1848 is located to the south of W5 West (Braunsfurth 1983). W5 West is excited by the open cluster OCl 364, which comprises four O stars, whereas only one O star is visible within W5 East (Normandeau, Taylor & Dewdney. normandeau (1997)). The whole complex lies at a distance of 1.9 kpc (Ishida ishida (1970)) and is a well known and well-studied star-forming region (e.g. Valée, Hughes & Viner vhv79 (1979); Braunsfurth braun (1983); Normandeau, Taylor & Dewdney normandeau (1997); Heyer & Terebey heyer (1998); Carpenter, Heyer & Snell chs00 (2000)).
Numerous small bright-rimmed clouds (sometimes also known as bright-rimmed globules) are found at the rims of W5 East and West, which may be star-forming regions triggered via the expansion of the HII regions (Sugitani, Fukui & Ogura sfo (1991)). The expansion of the HII regions drives shocks into the surrounding molecular gas and these photoionisation-induced shocks are thought to trigger the collapse of sub-critical molecular cores within the clouds in a process known as radiative-driven implosion or RDI (Bertoldi bertoldi (1989); Bertoldi & McKee bk90 (1990); Lefloch & Lazareff ll94 (1994), ll95 (1995)). Radiative-driven implosion of molecular cores at the periphery of HII regions may thus be responsible for a subsequent generation of star formation, amounting to a possible cumulative total of several hundred new stars per HII region (Ogura, Sugitani & Pickles osp02 (2002)) and perhaps 15% or more of the low-to-intermediate mass stellar mass function (Sugitani, Fukui & Ogura sfo (1991)). Confirming bright-rimmed clouds as star-forming can provide important insights about the clustered mode of star formation and the overall star-formation efficiencies of molecular clouds.
Sugitani, Fukui & Ogura(sfo (1991)), hereafter referred to as SFO91, searched the Sharpless HII region catalogue (Sharpless sharpless (1959)) for bright-rimmed clouds associated with IRAS point sources, in order to identify potential star-forming clouds via their far-infrared emission. Later, Sugitani & Ogura (so94 (1994)) – SO94 – extended their search to include bright-rimmed clouds from the ESO(R) Southern Hemisphere Atlas. At least 89 bright-rimmed clouds have been found to be associated with IRAS point sources. For brevity (and consistency with SIMBAD) we will refer to the combined SFO91 and SO94 catalogues as the SFO catalogue. Whilst a few individual clouds from the SFO catalogue have been studied in detail (e.g. Lefloch, Lazareff & Castets llc97 (1997); Megeath & Wilson mw97 (1997); Codella et al. cbnst01 (2001)) and shown to harbour protostellar cores, the vast majority of the SFO clouds have not been associated with star-forming regions and the state of these clouds remains unknown. We have carried out a star formation census of SFO bright-rimmed clouds (Thompson et al. 2003a , 2003b ) to investigate the star-forming nature of the SFO bright-rimmed clouds and determine whether any star formation in the SFO sample was likely to have been triggered by the RDI process. In this paper we report the results for three bright-rimmed clouds from our census.
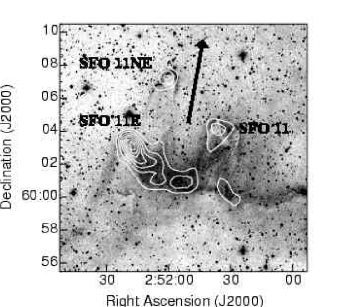
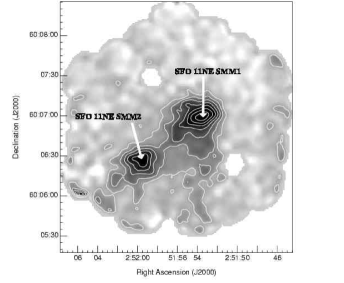
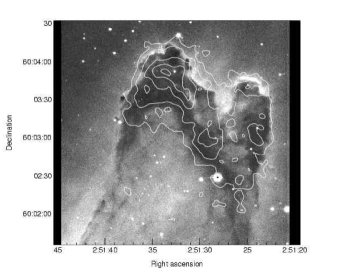
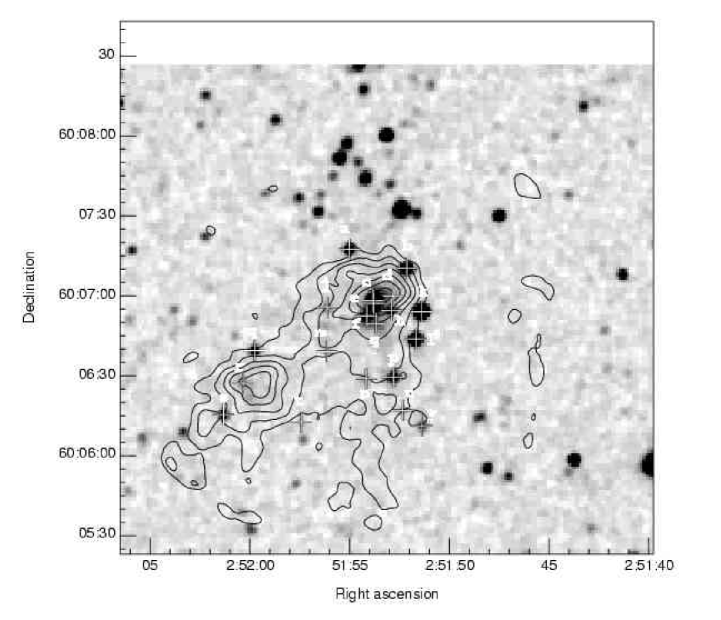
The bright-rimmed cloud SFO 11 is found at the southern edge of IC 1848. It is positionally associated with the IRAS point source 02476+5950 and in optical images is double-lobed and cometary in appearance (see Fig. 1). Two other bright-rimmed clouds that are not in the SFO catalogue are found within 6′ of SFO 11. Following the terminology of Ogura, Sugitani & Pickles (osp02 (2002)) they are described in this paper as SFO 11NE and SFO 11E. SFO 11NE is a cometary cloud found 4′ NE of SFO 11, with a “shoulder” to the east side of the cloud. SFO 11E is found 6′ E of SFO11 and is associated with a bright ridge of nebular emission at the Southern ionisation boundary of IC 1848. A red optical image of the three clouds obtained from the Digitised Sky Survey is shown in Fig. 1.
Neither SFO 11NE or SFO 11E are associated with any IRAS point sources. This may be either due to confusion caused by the limited IRAS resolution or simply because SFO 11NE and E do not contain embedded protostars or stars. We included SFO 11 and the two neighbouring clouds in our study of the SFO catalogue as they represent an ideal opportunity to study three possibly star-forming clouds close to each other on the sky and lying at a similar distance from the UV illumination source. In this paper we present JCMT molecular line, SCUBA sub-mm continuum, Nordic Optical Telescope narrowband H and archival observations (IRAS HIRES, 2MASS and VLA NVSS) to investigate the star-forming activity and general environment of these three clouds. These data are then modelled to try to understand their future evolution as potential star-forming regions.
In Sect. 2 we describe the observational procedure. The data are analysed in Sect. 3 where evidence for star formation, protostellar cores, embedded IR sources or molecular outflows is discussed. In Sect. 4 we explore implications for present and future star formation within the clouds. Finally in Sect. 5 we present a summary of our conclusions.
2 Observations
2.1 SCUBA dust continuum maps
We obtained simultaneous 450 and 850 m images of all three clouds using the sub-mm bolometer camera SCUBA (Holland et al. scuba (1999)) on the James Clerk Maxwell Telescope (JCMT111The JCMT is operated by the Joint Astronomy Centre on behalf of PPARC for the United Kingdom, the Netherlands Organisation of Scientific Research, and the National Research Council of Canada.). SCUBA is comprised of two bolometer arrays, a short-wave array of 91 pixels optimised for operation at 450 m and a long-wave array of 37 pixels optimised for operation at 850 m. Both arrays simultaneously sample a similar field of view (approx 2′ square), although the spacing in between individual bolometers on the array means that not all of the field of view is sampled instantaneously. To fill in the gaps in spatial coverage the telescope secondary mirror is moved in a 64-point pattern (“jiggling”), whilst also chopping at a frequency of 1 Hz to remove the sky emission. This procedure is commonly known as a “jiggle-map” and provides maps with full spatial sampling at both wavelengths.
As each of our three target clouds is less than 2′ in diameter (from inspection of the DSS images) we obtained a single jiggle-map of each cloud, approximately centred on the cometary “head” of the clouds. The jiggle-maps were taken on the nights of the 7th January 2002 (SFO 11 & SFO 11E) and the 5th June 2002 (SFO 11NE), as part of a wider SCUBA survey of bright-rimmed clouds (Thompson et al. 2003a ). Observational parameters for each cloud are summarised in Table 1. The maps taken on the 7th January had chop throws set to 120″ to avoid chopping onto the array. During the data reduction of these maps it was noticed that the extended nature of the sources had led to some chopping onto emission at the edges of the field-of-view.The maps taken on the 5th June had chop throws set to the maximum of 180″ to avoid this problem. The chop directions for each cloud were chosen so that the sky positions did not lie on any of the other clouds in the complex or the extended dark nebular region to the south. SCUBA is installed at one of the Nasmyth foci on the JCMT and is not equipped with a beam rotator. The chopping was performed in sky coordinates so that the chop position stayed constant over each integration and did not rotate onto cloud emission. In addition to the maps of the three clouds we also obtained absolute flux calibration and beam maps of the primary flux calibrator Uranus and the secondary calibrator CRL 618. Hourly skydips at the azimuth of each observation were carried out to estimate the atmospheric zenith optical depth. These values were contrasted with the fixed-azimuth measurements at 225 GHz made every 10 minutes by the CSO tipping radiometer and both sets of measurements were found to be consistent.
The data were reduced using a combination of the automated SCUBA reduction pipeline ORACDR (Economou et al. oracdr (2002)), the SCUBA reduction package SURF (Jenness & Lightfoot surf (2000)) and the Starlink image analysis package KAPPA (Currie & Bell kappa (2002)). The reduction procedure for 450 and 850 m data was the same and followed the outline given in this paragraph. Initially the chopping and nodding positions were subtracted from the on-source data to form a time-ordered series of sky-subtracted bolometer measurements. As the bright-rimmed clouds are embedded in the larger molecular cloud complex W5, it is likely that the chopping procedure resulted in a subtraction of extended cloud emission from the flux levels in each map (particularly in the case of SFO 11E, see Sect. 3). The measured fluxes are thus strictly lower limits to the true flux. The time-ordered bolometer data were then corrected for atmospheric extinction using an optical depth value interpolated from skydips carried out before and after the jiggle-map. At this stage bolometers with a mean noise in excess of 100 nV were blanked and transient bolometer noise spikes were removed by applying a 5 clip to the data. Residual sky variations between individual bolometers were removed using the SURF task remsky. The time-ordered data were then regridded to J2000 sky coordinates with the SURF task rebin. In the case of SFO 11, where two separate jiggle-maps were obtained on the same night, rebin was used to co-add the maps.
Absolute flux calibration was carried out using the calibration maps of Uranus and CRL 618. Predicted fluxes for Uranus and CRL 618 were estimated using the values given by the Starlink package FLUXES (Privett, Jenness & Matthews fluxes (1998)) and on the JCMT calibrator webpage respectively. Flux correction factors (FCFs) for each wavelength were then determined by dividing the predicted flux by the measured peak value of the calibrator. Each jiggle-map was calibrated in units of Jy/beam by multiplying by the appropriate FCF. The FWHMs and peak values of the telescope main and error beams were determined by fitting two Gaussians to azimuthal averages of the maps of the primary calibrator (Uranus). These parameters are shown in Table 2.
| Map name | Night | Chop throw | Integrationsaafootnotemark: a | Average | R.m.s. noise (Jy/14″ beam)bbfootnotemark: b | ||
|---|---|---|---|---|---|---|---|
| 450 m | 850 m | 450 m | 850 m | ||||
| SFO 11 | 7th Jan 2002 | 120″ | 20 | 1.82 | 0.33 | 0.2 | 0.013 |
| SFO 11NE | 5th June 2002 | 180″ | 6 | 1.94 | 0.34 | 0.1 | 0.020 |
| SFO 11E | 7th Jan 2002 | 120″ | 10 | 1.82 | 0.33 | 0.3 | 0.018 |
| Night | Wavelength | Main Beam | Error Beam | ||
|---|---|---|---|---|---|
| (m) | FWHM (″) | Relative peak | FWHM (″) | Relative peak | |
| 7th Jan 2002 | 450 | 9.0 | 0.952 | 32.4 | 0.048 |
| 850 | 15.3 | 0.986 | 65.7 | 0.014 | |
| 5th June 2002 | 450 | 8.4 | 0.928 | 25.8 | 0.072 |
| 850 | 15.0 | 0.982 | 58.2 | 0.018 | |
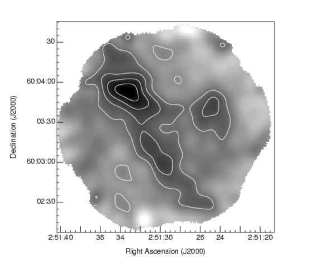
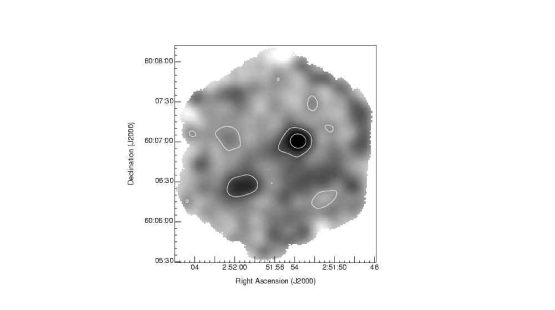
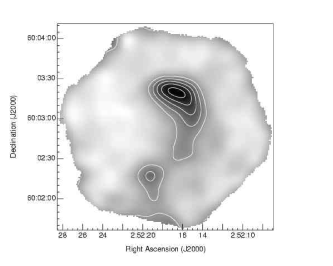
The calibrated images were then converted into FITS format and deconvolved to remove the contribution from the error beam. The deconvolution was performed using the clean task in MIRIAD (Sault, Teuben & Wright miriad (1995)) with a circularly symmetric two-component Gaussian beam derived from azimuthal averages of the primary calibrator maps (see Table 2 for the Gaussian fit parameters). Each image was cleaned down to a cutoff level of twice the 1 r.m.s. noise and then restored back to a resolution appropriate for the wavelength (8″ for 450 m and 14″ for 850 m). The advantage of this technique is that the different error beam contributions from each wavelength are removed, facilitating comparison of 450 m and 850 m maps and allowing the integrated fluxes to be determined more accurately. The clouds were found to be marginally detected at 450 m, with a peak S/N ratio of 4 at most. The native resolution 8″ 450 m maps were smoothed to the same resolution as the 850 m maps (14″) to increase their signal to noise ratio. The cleaned calibrated 450 & 850 m maps are shown in Fig. 2.
2.2 JCMT CO mapping
Maps of all three clouds in the 12CO and 13CO J=2–1 lines were obtained with the JCMT during April 1996 and January 1997. The heterodyne front-end receiver A2 was used along with a back-end digital autocorrelation spectrometer (DAS). All maps were obtained in raster-mapping mode, in which the telescope is scanned along a line on the sky, sampling spectra at regular time intervals to provide Nyquist or better spatial sampling. At the end of each line the telescope position-switches to a clean offset position so that the spectra may be sky-subtracted. To reduce the likelihood of rastering artifacts the maps were sampled at better than Nyquist sampling, with 6″ sampling intervals both parallel and perpendicular to the scan lines. The FWHM of the telescope beam at 230 GHz is 21″.
The integration time per map position was typically 6 seconds and in most cases two or three raster maps of each cloud were co-added to improve the signal to noise ratio. The only exception was the 12CO map of SFO 11, where only one raster map was observed. The atmospheric conditions during the observations were stable and good, with typical system temperatures of 400–500 K. The resulting 1 sensitivity of each map is between 0.5–1 K per 0.2 km s-1 channel. The velocities of the lines were observed relative to the Local Standard of Rest (LSR) and all the velocities quoted in this paper are on this scale.
SFO 11 SFO 11NE SFO 11E

The pointing accuracy of the telescope was checked regularly and found to be better than 3″. The data were calibrated to the antenna temperature scale using the standard chopper-wheel three-load technique of Kutner & Ulich (ku81 (1981)). Values on the scale are corrected for the atmosphere, resistive telescope losses and rearward spillowver and scattering. The data were then corrected for forward spillover and scattering to the corrected receiver temperature scale , where and is the forward spillover and scattering efficiency (0.8 for the JCMT at 230 GHz). All line temperatures quoted in this paper are on the scale unless otherwise indicated. Absolute calibration was performed by regularly checking the line temperatures of standard sources and comparing the observed values to standard values. The observed line temperatures are accurate to within 10%.
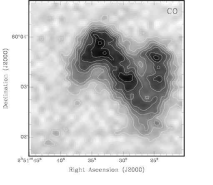
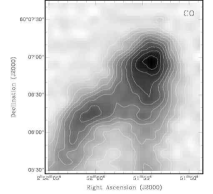
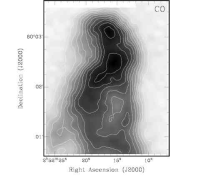
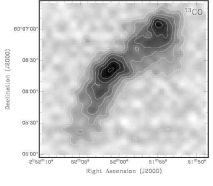
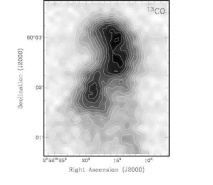
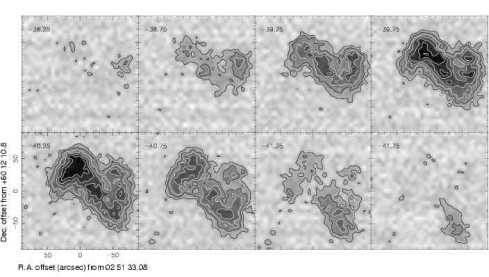
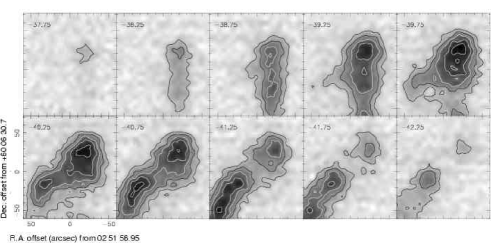
The data were reduced with the Starlink package SPECX (Prestage et al. specx (2000)). The distribution of the CO emission from each cloud was found to roughly follow that of the SCUBA dust continuum images, allowing for the slight difference in beam sizes (21″ for the 230 GHz CO observations and 14″ for the SCUBA images). The peak line temperatures range from 15–23 K for 12CO and 9–12 K for 13CO. The observed linewidths were extremely narrow, with typical FWHMs between 1–2 kms-1. The integrated intensity maps are shown in Fig. 3 and the channel maps may be found in Fig. 8.
2.3 Narrowband H imaging
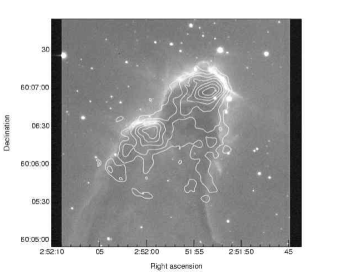
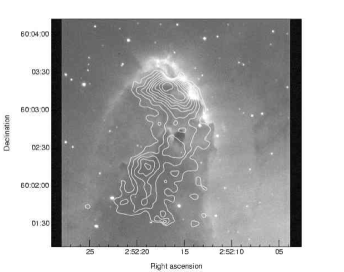
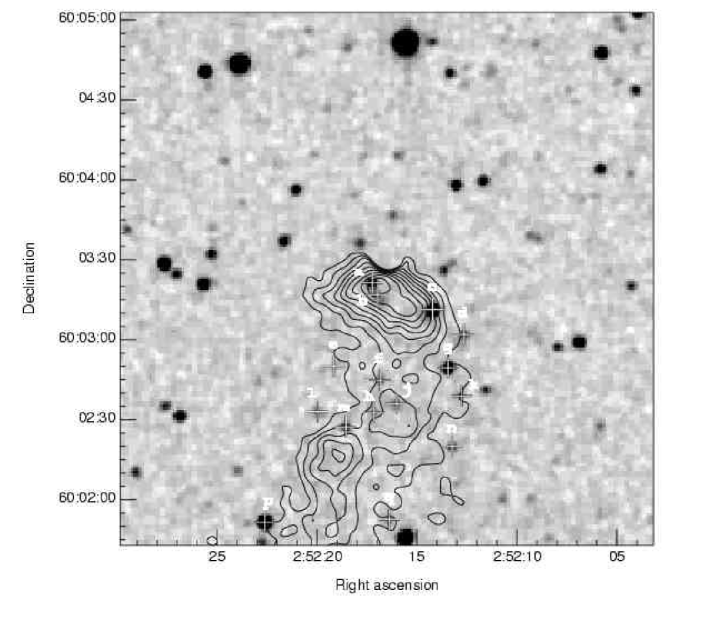
We obtained narrowband H images of each cloud at the 2.6 m Nordic Optical Telescope (NOT) in order to trace the bright optical rim of the clouds at high resolution and to search for the radial striations that are a clear signature of a photoevaporated flow. The images were taken on January 1st 1996 using the Brocam1 camera and a Tektronix 10241024 backside illuminated thinned CCD. The resulting images have a field of view of 33′ and a pixel scale of 018. The seeing during the observations was typically 075. The central wavelength and FWHM of the filter used to isolate the narrowband H emission were 656.4 nm and 3.3 nm respectively. The total exposure time for each image was 600s. The images were reduced, flatfielded and calibrated in the standard manner using IRAF (Tody iraf (1993)). The data were calibrated against the white dwarf standard star G193-74 (Oke oke90 (1990)) observed at a similar airmass. Astrometric calibration of the final flatfielded and processed images was carried out for each image by measuring the positions of several known stars from the USNO database and solving for the best fit using the astrometry routine in GAIA. The resulting astrometry of each image is good to within a single 018 pixel. The final processed images with the SCUBA 850 m emission overlaid as contours are shown in Fig. 4.
2.4 Archival data
Archival data were obtained to complement the JCMT SCUBA and CO observations. IRAS HIRES images in all four wavebands (12, 25, 60 & 100 m) were obtained from the NASA/IPAC Infrared Science Archive (http://irsa.ipac.caltech.edu) in order to extend the FIR wavelength coverage of each source and enable the spectral energy distribution (SED) to be measured. The angular resolution and signal to noise ratio of HIRES data varies depending upon the number of deconvolution iterations used and the position within the image. HIRES images are also subject to a number of processing artifacts, most notable of which are negative ”bowls” surrounding bright sources and known as ringing. We obtained HIRES images using the default processing parameters (20 iterations) with typical angular resolutions at 60 and 100 m of 9060″ and 120100″, which is only sufficient to identify the strongest cores in each SCUBA field as point sources. The 100 m images were found to be confused by a combination of ringing around a bright source found to the north of SFO 11 and strong emission from the rim of dust found to the south. Consequently, the 100 m fluxes could not be accurately measured and the 100 m data was discarded from any further analysis. At 60 m the ringing and southern dust rim were less apparent and integrated fluxes could be measured. An offset of 5 Jy was applied to the flux measurements of SFO 11NE SMM1 to take into account the flux depression caused by the negative ringing bowl surrounding this source. Both effects were completely negligible at 12 and 25m. The fluxes measured from the HIRES maps are contained in Table 3.
| Source ID | IRAS HIRES flux (Jy) | ||
|---|---|---|---|
| 12 m | 25 m | 60 m | |
| SFO 11 SMM1 | 0.60.1 | 1.40.1 | 17.00.7 |
| SFO 11NE SMM1 | 0.30.1 | 1.00.1 | 10.00.4 |
| SFO 11E SMM1 | 0.80.1 | 3.00.1 | 20.10.4 |
We also obtained 20 cm radio images of the three clouds from the NRAO VLA Sky Survey (NVSS; Condon et al. nvss (1998)) postage stamp server at (http://www.cv.nrao.edu/nvss), to derive the electron density and pressure in the ionised gas surrounding the clouds. The NVSS was a 20 cm sky survey complete North of = carried out using the VLA in its D-configuration. The resolution of NVSS is 45″ and the limiting 1 noise of the survey is 0.5 mJy. All three clouds are clearly detected in the NVSS data, as shown by the contours in Fig. 1. The NVSS data are not sensitive to smooth structures much larger than several arcminutes, which explains why the diffuse emission from the HII region IC 1848 is not visible in Fig. 1. The peak fluxes of the radio emission associated with the three clouds SFO 11, SFO 11NE and SFO 11E are 4.0, 4.9 and 11.6 mJy/beam respectively. Integrating the emission over each cloud yields total fluxes of 7.7, 8.8 and 37.0 mJy respectively.
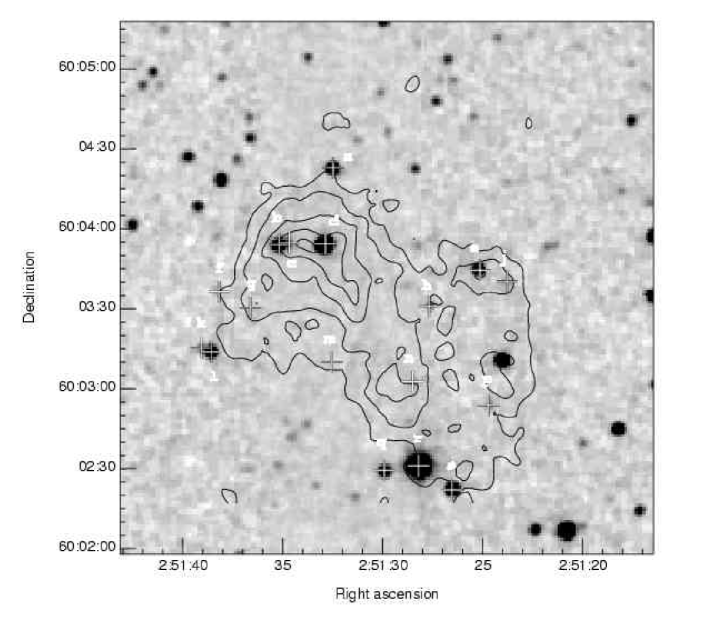
Near-infrared , and 2MASS Quicklook images (Cutri et al. 2mass (2003)) were obtained of each cloud to search for protostars and embedded young stellar objects (YSOs). The Quicklook images and photometric measurements of associated point sources were obtained from the 2MASS Quicklook image database and point source catalogue held at the NASA/IPAC Infrared Science Archive (http://irsa.ipac.caltech.edu). The Quicklook images are compressed using a lossy compression algorithm which does not conserve the low-level flux in the images. Accurate photometry from the Quicklook images is not possible and so we obtained photometric measurements from the 2MASS Point Source Catalogue. Each 2MASS image has a pixel scale of 1″ and the limiting magnitudes of the , and images are 15.8, 15.1 and 14.3 respectively. The band images of the three clouds, again overlaid by contours of SCUBA 850 m emission, are shown in Figs. 5–7.
3 Analysis
3.1 Core positions, sizes and fluxes
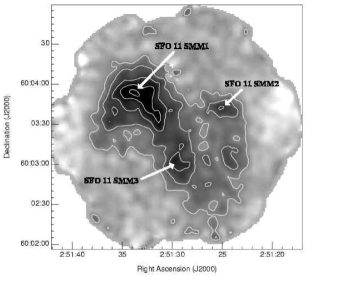
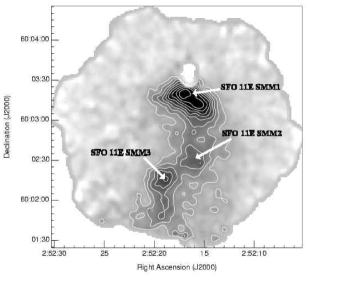
Individual sources were identified from visual inspection of the SCUBA maps as discrete objects (i.e. bounded by unbroken contours) with peak fluxes greater than 3. The positions of each sub-mm dust core were determined by fitting centroids to the 850 m jiggle-maps as these maps possess the highest signal to noise ratios. We designated each core as the cloud name from Ogura, Sugitani & Pickles (osp02 (2002)) followed by an SMM number to indicate sub-mm detections (e.g. SFO 11E SMM1). The positions of each core are listed in Table 4. In total 8 sub-mm cores were identified, with the brightest cores generally located at the head of each bright-rimmed cloud. The “double-lobed” core SFO 11E SMM1 is marginally resolved at 850 m but it was not possible to fit a centroid to each peak and so this source is treated hereafter as a single core. We inspected the unsmoothed 450 m map in order to try to separate these two cores, however the signal to noise ratio was found to be too low to adequately distinguish the cores. Higher quality 450 m images or mm-wave interferometry of SFO 11E SMM1 are needed to separate this core into its two components.
The size of each source was estimated by the FWHM of a Gaussian fitted to the azimuthal 850 m flux average (again, because of the higher signal to noise ratio). We took into account the beam size via assuming a simple convolution of a Gaussian source with a Gaussian beam of 14″ (). It was not possible to fit azimuthal averages to the two cores SFO 11 SMM1 and SFO 11 SMM2 because of their irregular shape. Therefore, estimates for their sizes listed in Table 4 represent the average diameter as defined by their 50% flux contours. The angular diameter of each core was converted into an effective physical diameter by assuming each core lies at the same distance as IC 1848, i.e. 1.9 kpc. The effective physical diameters for each core are given in Table 4 and are found to be in the range 0.1–0.3 pc, which is typical for cores found in star-forming regions (e.g. Evans evans99 (1999)).
There is good agreement between the morphology of the SCUBA maps and the 12CO and 13CO maps. The difference in core positions measured from the SCUBA maps and CO maps are well within the typical pointing errors (3″). The SCUBA maps are of higher angular resolution than the CO maps (14″ vs 21″) and the typical pointing residuals were lower during the SCUBA observations. Quoted core positions are those measured from the SCUBA jiggle-maps. The core sizes determined via fits to the azimuthal averages of the 13CO emission are consistent with those determined from the 850 m jiggle-maps, whereas those determined from the 12CO maps are in general 10% larger than those measured from the 850 m images. It is likely that the 12CO, by virtue of its large optical depth, traces the temperature of the opaque material lying close to the surface of the cloud rather than the column density.
We measured the peak and integrated continuum flux values for each core using the Starlink package GAIA (Draper, Gray & Berry gaia (2002)). Apertures were carefully chosen by hand to avoid confusion from nearby sources. Background levels were estimated from emission-free regions of each map and subtracted from the measured flux values. The jiggle-maps of SFO 11E were found to possess a significantly negative background, which was most likely caused by chopping onto extended cloud emission from the dust ridge found to the West of SFO 11E. Peak and integrated fluxes for the three cores in this map were determined by adding a constant background level of 2.5 Jy/beam to the 450 m data and 46 mJy/beam to the 850 m data. These background levels were determined by fitting baselines to emission-free regions of the jiggle-maps.
We estimate that the systematic errors in measuring the fluxes of all 8 cloud cores are no more than 30% in the case of the 450 m measurements and 10% for the 850 m measurements (including errors in the absolute flux calibration). The systematic errors for the cores detected in the map of SFO 11E may be larger than these values, given the addition of a constant background level to the map, however we estimate that the increased systematic error is no larger than 50%. The cores SFO 11E SMM1 and SMM2 could not be separated at 450 m due to the lower signal-to-noise ratio in this image. The integrated 450 m flux for this core was determined by integrating over an aperture of the same size and position as that used for the 850 m measurement. The peak and integrated fluxes are listed in Table 4.
| Peak Flux (Jy/beam) | Integrated Flux (Jy) | ||||||
|---|---|---|---|---|---|---|---|
| Clump ID | 450 m | 850 m | 450 m | 850 m | (pc) | ||
| SFO 11 SMM1 | 02 51 33.7 | +60 03 54 | 1.20.2 | 0.230.01 | 8.11.4 | 1.420.15 | 0.28aafootnotemark: a |
| SFO 11 SMM2 | 02 51 25.0 | +60 03 42 | 0.70.2 | 0.150.01 | 5.20.9 | 0.530.06 | 0.20aafootnotemark: a |
| SFO 11 SMM3 | 02 51 29.6 | +60 03 01 | 0.70.2 | 0.130.01 | 2.50.6 | 0.270.05 | 0.20bbfootnotemark: b |
| SFO 11NE SMM1 | 02 51 53.6 | +60 07 00 | 1.60.1 | 0.340.02 | 4.00.5 | 0.920.10 | 0.24bbfootnotemark: b |
| SFO 11NE SMM2 | 02 51 59.5 | +60 06 27 | 1.00.1 | 0.250.02 | 2.70.3 | 0.540.08 | 0.16bbfootnotemark: b |
| SFO 11E SMM1 | 02 52 16.8 | +60 03 19 | 5.80.3 | 0.480.02 | 15.51.4 | 1.290.10 | 0.27bbfootnotemark: b |
| SFO 11E SMM2 | 02 52 15.9 | +60 02 29 | – | 0.210.02 | 3.90.7ccfootnotemark: c | 0.340.25 | 0.12bbfootnotemark: b |
| SFO 11E SMM3 | 02 52 19.0 | +60 02 17 | 2.70.3 | 0.260.02 | 3.20.5 | 0.400.23 | 0.11bbfootnotemark: b |
3.2 Core velocities
SFO 11
SFO 11NE
SFO 11E
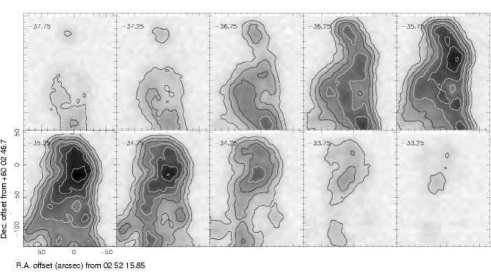
The velocity distribution of the molecular gas in the clouds was examined by constructing channel maps of the 12CO emission (Fig. 8). The emission was integrated over velocity bins of width 0.5 km s-1 over the entire range of velocities observed in the CO spectra. Channel-maps of the 13CO emission were also inspected, however the reduced signal-to-noise ratio of the 13CO maps meant that these data were of little use for inspecting the velocity distribution of the molecular gas. The channel maps show that the bulk of the gas in the clouds is at roughly the same velocity. The molecular gas of the clouds is clearly revealed as possessing a clumpy structure in which the SCUBA sub-mm cores can be identified with discrete features in the 12CO channel maps. It is thus likely that the SCUBA sub-mm cores are true dense cores of dust and gas embedded within the molecular clouds.
Whilst the bulk of the gas is roughly at the same velocity there are two velocity-shifted features (with respect to the central cloud velocity) seen in the channel maps of SFO 11 and SFO 11NE. The most southerly clump of gas centred roughly at the velocity of 40.75 km s-1 in the channel map of SFO 11 is displaced from the molecular gas at the head of the cloud by 1 km s-1 towards the blue end of the spectrum. The North-South bar of CO emission centred at approximately -38.75 km s-1 in the channel map of SFO 11NE is similarly displaced towards the red end of the spectrum with respect to the remainder of the cloud. It is likely that these velocity displacements arise through the momentum transferred to the body of the clouds by the photoevaporated surface layers. This phenomenon is well documented in photoionisation models (Oort & Spitzer os55 (1955); Bertoldi bertoldi (1989); Lefloch & Lazareff ll94 (1994)) and velocity displacements between the head and tails of cometary clouds have been observed in several objects (e.g. Codella et al. cbnst01 (2001); White et al. rosette (1997)).
The North-South bar seen in the channel map of SFO 11NE is also positionally coincident with faint H emission at the western edge of the cloud and weak 850 m emission stretching to the south of SFO 11NE SMM1 (see Fig. 2). The positional coincidence of these features suggests that as the gas at the western edge of the cloud is pushed inwards by the photoevaporation of the surface layer its density may be enhanced. Whilst this is in line with the predictions that the photoionisation shock may form dense clumps or cores via implosion, this potential density enhancement is not observed in either SFO 11 or SFO11E. The rims of these clouds do not show any evidence for enhanced CO or dust emission. In each case the sub-mm continuum and CO emission decreases towards the rim with a sharp boundary at the bright optical rim of the cloud.
Unlike other CO observations of bright-rimmed clouds (e.g. White at al. 1997) there is no evidence in the channel maps for bright molecular rims that are displaced in velocity from the interior gas. The reasons behind this are probably the limited angular resolution of these observations (21″) compared to the other observations and also the fact that the CO J=2–1 lines probe lower temperature regions more likely to be located deeper within the rims of the clouds that the higher J transitions observed by White et al. (rosette (1997)).
3.3 Evidence for molecular outflows?
The channel maps and raw spectra were inspected for evidence of non-Gaussian line wings that might indicate the presence of molecular outflows. Both SFO 11NE SMM1 and SFO 11E SMM1 show some evidence for molecular outflows in the form of moderate velocity line wings up to 4–5 kms-1 from the line centre. The remaining cores in the sample do not show any evidence for non-Gaussian line wings. Integrated intensity maps of both the red and blue line wings were formed, but the angular resolution in the maps (21″) is insufficient to separate any outflow lobes.
It is possible that the wing emission results from photoevaporated molecular gas streaming from the cloud surface. Prominent blue-shifted wings are predicted by radiative-driven implosion models for the collapse phase of the cloud (Lefloch & Lazareff ll94 (1994)). The striations seen in the H images show that there is a flow of photoionised (and presumably photoevaporated) gas from the surface of all three clouds. If the line wings arise from a photoevaporated gas flow then we might expect to see broad line wings toward all three clouds rather than just SFO 11NE and SFO 11E.


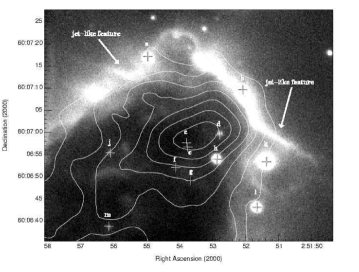
The images offer support for the outflow hypothesis in the case of SFO 11NE SMM1. There are two jet-like features seen towards the head of SFO 11NE (see Fig. 10 for a closeup). The jet-like features are not normal to the cloud surface or aligned with the direction of the UV illumination and so it is unlikely that they result from photoevaporated flow from the cloud surface. The two features are roughly aligned with each other which suggests that they may originate from a common perhaps protostellar source. A similar feature was observed in the H emission from the bright-rimmed cloud TC2 in the Trifid nebula and attributed to the well-known photoionised jet HH 399 (Lefloch et al. lcrmch02 (2002)). It is likely that we have observed a similar phenomenon associated with SFO 11NE and that the jet-like features indicate the location of an embedded protostar or YSO. The alignment of the two jet-like features does not, however, correlate with the positions of either the sub-mm peak or objects seen in the near-infrared 2.2 m 2MASS image of SFO 11NE. This may indicate the presence of an additional unseen protostellar source within SFO 11NE SMM1, located at the intersection of the two jet-like features.
In summary we conclude that the line wings are more likely to result from protostellar outflow than a photoevaporated molecular flow. However, further investigation is required to more conclusively support this hypothesis. Higher resolution, possibly interferometric, CO observations are needed to resolve the individual outflow lobes and optical spectroscopy of the two jet-like features associated with SFO 11NE is required to confirm that these two features are indeed photoionised jets.
3.4 Temperature, mass and density
The temperature, density and mass of each core has been derived independently from both the SCUBA dust continuum images and the CO maps. In this section we present the results from the standard analysis techniques used to derive these quantities.
3.4.1 Dust continuum
In order to derive the physical properties of each core from their dust continuum emission we fitted a single-temperature greybody model to their Spectral Energy Distributions (SEDs). For the SMM1 cores we were able to construct SEDs from a combination of the SCUBA 450 & 850 m and IRAS HIRES 60 m integrated fluxes. We discarded the IRAS 12, 25 and 100 m fluxes from the fitting procedure as the former two wavelengths are not typically well fitted by a single-temperature greybody and the latter wavelength was hopelessly confused due to the limited angular resolution. For the SMM2 and SMM3 cores we were restricted to SEDs comprised of only the SCUBA 450 and 850 m integrated fluxes.
In order to determine the temperature of the dust we initially fitted the SEDs of the SMM1 cores with a model following a greybody function of the form:
| (1) |
where is the flux emitted at frequency , is the solid angle subtended by the core, is the Planck function evaluated at frequency and dust temperature , and is the optical depth at frequency (e.g. Dent, Matthews & Ward-Thompson dmwt98 (1998)). A common practice is to parameterise the optical depth in terms of the dust emissivity so that may be evaluated at arbitrary frequencies from a known reference frequency and optical depth , i.e. . The typical values for the dust emissivity observed in molecular clouds range from 1–2 (e.g. Hildebrand hildebrand83 (1983)).
The greybody analysis is an extreme simplification of the dust properties, assuming a single effective temperature for the dust, a simple power-law extrapolation for the frequency-dependent optical depth and a constant dust emissivity over a large wavelength range. The greybody approach nevertheless has been used to predict dust properties that are often reasonably consistent with those derived from more complex radiative transfer models (Dent, Matthews & Ward-Thompson dmwt98 (1998)). As the cores are only moderately spatially resolved by our SCUBA observations and we possess only limited data on the SEDs at 60, 450 and 850 m it was felt that a more complex analysis was unwarranted.
As the SEDs of the SMM1 cores are only defined by three points we assumed a fixed value of to reduce the number of fitted parameters. For the remaining cores in the sample the dust temperature was determined by the 450 m/850 m flux ratio, again assuming . The dust temperatures evaluated by these methods are shown in Table 5. The accuracy in the dust temperature is roughly 1–2 K for the SMM1 cores where we could fit the greybody model to three flux points. The uncertainties in the remainder of the sample are considerably more inaccurate: two sub-mm flux points do not constrain high temperature values particularly well due to a fifth power term (assuming ) in the flux ratio. The lower temperature bounds are better constrained and overall we estimate that the temperature estimates for the SMM2 and SMM3 cores are good to within a factor of 2.
| Source ID | |||||
|---|---|---|---|---|---|
| (K) | cm-3 | ||||
| SFO 11 SMM1 | 23 | 20.6 | 4.6 | 11.5 | 1.3 |
| SFO 11 SMM2 | 32 | 4.9 | 4.4 | 5.4 | 0.6 |
| SFO 11 SMM3 | 27 | 3.1 | 4.2 | 3.5 | 0.4 |
| SFO 11NE SMM1 | 23 | 13.4 | 4.6 | 10.2 | 1.1 |
| SFO 11NE SMM2 | 11 | 26 | 5.4 | 45.7 | 5.1 |
| SFO 11E SMM1 | 23 | 18.7 | 4.6 | 11.2 | 1.3 |
| SFO 11E SMM2 | 76 | 1.1 | 4.4 | 3.4 | 0.4 |
| SFO 11E SMM3 | 19 | 7.7 | 5.3 | 25.8 | 2.9 |
Masses for the cores were determined by using the standard method of Hildebrand (hildebrand83 (1983)) for an optically thin molecular cloud with a uniform temperature. The total mass (dust plus gas mass) of the cloud is given by
| (2) |
where is the distance to the cloud, is the observed flux density and is the Planck function evaluated at frequency and dust temperature . The parameter is a mass conversion factor combining both the dust-to-gas ratio and the frequency-dependent dust opacity . As with the dust optical depth , the mass conversion factor is assumed to follow a power-law over frequency, i.e. .
Various values for are quoted in the literature, ranging from 21.4 g cm-2 (Krügel & Siebenmorgen ks94 (1994)) to 286 g cm-2 (Draine & Lee drainelee84 (1984)). For comparison the canonical value quoted in Hildebrand (hildebrand83 (1983)) is 116 g cm-2. All of these values have been normalised to the appropriate value at 850 m. The larger values of were calculated for the diffuse ISM and are not appropriate for these investigations of denser molecular cores. The smaller values of are more appropriate for cold dense regions of the ISM. For this analysis we have adopted a value for of 50 g cm-2 at 850 m, following the method of Kerton et al. (kerton (2001)) and the approximate value for moderate density regions ( cm-3) quoted by Ossenkopf & Henning (oh94 (1994)). In any case the values for core mass given here may be linearly rescaled by another mass conversion factor.
The core masses were evaluated from the integrated 850 m fluxes quoted in Table 4 and the dust temperatures given in Table 5. The solid angle subtended by each core was calculated from the effective core diameter and the distance to each core was assumed to be that of IC 1848, i.e. 1.9 kpc. The core masses are shown in Table 5. From the mass of each core and its effective diameter we have also evaluated the H2 number density , also shown in Table 5.
The uncertainties in the mass and density (neglecting the spread in quoted values for C are dominated by temperature effects in the non-linear Planck function in Eq. (2). A change of only a few degrees Kelvin in dust temperature can alter the derived mass by a factor of 2 or more. For the SMM2 and SMM3 cores, where the temperature estimates may only be good to a factor of 2 the derived mass has a considerably wider range of up to a factor of 10, depending upon the signal-to-noise ratio of the sub-mm fluxes. The worst offender is SFO 11E SMM2 where the low signal-to-noise ratio means that our mass estimate is good to only within 1–11 M⊙, whilst for SFO 11NE SMM2 the high signal-to-noise ratio allows us to constrain the mass of the core to within 13–46 M⊙. For comparison the uncertainty in mass due to the estimated error in the integrated flux is typically 10–20%, although for the fainter cores SFO 11 E SMM2 & SMM3 this is raised considerably.
It is also possible to derive the visual and infrared extinctions toward each core from their sub-mm fluxes, as the sub-mm flux provides a direct estimate of the column density of dust toward each core. The relationship between the observed sub-mm flux density and visual extinction is given by Mitchell et al. (mjmft01 (2001)) as
| (3) |
The total opacity of both gas and dust is represented by , which is functionally equivalent to the reciprocal of the mass conversion factor . The mass of interstellar material is written as which is in units of hydrogen nuclei, is the conversion factor between column density of hydrogen nuclei and the selective absorption and is the ratio between visual extinction and and the selective absorption. Following Mitchell et al. (mjmft01 (2001)) and references contained therein we assume values of cm-2 mag-1 and . Also of interest are the infrared extinctions towards each core, as the recent full data release of the 2MASS all sky survey makes it possible to search each core for embedded protostars or YSOs. The relationship between sub-mm flux and visual extinction contained in equation 3 may be converted to K-band extinction by multiplying by the ratio between visual and infrared extinctions. We assume this ratio to be , following Rieke & Lebofsky (rl85 (1985)). Source-averaged visual and K-band extinctions calculated using Eq. (3) and the integrated 850 m flux of each core are shown in Table 5.
The typical K-band extinction is around one or two magnitudes, with SFO 11NE SMM2 possessing the largest value of mag. Is 2MASS likely to be a reasonably complete survey of these cores? We may examine this possibility by using the Zinnecker et al. (zinn93 (1993)) relation between stellar mass and absolute magnitude. Using this relation a 1 star 3 years old has an apparent K-band magnitude of 13 at 1.9 kpc. The limiting K-band magnitude of 2MASS is approximately 14.3 (Cutri et al. 2mass (2003)) and so for most of the cores in the sample 2MASS is complete down to the order of a solar mass or so. Of course the extinctions calculated here assume that the embedded protostars or YSOs are obscured by a column density throughout the full depth of the core (). If this is not the case then 2MASS may be sensitive to significantly lower mass protostars or YSOs. We will return to the 2MASS data in more detail in Sect. 3.5.
3.4.2 CO measurements
| 12CO J=2–1 | 13CO J=2–1 | |||||
|---|---|---|---|---|---|---|
| Source ID | Peak | FWHM | Peak | FWHM | ||
| (kms-1) | (K) | (kms-1) | (kms-1) | (K) | (kms-1) | |
| SFO 11 SMM1 | -40.0 | 16.5 | 1.6 | -40.0 | 5.9 | 1.2 |
| SFO 11 SMM2 | -40.0 | 14.0 | 1.8 | -39.9 | 4.6 | 1.4 |
| SFO 11 SMM3 | -39.8 | 9.5 | 2.0 | -39.7 | 3.3 | 1.6 |
| SFO 11NE SMM1 | -40.1 | 9.5 | 2.5 | -40.0 | 5.3 | 1.8 |
| SFO 11NE SMM2 | -40.9 | 10.3 | 2.5 | -41.0 | 3.9 | 2.1 |
| SFO 11E SMM1 | -35.3 | 10.1 | 2.2 | -35.2 | 4.9 | 1.7 |
| SFO 11E SMM2 | -35.3 | 17.5 | 2.2 | -35.3 | 5.6 | 1.7 |
| SFO 11E SMM3 | -35.8 | 12.4 | 2.7 | -35.6 | 5.0 | 2.0 |
In order to determine the temperature and density of the molecular gas from the CO maps it is first necessary to estimate the optical depth of the 12CO and 13CO transitions. The optical depth may be derived from the ratio of the brightness temperatures of two isotopomeric lines, assuming a fixed isotopic ratio. The 12C/13C ratio was taken to be the standard interstellar value of 60 (Frerking, Langer & Wilson flw82 (1982)). The relation between brightness temperature and optical depth follows the form:
| (4) |
where , , and are the brightness temperatures (or corrected receiver or antenna temperatures) and peak optical depths of the 12CO and 13CO lines respectively. and are related by where is the 12C/13C ratio.
A source-averaged spectrum was constructed for each core by averaging the spectra across each core with the package kview (Gooch kview (1995)). The peak line temperature , FWHM and central velocity of each source-averaged line were measured by fitting Gaussian line profiles to the data. The source-averaged line parameters are shown in Table 6 and optical depths for the 12CO and 13CO J=2–1 lines are shown in Table 7. The line ratios reveal that the 12CO line is optically thick towards all of the cores, with typical optical depths between 25 and 50. 13CO, on the other hand, is only moderately optically thick with typical values of 0.4–0.8.
The excitation temperature of the gas was determined from the peak brightness temperature ( of the optically thick 12CO line. Here, we assume that the gas in the cores is in Local Thermodynamic Equilibrium (LTE) and so can be described by a single excitation temperature . The excitation temperatures were calculated using the Rayleigh-Jeans relation between brightness and excitation temperature for optically thick lines, neglecting any background contribution. It was also assumed that the brightness temperature . The excitation temperature may also be assumed to be roughly equal to the kinetic temperature .
| Source ID | Optical depth | ||||
|---|---|---|---|---|---|
| (K) | 12CO | 13CO | (cm-2) | (cm-3) | |
| SFO 11 SMM1 | 22 | 26.4 | 0.4 | 21.4 | 3.4 |
| SFO 11 SMM2 | 19 | 24.1 | 0.4 | 21.3 | 3.5 |
| SFO 11 SMM3 | 14 | 25.1 | 0.4 | 21.1 | 3.4 |
| SFO 11NE SMM1 | 14 | 48.2 | 0.8 | 21.5 | 3.6 |
| SFO 11NE SMM2 | 15 | 28.5 | 0.5 | 21.4 | 3.7 |
| SFO 11E SMM1 | 15 | 39.4 | 0.7 | 21.4 | 3.5 |
| SFO 11E SMM2 | 23 | 23.2 | 0.4 | 21.5 | 3.9 |
| SFO 11E SMM3 | 17 | 31.1 | 0.5 | 21.5 | 3.9 |
The column density of the molecular gas was determined using standard LTE analysis of the 13CO J=2–1 observations. To relate the observed integrated line intensity to the optical depth and column density we used the equation given by White & Sandell (ws95 (1995)), where the column density may be written
| (5) |
where is in cm-2, is the integrated intensity of the line measured in K kms-1, is the frequency of the line in GHz, is the dipole moment of the molecule in Debyes, is the lower rotational quantum number (1 for the J=2–1 transition), is the excitation temperature in K, and is the peak optical depth of the line as evaluated from Eq. (4). The dipole moment of the CO molecule was taken to be 0.11 D and a value of 220.3987 GHz was used for the rest frequency of the 13CO J=2–1 transition (from the JPL Molecular Spectroscopy database available at http://spec.jpl.nasa.gov). Integrated line intensities were determined from Gaussian fits to the source-averaged 13CO spectra using the relation , where is the FWHM of the line. The column densities so derived are thus source-averaged rather than beam-averaged. The 13CO column densities calculated using Eq. (5) were then converted into a 12CO column density by multiplying by the standard 12C/13C interstellar ratio of 60 and then into an H2 column density by assuming the typical 12CO/H2 abundance ratio of 10-4 (e.g. Bachiller & Cernicharo bc86 (1986)). The resulting H2 column densities are given in Table 7.
The source-averaged column densities were scaled to a source-averaged number density of H2 molecules by assuming that the cores are spherical with a depth of . The source averaged number densities are shown in Table 7. These 13CO-derived values for the H2 number density are roughly an order of magnitude smaller than those obtained from the sub-mm continuum emission in Sect. 3.4.1. At first sight this may be taken for evidence that the CO abundances in the cores may be depleted by freeze-out onto grain mantles, however the uncertainties in the dust-derived densities, which may be up to an order of magnitude, preclude a definitive statement. A more likely cause of the low 13CO abundance is that the 13CO at the molecular boundary of the cloud is selectively photodissociated by the incident FUV field. The FUV photodissociation rate of 13CO may be up to an order of magnitude higher than that of 12CO (van Dishoeck & Black vdhb88 (1988)). Observations of less abundant CO isotopomers and more detailed modelling of the dust emission and photochemistry of the molecular gas are required to address these issues further.
3.5 Infrared objects associated with the clouds
The 2MASS Point Source Catalogue (Cutri et al. 2mass (2003)) was used to locate infrared sources associated with each cloud. Our analysis of the SCUBA 850 m fluxes in Sect. 3.4.1 indicates that the 2MASS catalogue is complete for embedded objects of down to roughly a solar mass. A total of 52 objects were found to be located within the optical boundaries of the clouds and are labelled in Figs. 5–7.
We classified each infrared object using the – vs – colour diagram method described in Lada & Adams (la92 (1992)). The , and magnitudes of each object were taken from the 2MASS Point Source Catalogue and their – & – colours are plotted in Fig. 11. Reddening tracks for giant and main-sequence stars were determined from the photometric data of Koornneef (koornneef83 (1983)). A similar track was determined for Classical T-Tauri stars using the published locus from Meyer, Calvet & Hillenbrand (mch97 (1997)).

As an object is subjected toward higher extinctions, either by increasing interstellar or circumstellar dust, it moves up toward the top of Fig. 11 parallel to the reddening tracks. Objects found between the left-hand and middle reddening tracks are thus likely to be reddened giant or main sequence stars (Lada & Adams la92 (1992)). Classical T Tauri stars (also known as Class II objects) are more reddened than main sequence stars, due to the presence of excess near-infrared emission from their circumstellar disks. Those objects found between the middle and right-hand tracks are candidate Classical T Tauri stars (Meyer, Calvet & Hillenbrand (mch97 (1997)). Class I protostars are surrounded by extended envelopes as well as circumstellar disks and are hence more reddened than the Classical T Tauri stars. Objects lying to the right of the rightmost dashed line in Fig. 11) are thus class I protostellar candidates.
| Figure Label | 2MASS PSC ID | Type | |||
|---|---|---|---|---|---|
| SFO 11 | d | 02513283+6003542 | 1.480.04 | 1.080.04 | TTS∗ |
| f | 02513815+6003364 | 0.440.25 | 0.19 | RMS/TTS | |
| j | 02512374+6003399 | 0.350.26 | 1.13 | RMS/TTS/YSO | |
| n | 02512848+6003024 | 0.620.20 | 0.87 | RMS/TTS/YSO | |
| SFO 11NE | b | 02515212+6007102 | 1.160.04 | 0.840.04 | TTS |
| c | 02515380+6006581 | 2.31 | 1.85 | RMS/TTS/YSO | |
| e | 02515377+6006571 | 1.32 | 2.80 | RMS/TTS/YSO | |
| f | 02515413+6006524 | 2.040.18 | 1.300.12 | RMS/TTS | |
| h | 02515288+6006545 | 0.220.09 | 0.270.13 | RMS/TTS | |
| j | 02515610+6006555 | 1.1940.18 | 0.610.16 | RMS/TTS | |
| m | 02515614+6006390 | 1.080.18 | 0.680.16 | RMS/TTS | |
| p | 02515279+6006294 | 2.130.12 | 1.320.05 | RMS/TTS | |
| q | 02515975+6006394 | 1.070.06 | 0.720.06 | RMS/TTS∗ | |
| s | 02520131+6006154 | 1.220.08 | 0.780.07 | RMS/TTS | |
| t | 02515741+6006125 | 0.780.26 | 0.590.26 | RMS/TTS | |
| v | 02515136+6006112 | 0.380.06 | 0.170.08 | RMS/TTS | |
| SFO 11E | c | 02521422+6003114 | 1.030.05 | 0.750.05 | TTS |
| e | 02521916+6002501 | 1.0820.23 | 0.37 | RMS/TTS/YSO | |
| f | 02521685+6002449 | 1.320.24 | 1.230.16 | TTS/YSO | |
| h | 02521715+6002328 | 0.750.18 | 0.640.20 | RMS/TTS | |
| j | 02521602+6002361 | 0.930.14 | 0.490.16 | RMS/TTS | |
| k | 02521275+6002390 | 0.600.24 | 0.740.26 | RMS/TTS/YSO | |
| l | 02521997+6002331 | 0.490.13 | 0.390.15 | RMS/TTS | |
| m | 02521856+6002274 | 1.010.14 | 0.930.12 | TTS/YSO | |
| p | 02525660+6001515 | 0.440.04 | 0.270.04 | RMS/TTS | |
| q | 02521639+6001526 | 0.840.18 | 0.710.19 | RMS/TTS | |
The – vs – demarcation between reddened main-sequence stars, classical T Tauri stars and class I protostars is not as clear cut as Fig. 11 suggests. Lada & Adams (la92 (1992)) note that although main sequence stars and YSOs occupy different regions of the colour-colour diagram, the individual YSO types (such as weak-line T Tauris, classical T Tauris, class I protostars and Herbig AeBe stars) may overlap somewhat. Nevertheless the – vs – colour-colour diagram is a useful technique to identify those cores currently forming stars, whether their evolutionary state is at the Class I stage or advanced toward the T Tauri stage. In Table 8 we list the infrared objects associated with each cloud that satisfy the Lada & Adams (la92 (1992)) and Meyer, Calvet & Hillenbrand (mch97 (1997)) criteria for class I protostars or T Tauri stars. Where the errors in the – and – colours preclude a unique classification we have listed the alternatives.
Table 8 reveals that the 2MASS photometry of the objects associated with the clouds is highly uncertain and with the existing data it is not possible to make a definitive statement about the young stellar or protostellar content of each cloud. Many of the objects associated with the clouds may be equally classified as either reddened main sequence stars or T Tauri stars. Nevertheless we note that each cloud possesses at least one object whose colours are not consistent with those of a reddened main sequence star (source d associated with SFO 11; sources b and c associated with SFO 11NE; sources c, f and m associated with SFO 11E). Following the classification system of Lada & Adams (la92 (1992)) and Meyer, Calvet & Hillenbrand (mch97 (1997)) the infrared colours of these objects are consistent with either T Tauri stars or class I protostellar objects. Two of these candidates are also confirmed as a weak-line T Tauri (02513283+6003542) and classical T Tauri (02515975+6006394) via their H emission lines (Ogura, Sugitani & Pickles osp02 (2002)).
The 2MASS data lends support to the hypothesis that each cloud is a site of recent or ongoing star formation, as at least one young stellar object or protostar is identified with each cloud. If even a fraction of the T Tauri candidates are indeed bona fide T Tauri stars then each cloud may be home to a cluster of young stellar objects and/or protostars. More accurate photometry at , , and perhaps in the band (Meyer, Calvet & Hillenbrand mch97 (1997)) is required to investigate the nature of the infrared objects associated with these clouds.
The bright-rimmed cloud core SFO 11NE SMM1 is host to the greatest number of embedded YSO and protostar candidates. These infrared sources are distributed along the long axis of the cloud as seen in the SCUBA maps (see Fig. 6) in a manner suggestive of the small scale sequential star formation scenario of Sugitani, Tamura & Ogura (sto95 (1995)), i.e. with the stellar clusters elongated toward the exciting star of the bright-rimmed cloud. However, without a more accurate classification of the protostar and T Tauri candidates it is not possible to determine whether there is a smooth progression of earlier evolutionary type deeper into the cloud as would be expected in the small scale sequential star formation scenario (Sugitani, Tamura & Ogura sto95 (1995)). More accurate photometry and higher resolution observations are required to investigate the potential of SFO 11NE SMM1 as a candidate for the small scale sequential star formation process proposed by Sugitani, Tamura & Ogura (sto95 (1995)).
3.6 The pressure balance between ionised and molecular gas
Radiative driven implosion models of bright-rimmed cometary clouds (Bertoldi bertoldi (1989); Lefloch & Lazareff ll94 (1994)) predict that the evolution of the cloud is largely controlled by the pressure balance between the cloud interior and exterior. As the clouds are exposed to the UV flux from a nearby OB star (or stars) their surfaces become ionised. A photoionised sheath of gas, known as an ionised boundary layer or IBL, develops around the cloud and a significant fraction of the impinging UV photons may be trapped in this layer. Photoionised and photoevaporated gas also flows normally from the cloud surface following the decreasing density found at an increasing distance from the cloud surface. The clearly visible striations seen perpendicular to the cloud rims in the narrowband H images (Fig. 4) show that this outwards flow of photoionised gas is occurring in the three clouds in this study.
As the IBL and the photoionised flow develop, a photoionisation shock is driven into the molecular gas of the clouds. Depending upon the balance between the interior molecular pressure of the cloud and the exterior pressure of the photoionised sheath or IBL this shock may either stall at the surface or propagate through the molecular gas, followed by a D-critical ionisation front. If the cloud is underpressured with respect to the IBL or in pressure equilibrium with the IBL, the photoionisation shock and following D-critical ionisation front progress through the cloud, leading to its complete ionisation and dispersal within a few Myr. On the other hand if the cloud is overpressured with respect to the IBL then the shock stalls at the cloud surface until the growing density (and hence pressure) of the IBL reach equilibrium with that of the cloud. When pressure equilibrium is reached the ionisation front becomes D-critical and the shock and ionisation front will continue their propagation into the cloud. The important result from the RDI models is that the evolution of the bright-rimmed clouds depends mainly upon the duration of their UV illumination.
Establishing the presence of a shock propagating through the molecular gas is extremely important from the point of view of investigating the cloud evolution and whether any star formation in the clouds is likely to have been triggered by photoionisation shocks. The presence of a photoionisation shock can be inferred by the pressure balance between the cloud interior and exterior. If the cloud is underpressured (or at the same pressure) with respect to the surrounding medium then it is highly likely that a photoionisation shock and D-critical ionisation front are being driven into the cloud. Conversely if the cloud is overpressured with respect to the surrounding medium then the cloud must be in the compression phase and the shock is stalled at the cloud surface.
The radio emission mapped in the NVSS data probes the conditions in the ionised boundary layer of the clouds, whilst the JCMT 13CO maps reveal the conditions within the molecular interior of the clouds. In this section we use the NVSS and JCMT observations to determine the pressure in the ionised and molecular gas so that we may investigate the pressure balance of the clouds and establish whether photoionisation shocks are currently propagating through the clouds.
3.6.1 Ionising flux, electron density and ionised gas pressure
As well as the pressure in the ionised gas the free-free radio flux from the ionised boundary layer allows the impinging flux of ionising photons and the electron density of the layer to be determined. Because of the low resolution of the NVSS data (45″ FWHM beam) it is important to stress that the quantities derived for the clouds are global averages and do not represent local point-to-point values (e.g. for the individual cores within each SCUBA jiggle-map). The 20 cm radio emission appears to be elongated along the cometary axis of each cloud (somewhat marginally in the case of SFO 11NE), but is mostly centred upon the head of each bright-rimmed cloud. The morphology of the 20cm emission associated with SFO 11E suggests that this cloud lies in the same line-of-sight as the bright southern ionisation-bounded ridge of IC 1848. The radio emission associated with SFO 11E is much stronger than the other two clouds and it is likely that the emission is enhanced by the line-of-sight effects of sampling through a much deeper column of ionised gas along the southern ridge.
To evaluate the strength of the ionising flux impinging upon the clouds and also the electron density and pressure in the photoionised boundary layer we use the general equations from Lefloch et al. (llc97 (1997)). Rearranging their Eq. (1), the ionising photon flux arriving at the cloud rim may be written in units of cms-1 as:
| (6) |
where is the integrated radio flux in mJy, is the effective electron temperature of the ionised gas in K, is the frequency of the free-free emission in GHz and is the angular diameter over which the emission is integrated in arcseconds.
The electron density () of the ionised boundary layer surrounding the cloud may also be derived from the integrated radio flux by subsituting for the ionising photon flux in Eq. (6) of Lefloch et al. llc97 (1997). The electron density in cm-3 is given by:
| (7) |
where those quantities common to both Eqs. (6) and (7) are in the same units, is the radius of the cloud in pc and is the effective thickness of the ionised boundary layer as a fraction of the cloud radius (typically , Bertoldi bertoldi (1989)). From the electron density we may evaluate the pressure in the ionised boundary layer via , where is the density in the boundary layer and is the sound speed of the ionised gas (typically 11.4 kms-1).
The measured integrated 20 cm fluxes for each of the three clouds SFO 11, SFO 11NE and SFO 11E are given in Sect. 2 as 7.7, 8.8 and 37.0 mJy respectively. Values for the ionising flux , electron density and ionised gas pressure were calculated using the above equations and assuming an effective electron temperature K and an ionised boundary layer thickness . The results of these calculations are shown in Table 9. Given that SFO11E lies along the southern ionisation boundary of IC1848 it is also likely that both the integrated 20 cm flux and radio-derived ionising flux are overestimated for this cloud. If we assume that SFO 11E is at roughly the same distance from HD17505 as the other two clouds, then the typical ionising flux illuminating SFO 11E should be similar to that of the two other clouds (3 cm-2 s-1). In this case the measured 20 cm flux is overestimated by roughly a factor of two and the electron density and pressure should be reduced by a factor of .
IC1848 is excited by the young open cluster OCl 364, whose dominant member is the O6V star HD17505. Inspection of the orientation of the three bright-rimmed clouds with respect to the stars in the open cluster shows that it is likely that HD17505 is the star primarily responsible for ionising the cloud surfaces: the cometary axes of SFO 11 and SFO 11NE point directly toward HD17505. The axis of SFO 11E does not point directly toward HD17505, although the brightest rim of the cloud is found on the side facing HD17505 (see Fig. 4). It is likely that another nearby OB star is also exciting SFO 11E, but as the H and 20 cm emission are located on the HD17505-facing side of the cloud HD17505 is almost certainly the predominant exciting star of this cloud. The nearby O9V star HD17520 is also a potential exciting star, although following Panagia (panagia (1973)), HD17505 is expected to emit roughly eight times the ionising photon flux of HD17520 and is the dominant member of the pair. The ionising photon flux predicted by Panagia (panagia (1973)) for an 06V star is photons s-1, scaling this to the projected distance of HD17505 from the three clouds (which is 11 pc) and assuming that there is negligible absorption of the UV radiation from the intervening HII region we predict that the ionising photon flux impinging upon the clouds is 1.2 cm-2 s-1.
This value is reasonably consistent with that estimated from the 20 cm free-free flux measured from SFO 11E (0.8 cm-2 s-1), but a factor of 3–5 larger than the value for estimated from the 20 cm flux associated with the clouds SFO 11 and SFO 11NE. Projection effects are the most likely cause for the over-prediction of the ionising flux from the spectral type of the illuminating star. Even a modest inclination of the star-cloud vector to the line-of-sight results in an increase of the “true” distance between star and cloud and hence a significant decrease in the predicted UV flux impinging upon the cloud. The measured and predicted ionising fluxes may be used to estimate the true distance and inclination angle of the star-cloud vector to the line of sight. Again assuming an average illuminating UV flux of 3 cm-2 s-1 at the cloud surfaces we estimate that the true (or at least an upper limit) distance of the clouds from the ionising 06V star HD17505 is 22 pc and the inclination of the star-cloud vector to the line of sight is 30.
3.6.2 Molecular gas pressure
The pressure of the molecular gas () is comprised of contributions from both turbulent and thermal components. For cold gas, such as that of the cores in our sample, there is a negligible thermal contribution to either the pressure or observed line-width. The molecular pressure may thus be written as the product of the square of the turbulent velocity dispersion () and the density of the molecular gas (); i.e. . The turbulent velocity dispersion may be written in terms of the observed line width as . In order to avoid optical depth selection effects and sample the gas throughout the cloud the line width should be determined from an optically-thin line. The line widths used here are those measured from the source-averaged spectra of the (at most) moderately optically thick 13CO line.
The H2 number densities of the clouds as derived from the 13CO observations are all typically a few times 103 cm-3, however those derived from greybody fits to the dust emission are roughly an order of magnitude higher. In order to estimate the maximum pressure within the clouds we have used the dust-derived density rather than the 13CO-derived value which may be affected via depletion (either onto dust grain ice mantles or via selective photodissociation) or optical depth effects. As the radio emission is concentrated around the cores at the head of each cloud (the SMM1 cores) we have used the density values derived for each of these cores. We caution however that the density of the gas (and hence the molecular pressure) is dependent upon the validity of the assumed spherical core geometry, the value of the dust mass coefficient and the dust temperature derived from the greybody fit to the SED. The molecular pressure should only be considered to be accurate to within a factor of 3 at best.
| Cloud | Ionising flux | Electron density | Ionised pressure | Molecular pressure |
|---|---|---|---|---|
| (cm-2s-1) | (cm3) | (cmK) | (cmK) | |
| SFO 11 | 266 | |||
| SFO 11NE | 354 | |||
| SFO 11E | 478 |
The molecular pressures for each cloud are all within a few times 106 cmK and are shown in Table 9. Comparing the values of and for each cloud, and taking the error in the molecular pressure into account, reveals that the pressures are approximately equal. In this scenario the ionised and molecular gas are in pressure balance and the conditions are consistent for the propagation of photoionisation-induced shocks into the clouds. However, from the currently available data we cannot rule out the possibility that the clouds may be either underpressured or marginally overpressured with respect to their IBLs. In the former case photoionisation-induced shocks may propagate into the clouds, whilst in the latter the shocks are stalled at the ionised boundary layer (Lefloch & Lazareff ll94 (1994)).
It is unfortunate that the results of this analysis are not more concrete. It is possible that photoionisation-induced shocks are propagating into the clouds, given the similar values of and for each cloud. However, if the molecular pressure is greater than the estimates in Table 9 the data do not preclude the likelihood that the shocks are stalled in the ionised boundary layer. We will discuss both of these possibilities further in Sect. 4.1.
4 Discussion
In this section we draw together the results from the previous analyses to investigate the nature of the clouds, their potential for star formation and speculate upon their evolution and eventual fate.
4.1 Cloud morphology and physical properties
The general morphology of the clouds indicates that the predominant UV flux illuminating the clouds originates from the single 06V star HD17505. All three clouds possess a similar cometary morphology with their long axes pointing in the general direction of HD17505. There is some ambiguity regarding the cloud SFO 11E, whose axis does not point directly toward HD17505, although we note that the brightest H and 20 cm emission originates from the HD17505-facing side of the cloud and so HD17505 is likely to be the predominant exciting star. Assuming that there is little absorption of the UV flux in the intervening HII region the strength of the 20 cm free-free emission associated with the clouds suggests that their true distance from HD17505 is around 22 pc, roughly double the projected distance. Although the three clouds lie close together on the sky, their arrangement is probably a chance superposition. For SFO 11E the Digitised Sky Survey and H images show that bright optical emission from the ionised gas is located on the facing side of the cloud, whereas for SFO 11NE and SFO 11 the emission is shielded by the dark molecular gas. SFO 11E must be located behind the illuminating star with the long axis of the cloud pointing toward the observer for its ionised surface to be visible in the optical. The remaining two clouds are probably located in front of the ionising star with their long axes pointing away from the observer and the dark molecular gas obscuring the bright optical emission from the face exposed to the ionising star.
This scenario is consistent with the observed difference in the of the 12CO and 13CO emission from the three clouds. SFO 11E is redshifted by 5 km s-1 with respect to the other two clouds. A well-known phenomenon in cometary clouds is their velocity displacement from their ionising star, as the star photoevaporates material from the cloud surface the so-called rocket effect (Oort & Spitzer os55 (1955)) accelerates the cloud away from the star by up to 10 km s-1 (Bertoldi bertoldi (1989)). If SFO 11E is located behind the ionising star, whereas SFO 11 and SFO 11NE are located in front of the ionising star the two groups of clouds will be accelerated away from each other, leading to the observed difference in between the clouds.
Comparing the overall morphology of the clouds as seen in the H images, SCUBA and CO maps with that predicted by the RDI models of Lefloch & Lazareff (ll94 (1994)) suggests that the clouds have been exposed to the UV flux from HD17505 for between 1–2 years. The “inverted V” appearance of SFO 11 closely resembles the RDI model snapshot at Myr (Fig. 4c of Lefloch & Lazareff ll94 (1994)). SFO 11NE and SFO 11E display a more rounded “pillar” morphology than the sharply swept-back appearance of SFO 11 which appears slightly detached from the H emission to the south. The rounded pillar morphology of SFO 11NE and SFO 11E is similar to the Lefloch & Lazareff RDI model snapshot at 0.036 Myr since initial ionisation. This may suggest that either SFO 11NE and SFO 11E have been exposed to the UV flux for a shorter period of time, or that their internal pressures were initially higher than that of SFO 11 and the ionisation front was stalled at the cloud surface until the internal and external pressures reached equilibrium.
This phase in the models corresponds to the early collapse phase of the clouds, prior to the maximum compression of the cloud and the subsequent cometary stage (Lefloch & Lazareff ll94 (1994)). The cores found at the head of SFO 11NE and SFO 11E are not elongated along the axis of UV illumination, contrary to the predictions of the RDI models, where the dense cores are formed via radiative-driven compression of the molecular gas. These cores may not have been formed by the RDI process and could thus be pre-existing structures within the clouds. However, we note that the cores are only just resolved in the 14″ SCUBA maps and higher resolution mapping to more accurately determine their degree and axis of elongation may be required to address this point.
Internally, the three clouds possess a clumpy structure comprised of two or three dense molecular cores. The cores located at the “head” of each cloud (i.e. those closest to the ionising star) are in general more massive and slightly denser than the cores found deeper inside the clouds, even taking into account the rather large uncertainty in the mass of the SMM2 and SMM3 cores. The larger concentration of material towards the “heads” or “tips” of the clouds is similar to that seen in other bright-rimmed clouds and globules, e.g. the Eagle Nebula (White et al;. whiteeagle (1999); Fukuda, Hanawa & Sugitani fhs02 (2002)), the Rosette Nebula (White et al. rosette (1997)) and RNO 6 (Bachiller, Fuente & Kumar bfk02 (2002)).
The cores found at the head of each cloud are in approximate pressure balance with the exterior ionised gas in the ionised boundary layer. The error in the determination of the molecular pressure (which arises mostly from the uncertainty in the H2 density of the molecular gas) means that we cannot say for definite whether the clouds are over- or under-pressured with respect to their surroundings. Thus from the pressure evidence alone it is difficult to ascertain if photoionisation-induced shocks are currently propagating into the clouds. However, the close correspondence of the cloud morphologies to the collapse phase in the Lefloch & Lazareff (ll94 (1994)) RDI model lends weight to the supposition that ionisation shocks are propagating into the clouds and causing their collapse. On balance we conclude that photoionisation-induced shocks are likely propagating into the clouds. We base the following discussion of the cloud properties and evolution (see Sect. 4.4) upon this hypothesis.
In order to estimate the likely extent to which the shocks have propagated into the clouds we may derive an estimate of the shock velocity from the pre- and post-shock pressures of the neutral gas (White et al. whiteeagle (1999)). We follow Eqs. (22) and (23) from White et al. (whiteeagle (1999)) and their assumption that the ratio of the post- and pre-shock densities ranges from –, which leads to a maximum error in the estimated shock velocity of a factor . Using these assumptions we derive typical shock velocities in the range 1.2–1.6 kms-1 for neutral gas of density H2 molecules cm-3. The shock velocity is much greater than the sound speed of the molecular gas, which is typically 0.3 km s-1 for molecular hydrogen at 20 K, implying that the photoionisation-induced shocks propagating into the clouds are supersonic. The shock crossing time for the cores found at the head of the clouds is years, based upon a shock velocity of 1.4 km s-1 and a typical core diameter of 0.25 pc.
It it also possible to independently estimate the duration over which the clouds have been exposed to the UV flux from a simple treatment of the expansion time of the HII region IC 1848. In the following, we assume that the expansion of IC 1848 was powered primarily by the 06V star HD17505 and that the clouds lie at a distance of 22 pc from the star, consistent with the ionising flux measured from the 20 cm free-free continuum and the spectral type of the ionising star. As this distance was evaluated using the assumption that the absorption of the UV radiation by the intervening material within the HII region is negligible, it should be regarded strictly as an upper limit to the actual star-cloud distance. We note that the distance between SFO 11E and HD17505 is not certain as the 20 cm flux associated with this cloud may be over-estimated by association with the bright rim of the ionisation boundary to the south. The initial expansion of the HII region is rapid out to the radius of the Strömgren sphere, which for an O6V star is typically 1–4 pc, assuming the density of the surrounding material is between 102 and 103 cm-3. Following this rapid expansion the ionisation front moves outward much more slowly, at around the sound speed of the ionised gas which is typically 11.4 km s-1.
If the clouds are indeed located around 22 pc from their ionising star and the ionising front expanded at the sound speed of 11.4 km s-1 after the initial Strömgren expansion it will have taken 1.5 Myr for the front to reach the clouds. This is comparable to the estimated lifetime of IC 1848 (Vallée, Hughes & Viner vhv79 (1979)) and indicates that the clouds have only just become exposed to the ionising UV flux of HD 17505. It must be noted that our estimate of the expansion timescale for the ionisation front to reach the clouds is a rather simplistic estimate; assuming a constant expansion velocity of the front at the sound speed, an initial density of 102 cm-3 for the material surrounding the O-star and a star-cloud distance based upon negligible absorption of the UV flux emitted from the O-star.. However the presence of the bright ridge of nebular emission to the south of the clouds suggests that the ionisation front has only just reached the base of the clouds and supports the argument that the clouds have only just become exposed to the UV flux. We can thus derive an alternative UV illumination timescale for the clouds from the time taken for the ionisation front to travel the length of the clouds to the bright southern ridge. Assuming that the clouds are not significantly foreshortened by projection effects, the time taken for an ionisation front moving at the sound speed to traverse the distance between the head of SFO 11NE (the furthest cloud from the ridge) and the bright nebular ridge is 300,000 years.
This is comparable to the UV illumination timescale predicted by the cloud morphology from the RDI model of Lefloch & Lazareff (ll94 (1994)) and reinforces the conclusion that the overall evolution of the clouds will be governed by their radiative-driven implosion. Both timescales are also comparable to the shock crossing time of the cores ( years). This implies that there has been sufficient time since the clouds were illuminated for the shocks to propagate deep within the clouds and to perhaps substantially affect their interior evolution and star-forming history.
4.2 Star formation in the clouds?
From the SCUBA maps we have identified 8 dust cores that have similar characteristics (i.e. density, temperature and spatial diameter) to protostellar cores observed in other molecular clouds (e.g. Evans 1997). Three of the cores (SFO 11NE SMM1, SFO 11NE SMM2 and SFO 11E SMM1) appear centrally-condensed, also suggesting their protostellar nature. The cores found at the heads of these bright rimmed clouds are at the high mass end of the scale compared to the cores observed in other molecular clouds and Bok globules, which typically mass M⊙. This is consistent with the overall tendency toward higher masses for other known bright-rimmed cloud cores (e.g. Sugitani et al. smnto00 (2000); Lefloch et al. lcrmch02 (2002); White et al. whiteeagle (1999); Lefloch, Lazareff & Castets llc97 (1997)).
There is some evidence for molecular outflow within the two cores SFO 11NE SMM1 and SFO 11E SMM1 in the form of moderate velocity line wings in the 12CO spectra. However, outflow lobes are not seen in either the 12CO channel maps (Fig. 8) or in integrated intensity maps of the line wings, which may be due to the limited 21″ resolution of the CO maps. The line wings could instead be explained by photoevaporated CO flowing away from the surface of the clouds, rather than protostellar molecular outflows.
There are are two jet-like features observed in the H image of SO 11NE (see Fig. 10), which support the outflow hypothesis within the SMM1 core. The jet-like features resemble the well-known photoionised jet HH 399 associated with the bright-rimmed cloud TC2 in the Trifid Nebula (Lefloch et al. lcrmch02 (2002)). The jet-like features associated with SFO 11NE may thus arise from a similar situation as that found in TC2. The alignment of the two jet-like features, while roughly corresponding with each other and indicating that they may both arise from the same source, does not correspond with that of either the 850 m continuum peak of SFO 11NE SMM1 or any 2MASS Point Source Catalogue objects . This could indicate the location of another protostellar object within SFO 11NE SMM1, which is perhaps either a less evolved class 0 object or more heavily obscured within the core. Further investigation of these jet-like features, higher resolution CO observations and deeper infrared images are a priority to confirm the presence of outflows and identify their driving sources.
The physical conditions within the cores are consistent with those of an early phase of protostellar evolution. Integrating over the greybody fits to the observed SED of the three SMM1 cores (Sect. 3.4.1) yields the bolometric luminosity, , of each core (330, 170 and 430 L⊙ for SFO 11 SMM1, SFO 11NE SMM1 and SFO 11E SMM1 respectively). The bolometric luminosities are higher than typical Class 0 and I objects, which are typically a few tens of L⊙ (André, Ward-Thompson & Barsony awb93 (1993); Chandler & Richer cr00 (2000)), possibly indicating that the cores are forming multiple stars or intermediate-mass stars (Sugitani et al. smnto00 (2000)).
The 2MASS results provide some support for this hypothesis, by showing that there are multiple YSOs and protostallar candidates embedded within the cores. In SFO11 the core SMM1 is associated with a weak-line T Tauri star and the two cores SMM2 and SMM3 are both associated with candidate class I protostars. A small cluster of YSOs and class I protostar candiates is embedded in the core SFO 11NE SMM1, with some evidence for a possible class 0 object at the intersection of the two jet-like features. SFO 11NE SMM2 does not show any evidence for ongoing star formation, apart from a T Tauri candidate located to the south west (source s in Fig. 6). A T Tauri candidate is found at the edge of SFO 11E SMM1, but there is no evidence for embedded star formation in this core beyond the moderate velocity line wings seen in the CO observations, as previously discussed. The cores SFO 11E SMM2 and SMM3 are not associated with embedded protostars or YSOs, although two candidate class I protostars (sources f and k in Fig. 6) are located to the north in the ridge of sub-mm emission stretching from SFO 11E SMM1 to SFO 11E SMM2.
In summary, there is reasonable evidence for either ongoing or recent star formation within all three clouds. Two of the cloud cores (SFO 11NE SMM1 and SFO 11E SM1) are associated with line wings that are suggestive of molecular outflow. All of the sub-mm cores detected by SCUBA possess similar physical characteristics to protostellar cores found in other molecular clouds (e.g. Evans evans99 (1999)) and this implies that the three cores in our study that do not show any signs of current star formation (SFO 11NE SMM2, SFO 11E SMM2 and SFO 11E SMM3) may well be good prospects for future star formation. In order to investigate their star-forming nature and to unambiguously classify the protostellar population of the remaining cores more accurate infrared photometry and sub-mm observations are required to constrain their SEDs, temperatures and luminosities.
4.3 Could the star formation have been induced by HD17505?
In the previous two subsections we dwelt upon the physical properties of the clouds and their star-forming nature. Here, we consider the effect that the UV illumination has had upon the evolution of the clouds and their eventual fate. In the following discussion we assume that the molecular gas of the clouds is in pressure balance with the exterior ionised gas and that photoionisation-induced shocks are propagating into the clouds. In Sect. 4.1 we showed that this possibility is likely, based upon the similarity of the cloud morphologies to those predicted by RDI models (Bertoldi bertoldi (1989); Lefloch & Lazareff ll94 (1994)) and the approximate pressure equilibrium between the ionised exterior and molecular interior of the clouds. We are confident that the past and future evolution of the clouds may be intepreted in the context of these RDI models. In this section and the next we will extend the model predictions to examine two important areas: could the star formation seen in the clouds have been triggered by the UV illumination and what is the eventual fate of the clouds?
The SMM1 cores found at the head of each cloud are the logical candidates to examine for signs that the star formation within them was triggered by their UV illumination, as the remaining cores are mostly shielded from the UV illumination by the SMM1 cores and, apart from SFO 11 SMM3, there is no evidence that they are forming stars. It is difficult to assess whether the SMM1 cores were actually formed by the RDI process; the morphology of SFO 11 SMM1 suggests that it may have formed via RDI as the inverted-V morphology of the cloud is extremely close to that predicted by Lefloch & Lazareff (ll94 (1994)). However, the remaining cores do not show signs of elongation along the axis of the UV illumination (as predicted by the RDI models) and their origin remains unclear. It is impossible to determine if the cores were formed by radiative-driven collapse or are simply pre-existing structures found in the parent molecular cloud of IC 1848. No matter how the SMM1 cores were originally formed it is clear that they are all host to either current or recent star formation.
One piece of circumstantial evidence supporting the hypothesis that the star formation in the SMM1 cores was induced by the UV illumination from the nearby O star is that the estimated age of the protostars and YSOs is similar to the timescale over which the clouds have been illuminated. From a simple consideration of the expansion velocity of the ionisation front we estimate that the three bright-rimmed clouds have been exposed to the UV radiation for around 3105 years. SFO 11NE SMM1 is associated with Class I protostars and T Tauri stars (class II YSOs), which typically have a characteristic age of 1–2105 years (André, Ward-Thompson & Barsony awb00 (2000)) and a few times 105 to a few times 106 years respectively (André & Montmerle am94 (1994)). SFO 11 SMM1 and SFO 11E SMM1 are both associated with T Tauris and possibly less evolved class 0 protostars. The evolutionary stage of the star formation within the cores is thus consistent with that expected for star formation induced by the UV illumination. This similarity, however, does not offer conclusive proof that the star formation within the cores was induced, but merely that the induced scenario is plausible with the apparent UV illumination timescale of the clouds.
We may also investigate the stability of the cores against gravitational collapse in order to ascertain whether the UV illumination caused them to become unstable. The RDI models of Lefloch & Lazareff (ll94 (1994)), Bertoldi & McKee (bk90 (1990)) and Bertoldi (bertoldi (1989)) do not specifically address the gravitational stability of the clouds with respect to eventual star formation, except to derive stability criteria for equilibrium clouds (Bertoldi & McKee bk90 (1990)). As a simple approach we use the virial theorem to explore the stability of a molecular cloud against the rise in external pressure caused by photoionisation of the cloud surface. For an unmagnetised spherical isothermal cloud with uniform density and in virial equilibrium the virial theorem reduces to (e.g. Hartmann hartmann00 (2000));
| (8) |
where the radius and mass of the cloud are represented by and respectively, the sound speed of the gas is , is the pressure of the external medium surrounding the cloud and is the gravitational constant. By considering the derivative of the external pressure with respect to cloud radius it is easy to show that there is a critical external pressure for the cloud above which the cloud is not stable to collapse. This critical pressure may be written in terms of the FWHM linewidth (where the turbulent sound speed ) and the mass of the cloud as
| (9) |
However, if we know the external pressure acting upon the cloud, we may write Eq. (8) in the more familiar terms of a “virial mass”, i.e. the mass at which the critical pressure for cloud collapse is equal to the external cloud pressure. The mass determined in this manner is comparable to the more traditional virial mass of the cloud as derived from the FWHM linewidth and cloud radius, but takes into account the pressure of the medium surrounding the cloud. We refer to this pressure-sensitive mass as the “pressurised virial mass” to distinguish it from the more traditional definition of the virial mass. An increase in the cloud mass consequently reduces the critical external pressure required for the cloud to collapse; if the external pressure is fixed and the cloud mass is such that the critical pressure is lower than the external pressure the cloud will collapse. Thus, clouds with true masses exceeding their pressurised virial mass are unstable against gravitational collapse. The pressurised virial mass is written as:
| (10) |
As the pressurised virial mass depends upon the fourth power of the FWHM linewidth , its accuracy is highly dependent upon the accuracy of the linewidth. From a consideration of the errors in gaussian fits to the 13CO lines we estimate that the resulting pressurised virial masses derived from Eq. (10) are accurate to within a factor of 2. The pressurised virial mass may be compared to the standard virial mass , which is given as:
| (11) |
where is in M⊙, is the cloud radius in pc and is the FWHM linewidth in km s-1 (e.g. Evans evans99 (1999)). In order to explore the evolution of the cores before and after their UV illumination we consider the difference between their standard and pressurised virial masses. We equate the standard virial mass with the pre-illumination conditions of the cores and the pressurised virial mass with the current core characteristics. Implicit assumptions in these scenarios are that the cores were subject to a negligible external pressure prior to the illumination and that their physical properties (such as mass, linewidth and radius) were not significantly different prior to the illumination to their current values. We use the standard “unpressurised” virial mass to illustrate the pre-illumination case, rather than estimate the initial external pressure acting upon the clouds, as the initial conditions exterior to the cores are difficult to establish.
Whilst this approach is simplistic, assuming that the pressure of the ionised boundary layer applies to the entire surface of the core instead of the face illuminated by the UV flux and that the cores are pre-existing entities, it nevertheless allows us to explore whether the rise in external pressure is significant in terms of the eventual stability of the cores. Values for both the pressurised and standard virial masses of the SMM1 cores are found in Table 10. The FWHM linewidths used to calculate the virial masses were the source-averaged 13CO linewidth, the core radii as measured from the 850 m continuum maps and the external pressures as derived from the NVSS 20 cm fluxes. For ease of comparison the core masses determined from the 850 m continuum emission in Sect. 3 have also been included in Table 10.
| Core | Msubmm | ||
|---|---|---|---|
| (M⊙) | (M⊙) | (M⊙) | |
| SFO 11 SMM1 | 10.4 | 42.3 | 20.6 |
| SFO 11NE SMM1 | 45.4 | 81.6 | 13.4 |
| SFO 11E SMM1 | 31.2 | 85.0 | 18.7 |
The standard virial masses of the cores are much larger than the masses derived from the sub-mm continuum. This implies that prior to the UV illumination of the clouds the cores were likely to be stable against collapse. The pressurised virial masses of the cores are lower than their standard virial masses and this indicates the destabilising effect of the high external pressures upon the gravitational stability of the cores. SFO 11NE SMM1 and SFO 11E SMM1 are the least affected by the rise in external pressure; their pressurised virial masses are a larger fraction of the standard virial mass and a factor of 2–3 greater than the mass derived from their sub-mm continuum emission. SFO 11 SMM1, on the other hand, has a pressurised virial mass comparable to its sub-mm mass and half that of the standard virial mass. However, within the uncertainties, it is possible that SFO 11E SMM1 is also unstable against collapse. SFO 11 SMM1 and SFO 11E SMM1 are thus the only SMM1 cores whose collapse may have been induced by the rise in external pressure.
From these results the immediate conclusions that may be drawn are that all of the cores were stable against collapse prior to their UV illumination and that SFO 11 SMM1 and SFO 11E SMM1 are currently unstable due to the rise in its external pressure. However these conclusions must be interpreted with caution. It is obvious from the 2MASS K-band images that the cores are fragmented and that collapse of the individual fragments has begun to form multiple protostars within the clouds. The picture of core stability drawn from the virial masses of the cores applies to the stability of the overall core, not to individual fragments within each core. The assumption is also that the cores pre-date the UV illumination, this may not be true for SFO 11 SMM1 as this core displays the hallmarks of RDI formation. What we may conclude from the core virial masses is that the rise in external pressure has not played an active role in the overall evolution of SFO 11NE SMM1, but may have contributed to the gravitational instability of SFO 11 SMM1 and SFO 11E SMM1. It is impossible to determine whether the star formation seen within the cores was induced by the UV illumination without a more detailed theoretical treatment. We have nevertheless shown that is it possible for the rise in external pressure to have caused the collapse of SFO 11 SMM1 and SFO 11E SMM1.
4.4 The evolution of the clouds and their eventual fate
The long-term evolution of the clouds is expected to broadly follow that described in the RDI models of Bertoldi (bertoldi (1989)) and Lefloch & Lazareff (ll94 (1994)). The conditions within the ionised boundary layer and the dense molecular cores at the head of the clouds are consistent with those required for a D-critical ionisation front to propagate into the interiors of the clouds, slowly ionising and dispersing the molecular gas. Lefloch & Lazareff (ll94 (1994)) estimate the mass loss rate of such clouds as
| (12) |
where the ionising photon flux is measured in units of cm-2 s-1 and the cloud radius is in pc. For the SMM1 cores at the heads of the clouds in our study (SFO 11, SFO 11NE and SFO 11E) we estimate their current mass loss rates as 3.5, 3.5 and 6.6 M⊙ Myr-1 respectively. If the ionising flux impinging upon SFO 11E is reduced to that of the remaining two clouds to account for the possibility that the 20 cm flux associated with this cloud is overestimated (see Section 3.6.1) then the mass loss rate reduces to 3.5 M⊙ Myr-1. Lower limits to the lifetime of the cores may be determined from , suggesting that the lifetime of the cores is at least 4–6 Myr.
This lifetime is based upon the steady propagation of the ionisation front into the core, there is some evidence from the H images that this may not be the case for SFO 11 or SFO 11E. The rims of both of these clouds are irregular, indicating that the ionisation front may have developed Rayleigh-Taylor instabilities (Lefloch & Lazareff ll94 (1994)). SFO 11 displays a lumpy, irregular structure with many tiny globules that appear to have broken free from the main body of the cloud. SFO 11E possesses a “corrugated” rim on its NW face with bright pockets of H emission located in the troughs of the corrugations. Lefloch & Lazareff (ll94 (1994)) consider the effect of instabilities in the ionisation front and show that clouds with unstable ionisation fronts experience an enhanced mass loss rate after the initial collapse phase. The morphologies of the clouds suggest that they are in the early collapse phase and so the mass loss from SFO 11 and SFO 11E may increase rapidly in their near future.
Nevertheless, it is expected that the SMM1 cores at the head of the clouds will survive for at least another 1–2 Myr and if instabilities do not develop in SFO 11NE SMM1 its expected lifetime is at least 4 Myr. The current star formation occurring within the cores is at the early class I/II phase. The accretion stage in star formation lasts for typically a few 105 years (André, Ward-Thompson & Barsony awb00 (2000)) and so any existing or imminent star formation within the cores should be relatively undisturbed by the mass loss. The clouds are primarily illuminated by the nearby 06V star HD17505, which has an estimated main-sequence lifetime of 3.8 Myr, following McKee, Van Buren & Lazareff (mkvbb84 (1984)) and Panagia (panagia (1973)). Taking the age of IC 1848 to be 1.5 Myr (Vallée, Hughes & Viner vhv79 (1979)), HD17505 is roughly half-way through its alloted lifespan. The lifetime of the cores is thus sufficiently long that they may even perhaps outlast the UV illumination from their ionising O star.
5 Summary and conclusions
We have carried out an in-depth study of three bright-rimmed clouds (SFO 11, SFO 11NE and SFO 11E) associated with the HII region IC 1848, in order to search the clouds for evidence of star formation and attempt to place the star formation in context with the likely past and future evolution of the clouds. We observed the three clouds using SCUBA on the JCMT to map their continuum emission at 450 and 850 m; the JCMT to map the J=2–1 lines of 12CO and 13CO; and the Nordic Optical Telescope to image the H emission from the cloud rims using a narrowband filter. We have also obtained archival data of the 20 cm radio emission from the NVSS; far and mid-infrared IRAS HIRES maps; and 2.2 m 2MASS images of the clouds. We draw the following conclusions from our observations:
-
1.
The overall morphology of the clouds as seen in the H images, SCUBA and CO maps is reasonably consistent with the predictions of the radiative-driven implosion (RDI) model of Lefloch & Lazareff (ll94 (1994)). The cloud morphology resembles the early collapse phase of the Lefloch & Lazareff (ll94 (1994)) model, some 1–2 105 years after the UV illumination began. However, the cores found at the head of the clouds SFO 11NE and SFO 11E are not elongated in the direction of the UV illumination and this indicates that these cores may not have formed by the RDI process and could thus pre-date the UV illumination of the clouds. The H images show the typical radial striations expected for a photoevaporated flow of gas from the cloud surface.
-
2.
There is reasonable evidence for ongoing star formation within all three clouds at the class I or class II evolutionary stage. The SCUBA maps reveal 8 dust cores within the optical boundaries of the clouds which possess the same physical properties as protostellar cores. The dust cores found toward the head of the bright-rimmed clouds are typically larger and more massive than those found further away from the bright rims. 2MASS near-infrared images reveal several candidate class I protostars and T Tauri stars associated with the clouds, although the majority of these objects are also consistent with reddened main sequence stars. More accurate infrared photometry is required to resolve ambiguities in classification. Molecular outflows may be associated with the two cores SFO 11NE SMM1 and SFO 11E SMM1, although higher spatial resultion is required to resolve the individual outflow lobes. A possible photoionised jet is seen in the H image of SFO 11NE and optical spectroscopy to confirm the nature of this feature is a priority.
-
3.
The cometary morphology of the clouds suggests that their primary ionising star is HD17505. The orientation of SFO 11E is not aligned with the direction toward HD17505 and this may indicate that SFO 11E is also affected by another nearby OB star. The H emission from the bright rim of SFO 11E is brighter on the HD17505-facing side of the cloud, suggesting that HD 17505 is the dominant exciting star. The 20 cm free-free emission from the clouds is consistent with a true distance from HD 17505 of approximately 22 pc. The star-cloud distance as seen in projection is approximately 11 pc.
-
4.
All three clouds are in approximate pressure equilibrium between their ionised exterior and molecular interior, which is consistent with the RDI model prediction that D-critical ionisation fronts and photoionisation-induced shocks are currently propagating into the clouds. From the current data we cannot rule out the possibility that the clouds are over-pressured with respect to their ionised boundary layers and in this scenario the photoionisation-induced shocks are stalled at the ionised boundary layer (Bertoldi bertoldi (1989); Lefloch & Lazareff ll94 (1994)). Nevertheless the close correspondence between the morphologies of the clouds and the RDI models suggests that the clouds are currently being shocked and on balance we conclude that it is likely that photoionisation-induced shocks are propagating into the clouds. We estimate induced shock velocities of 1.4 km s-1, which have a crossing time of years for the diameters of the cores found at the head of the clouds. The crossing times are similar to predictions of the cloud lifetimes determined from their morphology and indicates that there has been sufficient time since the clouds were illuminated for the shocks to propagate deep within the clouds.
-
5.
It is difficult to ascertain whether or not the current star formation observed within the clouds was induced by the photoionisation process. The duration of the cloud UV illumination, their shock crossing times and the estimated age of the protostars/YSOs that have formed within the clouds are all similar (typically a few times 105 years). We have shown via a simple pressure-based argument that the UV illumination may have rendered SFO 11 SMM1 and SFO 11E SMM1 unstable against collapse but was not likely to have significantly affected SFO 11NE SMM1. A more detailed theoretical treatment of the cloud collapse, extending the existing RDI models in this direction, is required to make more concrete predictions in this area.
-
6.
Based upon the current mass loss from the SMM1 cores, predicted by the Lefloch & Lazareff (ll94 (1994)) RDI model, we estimate their lifetimes as between 4 and 6 Myr. Potential ionisation front instabilities seen in the H images of SFO 11 and SFO 11E may substantially reduce this lifetime. The ongoing star formation within the clouds should proceed relatively undisturbed by the dispersal of the clouds. In the absence of instabilities developing within the ionisation front, which significantly accelerate the mass loss rate (Lefloch & Lazareff ll94 (1994)), the dense core at the head of SFO 11NE may even outlive its ionising O star.
Acknowledgements.
The authors would like to thank an anonymous referee for a most thorough reading of this paper and several useful suggestions, particularly regarding the 2MASS photometry; James Urquhart for his critical insight and useful discussions; and the JCMT support staff for a pleasant and productive observing run. The Digitized Sky Survey was produced at the Space Telescope Science Institute under U.S. Government grant NAG W-2166. The images of these surveys are based on photographic data obtained using the Oschin Schmidt Telescope on Palomar Mountain and the UK Schmidt Telescope. The plates were processed into the present compressed digital form with the permission of these institutions. Quicklook 2.2 m 2MASS images were obtained as part of the Two Micron All Sky Survey (2MASS), a joint project of the University of Massachusetts and the Infrared Processing and Analysis Center/California Institute of Technology, funded by the National Aeronautics and Space Administration and the National Science Foundation. IRAS HIRES images were obtained from the NASA/IPAC Infrared Science Archive, which is operated by the Jet Propulsion Laboratory, California Institute of Technology, under contract with the National Aeronautics and Space Administration. This research has made use of the SIMBAD astronomical database service operated at CCDS, Strasbourg, France and the NASA Astrophysics Data System Bibliographic Services.References
- (1) André, P., Ward-Thompson, D., Barsony, M., 1993, ApJ, 406, 122
- (2) André, P., Montmerle, T., 1994, ApJ, 420, 837
- (3) André, P., Ward-Thompson, D., Barsony, M., 2000, in Protostars & Planets IV, ed. V. Mannings, A. Boss & S. Russel (Tucson:Univ. Arizona Press), 59
- (4) Bachiller, R., Cernicharo, J., 1986, A&A, 166, 283
- (5) Bachiller, R., Fuente, A., Kumar, M.S.N., 2002, A&A 381, 168
- (6) Bertoldi, F., 1989, ApJ, 346, 735
- (7) Bertoldi, F., McKee, C.F., 1990, ApJ, 354, 529
- (8) Bertoldi, F., McKee, C.F., 1992, ApJ, 395, 140
- (9) Braunsfurth, E., 1983, A&A, 117, 297
- (10) Carpenter, J.M., Heyer, M.H., Snell, R.L., 2000, ApJS, 130, 381
- (11) Chandler, C.J., Richer, J.S., 2000, ApJ, 530, 851
- (12) Codella, C., Bachiller, R., Nisini, B., Saraceno, P., Testi, L., 2001, A&A 376, 271
- (13) Condon, J.J., Cotton, W.D., Greisen, E.W., Yin, Q.F., Perley, R.A., Taylor, G.B., Broderick, J.J., 1998, AJ, 115, 1693
- (14) Currie, M.J., Berry, D.S., 2002, Starlink User Note 95, Starlink Project, CCLRC
- (15) Cutri, R.M., et al., 2002, 2MASS Explanatory Supplement, available from www.ipac.caltech.edu/2mass
- (16) Dent, W.F.R., Matthews, H.E., Ward-Thompson, D., 1998, MNRAS, 301, 1049
- (17) van Dishoeck, E.F., Black, J.H., 1988, ApJ, 334, 771
- (18) Draine, B.T., Lee, H.M., 1984, ApJ, 285, 89
- (19) Draper, P.W., Gray, N., Berry, D.S., Starlink User Note 214, Starlink Project, CCLRC
- (20) Economou, F., Jenness, T., Currie, M., Adamson, A., Allan, A., Cavanagh, B., 2002, Starlink User Note 230, Starlink Project, CCLRC
- (21) Elmegreen, B.G., 1991, in The Physics of Star Formation and Early Stellar Evolution, eds. C.J. Lada & N.D. Kylafis (Dordrecht:Kluwer), 35
- (22) Evans, N.J., II, 1999, ARA&A, 37, 311
- (23) Feinstein, A., Vásquez, R.A., Benvenuto, O.G., 1986, A&A, 159, 223
- (24) Frerking, M.A., Langer, W.D., Wilson, R.W., 1982, ApJ, 262, 590
- (25) Fukuda, N., Hanawa, T., Sugitani, K., 2002, ApJ, 568, 127
- (26) Gibb, A.G., Little, L.T., 1998, MNRAS, 295, 299
- (27) Gooch, R.E., 1995, in Astronomical Data Analysis Software & Systems IV, ed. RA. Shaw, H.E. Payne & J.J.E. Hayes, ASP Conf. Ser., 77, 144
- (28) Hartmann, L., 2000, Accretion Processes in Star Formation, Cambridge University Press, ISBN 0-521-78520-0
- (29) Heyer, M.H., Terebey S., 1998, ApJ, 502, 265
- (30) Hildebrand, R.H., 1983, QJRAS, 24, 267
- (31) Holland, W.S., et al., 1999, MNRAS, 303, 659
- (32) Ishida, K., 1970, PASP, 22, 277
- (33) Jenness, T., Lightfoot, J.F., 2000, Starlink User Note 216, Starlink Project, CCLRC
- (34) Kerton, C.R., Martin, P.G., Johnstone, D., Ballantyne, D.R., 2001, ApJ, 552, 601
- (35) Koornneef, J., 1983, A&A, 128, 84
- (36) Krügel, E., Siebenmorgen, R., 1994, A&A, 288, 929
- (37) Kutner, M.L., Ulich, B.L, 1981, ApJ, 250, 341
- (38) Lada, C.J., Adams, F.C., 1992, ApJ, 393, 278
- (39) Lefloch, B., Lazareff, B., 1994, A&A, 289, 559
- (40) Lefloch, B., Lazareff, B., 1995, A&A, 301, 522
- (41) Lefloch, B., Lazareff, B., Castets, A., 1997, A&A, 324, 249
- (42) Lefloch, B., Cernicharo, J., Rodriguez, L.F., Miville-Deschênes, M.A., Cesarsky, D., Heras, A., 2002, ApJ, 581, 335
- (43) McKee, C.F., Van Buren, D., Lazareff, B., 1984, ApJ, 278, L118
- (44) McKee, C.F., Zweibel, E.G., 1992, ApJ, 399, 551
- (45) Megeath, S.T., Wilson, T.L., 1997, AJ, 114, 1106
- (46) Meyer, M.R., Calvet, N., Hillenbrand, L.A., 1997, AJ, 114, 288
- (47) Mitchell, G.F., Johnstone, D., Moriarty-Schieven, G., Fich, M., Tothill, N.F.H., 2001, ApJ, 556, 215
- (48) Normandeau, M., Taylor, A.R., Dewdney, P.E., 1997, ApJS, 108, 279
- (49) Ogura, K., Sugitani, K., Pickles, A., 2002, AJ, 123, 2597
- (50) Oke, J.B., 1990, AJ 99, 1621
- (51) Oort, J.H., Spitzer, L., 1955, ApJ, 121, 6
- (52) Ossenkopf, V., Henning, Th., 1994, A&A, 291, 943
- (53) Panagia, N., 1973, AJ, 78, 929
- (54) Prestage, R.M., Meyerdierks, H., Lightfoot, J.F., Jenness, T., Tilanus, R.P.J., Padman, R., Chipperfield, A.J., Starlink User Note 17, Starlink Project, CCLRC
- (55) Privett, G., Jenness, T., Matthews, H., 1998, Starlink User Note 213, Starlink Project, CCLRC
- (56) Rieke, G.H., Lebofsky, M.J., 1985, ApJ, 288, 618
- (57) Sault, R.J., Teuben, P.J., Wright, M.C.H., 1995, Astronomical Data Analysis Software & Systems IV, ed. RA. Shaw, H.E. Payne & J.J.E. Hayes, ASP Conf. Ser., 77, 433
- (58) Sharpless, S., 1959, ApJS, 4, 257
- (59) Sugitani, K., Fukui, Y., Ogura, K., 1991, ApJS, 77, 59
- (60) Sugitani, K., Ogura, K., 1994, ApJS, 92, 163
- (61) Sugitani, K., Tamura, M., Ogura, K., 1995, ApJ, 455, 39
- (62) Sugitani, K., Matsuo, H., Nakano, M., Tamura, M., Ogura, K., 2000, AJ, 119, 323
- (63) Thompson, M.A., White, G.J., Morgan, L.K., Miao, J., 2003a, in preparation
- (64) Thompson, M.A., White, G.J., Morgan, L.K., Miao, J., 2003b, in preparation
- (65) Tody, D., 1993, in Astronomical Data Analysis Software and Systems II, eds. R.J. Hanisch, R.J.V. Brissenden, & J. Barnes, ASP. Conf. Ser., 52, 173
- (66) Vallée, J.P., Hughes, V.A., Viner, M.R., 1979, A&A, 80, 186
- (67) White, G.J., Sandell, G., 1995, A&A, 299, 179
- (68) White, G.J., Lefloch, B., Fridlund, C.V.M., Aspin, C.A., Dahmen, G., Minchin, N.R., Huldtgren, M., 1997, A&A, 323, 931
- (69) White, G.J., et al., 1999, A&A, 342, 233
- (70) Williams, J.P., Blitz, L., Stark, A.A., 1995, ApJ, 451, 252
- (71) Zinnecker, H., McCaughrean, M.J., Wilking, B.A., 1993, in Protostars & Planets III, ed. E.H. Levy & J.I. Lunine (Tucson:Univ. Arizona Press), 429