A dwarf galaxy remnant in Canis Major:
the fossil of an in-plane accretion onto the Milky Way
Abstract
We present an analysis of the asymmetries in the population of Galactic M-giant stars present in the 2MASS All Sky catalogue. Several large-scale asymmetries are detected, the most significant of which is a strong elliptical-shaped stellar over-density, close to the Galactic plane at , in the constellation of Canis Major. A small grouping of globular clusters (NGC 1851, NGC 1904, NGC 2298, and NGC 2808), coincident in position and radial velocity, surround this structure, as do a number of open clusters. The population of M-giant stars in this over-density is similar in number to that in the core of the Sagittarius dwarf galaxy. We argue that this object is the likely dwarf galaxy progenitor of the ring-like structure that has recently been found at the edge of the Galactic disk. A numerical study of the tidal disruption of an accreted dwarf galaxy is presented. The simulated debris fits well the extant position, distance and velocity information on the “Galactic Ring”, as well as that of the M-giant over-densities, suggesting that all these structures are the consequence of a single accretion event. The disrupted dwarf galaxy stream orbits close to the Galactic Plane, with a pericentre at approximately the Solar circle, an orbital eccentricity similar to that of stars in the Galactic thick disk, as well as a vertical scale height similar to that of the thick disk. This finding strongly suggests that the Canis Major dwarf galaxy is a building block of the Galactic thick disk, that the thick disk is continually growing, even up to the present time, and that thick disk globular clusters were accreted onto the Milky Way from dwarf galaxies in co-planar orbits.
keywords:
Galaxy: structure – Galaxy: formation – galaxies: interactions1 Introduction
It is now generally accepted that galaxies assembled by the hierarchical merging of dark matter halos (White, Rees, 1978; White, Frenk, 1991), with the accretion of luminous (dwarf) galaxies playing a significant, or probably even a major, role in the formation of the visible structures. In the Milky Way, this picture is dramatically illustrated by the existence of the Sagittarius dwarf spheroidal galaxy, which is in an advanced state of tidal disruption, and has populated the outer halo with M giant stars (Ibata et al., 2002), carbon stars (Ibata et al., 2001a) and globular clusters (Bellazzini, Ferraro & Ibata, 2003).
The accretion of the Sagittarius galaxy is currently the only strong evidence that the Milky Way is absorbing satellite galaxies. However, the ring-like structure that has recently been discovered around the Galaxy could be the consequence of another such event. First discovered as an over-density in blue stars of the Sloan Digital Sky Survey (Newberg et al., 2002), this “Ring” has since been probed using photometry from the INT Wide Field Camera (Ibata et al. 2003, hereafter I03), SDSS spectrometry and photometry (Yanny et al. 2003, hereafter Y03) and 2MASS M-giants (Rocha-Pinto et al. 2003). Surrounding the Galactic disk, its Galactocentric distance ranges from to in fields taken within of the Galactic plane and for .
It has been proposed (I03 and Y03) that the structure could be the tidal stream stripped away by the Milky Way tides from a satellite galaxy that has an orbital plane close to the plane of the Galaxy. In light of this interpretation, it is interesting to reexamine the Abadi et al. (2002) simulation of the formation of a disk galaxy assembled hierarchically in a CDM cosmology. They showed that the thin and thick disks of their simulated galaxy, which were similar to those of the Milky Way, do not share the same origin. The simulated thick disk component was constructed mainly through accretions of satellites with an orbit close to the Galactic plane. These satellites are dense enough for their orbits to circularize before they are disrupted.
Helmi et al. (2003) also used this simulation to follow more closely the behavior of an in-plane accretion. They concluded that it naturally leads to the formation of a ring-like structure around the galaxy similar to the one found by Newberg et al. (2002), with two possible explanations. One possibility is that the ring is a tidal arc produced by stars stripped away from the parent satellite during a recent pericentric passage. This would produce an asymmetric structure above and below the disk, limited in Galactic longitude and with a significant velocity gradient in the Galactic longitude direction. Alternatively, it could be a shell-like structure, produced by ancient minor mergers, similar to the shells observed in elliptical galaxies. In this case, the ring would be rather symmetric and with no velocity gradient.
To discriminate between these competing scenarios, it is essential to analyze a large-scale, homogeneous data set. Until now, this was the main limitation, but with the release of the 2 Micron All Sky Survey, All Sky Release (2MASS ASR) catalogue we now have an invaluable tool to determine the characteristics of this Galactic “Ring”. Apart from covering all the sky, the 2MASS ASR contains precise near infrared photometry, so it is not much hampered by extinction in the low Galactic latitude regions with high dust-contamination where the “Ring” is primarily located.
We use this catalogue to probe the ring-like structure and determine its dimensions and characteristics on the celestial hemisphere opposed to the Galactic centre. In section 2, we discuss the data set we used for our study, presented in section 3. In section 4, we present the results of our search of clusters in the ring-like structure. Section 5 presents N-body simulations of the tidal disruption of the progenitor of the observed structures. Finally, in section 6, we discuss our results and the consequences on the origin of the “Ring”. Throughout this work, we assume that the Solar radius is , that the LSR circular velocity is , and that the peculiar motion of the Sun is (; Dehnen & Binney 1998b).
2 Data
The low Galactic latitude regions that we study here are mainly hampered by two effects: by reddening due to the high concentration of dust in the Galactic plane and by the presence of numerous foreground disk stars. The 2MASS near infrared photometry has the ability to probe the highly obscured regions, but it cannot be directly used to remove the foreground disk stars. Therefore, in order to diminish the contamination of the closest disk stars, we cross-identified the 2MASS and the USNO-B1.0 catalogues in order to complement the 2MASS photometry with proper motion data. This was done for stars with .
In the present study we will work with two samples of stars: sample A is simply the 2MASS ASR point-source catalogue (with 2MASS flags ); It will be used to search for the Galactic “Ring” population. Sample B is identical to sample A, except that we have removed all sources with significant (3) proper motions. The contamination fraction of objects with proper motion corresponds to % of the 2MASS sources, but since they are irregularly distributed in a volume of a few kiloparsecs around the Sun this sample cannot be used to detect assymetries. The proper motion discrimination is however very useful for plotting colour-magnitude diagrams: the disk dwarfs are particularly affected by this process and, since they tend to blend with red giant populations in CMDs, filtering them allows us to follow distant red giant branch (RGB) populations up to 2 magnitudes deeper. However, RGB stars beyond are not removed with this filter, judging from our tests in globular cluster fields (Martin, 2003).
We de-redden the photometric data using the Schlegel, Finkbeiner & Davis (1998) algorithm which interpolates the value from the IRAS 100 micron emission all-sky maps. All the magnitudes stated below are extinction-corrected. In order to use only precise photometry, we remove sources with (the 10-sigma limit of the 2MASS photometry) and with (which corresponds to ). This last limit mainly removes zones near the Galactic plane with from our samples. To make sure we can compare quantitatively the distribution of sources in both hemispheres, we divide the sky into pixels (in Galactic coordinates) flagging as unusable each zone in which the extinction exceeds the chosen limit. However, to maintain North-South symmetry we also flag as unusable the symmetric pixel on the opposite side of the Galactic plane. We also limit our present samples to .
3 Results
3.1 M-giant sample
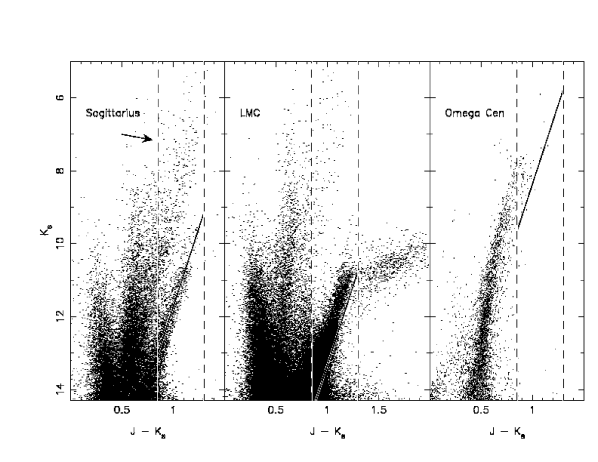
From sample A, we first select a subsample of late M-giant stars using the same colour limits as Majewski et al. (2003): , and . We measure the distance of the Galactic M-giants using the RGB of the Sagittarius dwarf galaxy as a reference, as calibrated by Majewski et al. (2003): . By assuming a distance modulus of for the stellar population at the core of the Sagittarius galaxy (Ibata et al., 1997), one can estimate the distance to other RGB populations. Figure 1 compares the 2MASS colour-magnitude diagrams (CMDs) of the Sagittarius dwarf with those of the Large Magellanic Cloud (LMC) and the globular cluster Omega Centauri; the corresponding distance calibrations are also displayed. The relatively poor fits for the LMC and Omega Cen, are probably due to differences in age and metallicity between these objects and the Sgr galaxy. Using the Sgr RGB calibration to measure the distances of the LMC and Omega Cen would incur a % systematic error, with these distances being underestimated. This systematic uncertainty will cloud all of the distances derived below for the Galactic M-giant population.

A comparison between the northern and southern hemispheres of the distribution of source distances, estimated from sample A, using the Sgr RGB fiducial described above, shows two striking asymmetries, one in each hemisphere (see Figure 2). The southern over-density, located between is the most significant (detected with ). It ranges from to from the Galactic centre and is centred at . The northern over-density ranging from to is further away, between and , with its maximum between and (this peak is detected at ). In both cases there are approximatively twice as many stars in the over-density than in the other hemisphere.
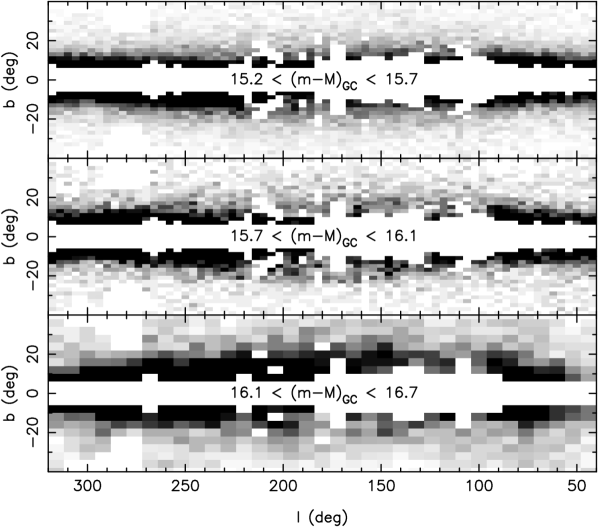
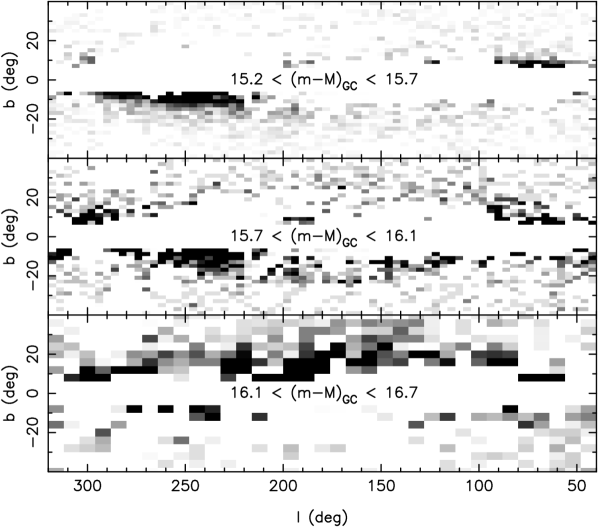
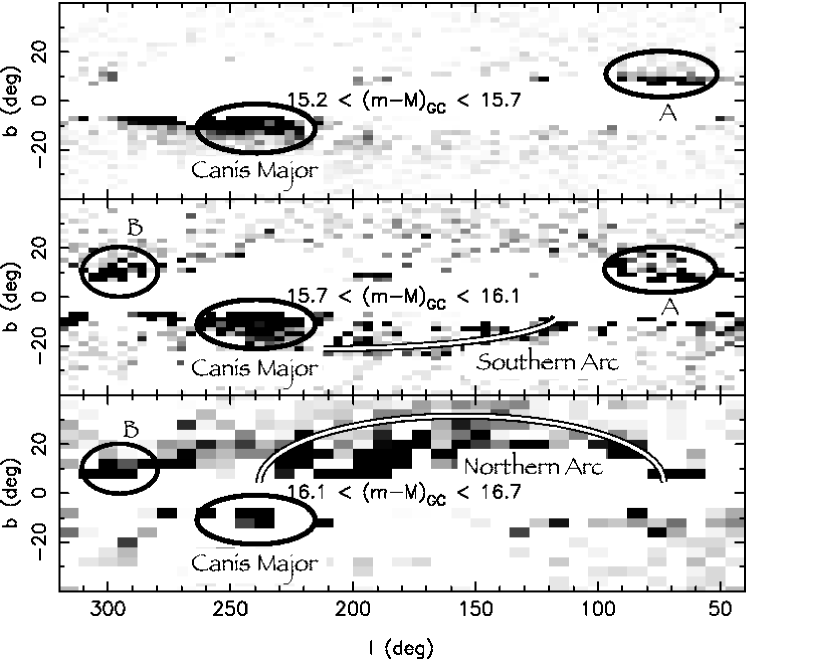
To examine the structures creating these two over-densities, the data in sample A was binned in Galactic coordinates, as presented in Figure 3. In those pixels where more than 50% of the area is below the extinction limit, we have corrected the counts for the area incompleteness; otherwise, the pixel values are set to zero. We impose North-South symmetry to be able to compare the counts between the hemispheres. In the southern hemisphere, for the range, an object is centred at and , in the direction of the Canis Major constellation. It is very dense at its core — with up to eight times the number of stars compared to the symmetric zone in the northern hemisphere — and it seems to be approximately elliptical. These structures are more clearly seen in the difference image displayed in Figure 4, where we have subtracted the star-counts from the opposite hemisphere. The Canis Major over-density is striking, as is the wide arc-like structure in the northern hemisphere. The location of these features is made clearer with schematic overlays in Figure 5.
To measure the dimensions of the Canis Major object, we examine the profiles in the latitude and Heliocentric distance directions (Figure 6). Analysis of the vertical distribution of the population is hampered by the lack of non-dust-contaminated regions for . This puts a high degree of uncertainty on the profile fits since the population could correspond to a Gaussian distribution centred at with a FWHM vertical height of , or alternatively, an exponential distribution with a scale height. It is interesting to note that this scale height derived for the Canis Major structure at is statistically identical to that obtained by I03 for the Galactic Ring, in a field at . This lends some support to the possibility that the structures are related. The Heliocentric distribution of the object can be fit by a Gaussian centred at with FWHM of . While the centre of the distribution can be measured reliably, its FWHM should be taken with caution since the distribution is skewed to large distances. This could be due to the angle of observation of the structure if it is elongated in a direction that is not perpendicular to the line of sight. The precise extent of this object along the longitude axis is harder to compute because the observations are hampered by high extinction regions and by the rapid increase in the number of disk stars at low latitude.

The Northern Arc over-density is visible for (bottom panel of Figures 3 and 4). It begins near the Galactic plane at and then arcs up to and . The best region to compute its vertical height is between because it is further away from the Galactic disk than elsewhere. We find there that the Northern Arc has a Gaussian profile (see Figure 7), centred on and with a vertical width. However, high extinction regions could be responsible for the decrease of star counts under and the vertical width could be underestimated. The thickness of the structure was also computed, this time in the region where the over-density is most pronounced in the northern hemisphere, that is for and . The right-hand panel of Figure 7 shows the best Gaussian fit for the radial profile of the structure: centred on , it has a FWHM line of sight thickness of . This structure is almost certainly due to the M-giants present in the “Galactic Ring” of I03 and Y03. Even with the rather noisy values derived here, the Gaussian vertical FWHM falls in the range of the Y03 and I03 exponential scale height measurements (respectively and ).

A second southern over-density, the “Southern Arc” in Figure 5, ranges over and (i.e. ). This structure is detected at . It is possible that its vertical distribution has a similar Gaussian profile to that of the Northern Arc, but the large highly dust-contaminated region near the disk hampers the interpretation of the observations. This feature may correspond to the southern hemisphere population reported by Y03 in the longitude range and at a distance of . The 30% systematic distance error mentioned earlier may be responsible for the difference in these two distance estimates.

The two main over-densities can be followed around half of the Milky Way. To diminish the projection problems that appear when observing in the quadrant towards the Galactic centre (i.e. for and ), we switched to the Galactocentric cylindrical coordinates . We also limited our sample to since the sources are further away from the Sun. The left panel of Figure 8 shows the Galactocentric distance modulus distribution of stars for where the prolongation of the Canis Major over-density is visible despite the higher number of disk stars. It ranges up to from at least but the presence of the bulge prevents the determination of a precise lower limit. The high radial extent of the over-density is certainly due to the angle of observation. Indeed, it is possible that the structure is, at least partially, not observed perpendicularly but rather tangentially. This would also explain its broad profile and seems to be confirmed when taking smaller ranges of . The right-hand panel corresponds to and shows the prolongation of the Northern Arc. It ranges over which is nearer from the Galactic centre than it was in the direction of the anticentre. It is surprising to find that it is also denser. This could also be due to the angle of observation: if here too we are partially observing the structure tangentially, the star counts will be summed up along the line of sight.
To summarize, we were able to detect two substantial over-densities of M-giants, the Canis Major over-density and the Northern Arc, which together surround half of the Milky Way, at varying Galactocentric radius. This population can be as close as from the Galactic centre for and away in the direction of the anticentre. We also find it probable that it passes from the northern to the southern hemisphere at around .
3.2 Colour-Magnitude Diagrams
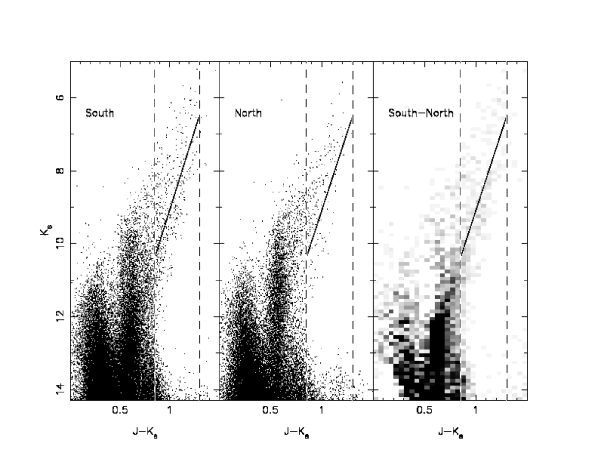
We now examine the stellar populations of the stars in the structure, using the near infrared 2MASS photometry. As can be discerned in Figure 9, the CMD of a region at the centre of the Canis Major object shows two striking features: a red-giant branch population which does not appear on the reference CMD on the other side of the Galactic plane and a high number of stars for and . For comparison, we superimpose on Figure 9 the line of the fiducial RGB sequence of the Sgr dwarf, adjusted to , the distance of the Canis Major structure determined from the analysis of Figure 6. Inspection of the subtracted Hess-diagram shown in the right-hand panel of Figure 9 reveals that the population in this central field is slightly () more distant, than estimated above. An alternative explanation could be that there is a stellar population gradient towards the centre of the structure.
This excess RGB population does not appear to be spatially separated from the Galactic disk, that is, we do not detect a magnitude gap separating this population and the disk red giants in the data presented in the left-hand panel of Figure 9. The structure therefore lies within, or at the edge, of the Galactic disk. The other feature that is present at the bottom of this red giant branch (at , ) is the corresponding red clump of the stellar population. An additional blue plume at is seen in the subtracted Hess diagram; this feature could be an intermediate-age main-sequence population of the Canis Major galaxy, although it could possibly also be an artifact of the subtraction. A deeper optical wide-field survey of the region may help resolve this issue.
The colour-magnitude diagram of the Northern Arc reveals a sparse red giant branch, consistent with a Galactocentric distance of , as we show in the left-hand panel of Figure 10. It appears that there is a small gap between the RGB of this population, and the disk RGB stars, indicating that the structure is separated from the disk at its most distant point. The middle panel of Figure 10 shows a comparison region below the Galactic plane; here, we may also have detected a similar RGB population, though the signal is very weak. This feature may correspond to the “Southern Arc” structure highlighted in Figure 5.
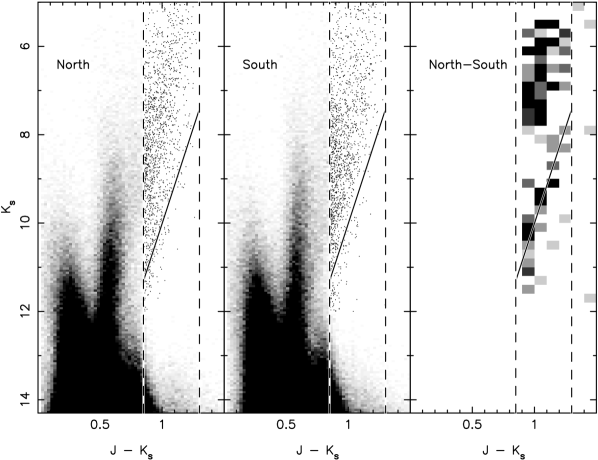
We also searched for the RGB population of the structure in small low extinction windows at very low latitude. However, the low number of the M-giants of interest compared to the high number of stars in the disk prevents any further conclusion on the connection between the Northern Arc and the Canis Major over-densities. The RGB populations for and also have low contrast because the structures are mixed with the disk and the higher number of disk stars weakens the signal due to the over-densities.
3.3 Extinction
Could these inferred over-densities simply be due to errors in the Schlegel, Finkbeiner & Davis (1998) extinction maps? The colour of the vertical CMD feature of disk dwarfs in the extinction-corrected samples is almost identical (to within magnitudes) North and South of the Galactic plane. This is demonstrated in Figure 9, where the sequence of disk dwarfs is seen both on the left-hand panel at in the over-density at , and at the same colour in the symmetric field about the Galactic Plane . Additionally, this sequence is detected in low extinction regions at the same colour, giving us further confidence that the Schlegel, Finkbeiner & Davis (1998) extinction maps are not significantly in error along these sight-lines.
For the RGB-like population present on the subtracted Hess diagram on the right-hand panel in Figure 9 to be caused by extinction errors, would require a contaminating population that runs parallel to that RGB population (but both bluer and brighter). The only available population that has this property is the RGB of the Galactic disk. However, inspection of Figures 2 and 8 shows that the distribution of M-giants on opposite sides of the Galactic Plane match well at the lower distance limits and at the upper distance limits of those diagrams. It is at intermediate distances that a discrepancy is detected. Extinction errors can only rearrange the distance distributions, they cannot cause an apparent overabundance of stars all along the RGB. For these reasons it is unlikely that the detected over-densities are extinction artifacts.
3.4 Mass of the Canis Major structure
To estimate the mass of the Canis Major object, we compare the number of detected M-giants to those observed in the Sagittarius dwarf galaxy. For Canis Major, we subtract the northern hemisphere sample A data from the southern hemisphere and sum under the profiles shown in Figure 6. Within a radius region (but which misses % of the area due to the cutoff and due to the reddening limit) we detect 2300 M-giants. The same measurement around the core of the Sagittarius dwarf galaxy gives an almost identical number of 2200 M-giants. With the caveat that the stellar populations are not the same, this suggests that the Canis Major object has a similar total luminosity to the core of the Sagittarius dwarf galaxy, which has been measured to be (Majewski et al., 2003). If we further assume that the mass to light ratio of the two galaxies is similar, we conclude that the Canis Major object has an almost identical mass to that of the core of the Sagittarius dwarf. The mass of the latter is a matter of some debate (Ibata et al., 1997; Ibata & Lewis, 1998; Helmi & White, 2001; Gómez-Flechoso, Fux & Martinet, 1999), but a range between to seems plausible, with the upper bound being the likely pre-disruption mass of that galaxy.
4 A clustering of globular clusters
While searching for structures in the Galactic globular cluster system that could be connected with the stream of the Sagittarius galaxy (Bellazzini, Ferraro & Ibata, 2003; Bellazzini et al., 2003b), we noted an interesting group of clusters that are not related with Sgr and that are remarkably confined in phase space (Bellazzini et al., 2003c). These four clusters, NGC 1851, NGC 1904, NGC 2298 and NGC 2808, are quite close to one another in space, indeed, they may be enclosed in a sphere with radius centred at Galactic Cartesian coordinates . Among the outer halo globular clusters (those with , see Bellazzini, Ferraro & Ibata, 2003) there is only one other group of globulars that shows similar clustering properties, the clusters associated with the main body of the Sgr dSph galaxy (M 54, Ter 7, Ter 8, and Arp 2). In Figure 11 the spatial distributions of the two groups are compared in two different projections of Cartesian Galactocentric coordinates: NGC 1851, NGC 1904, NGC 2298 and NGC 2808 are as close one to another as the Sgr globulars. It is interesting to recall that the similar proximity of the four Sgr cluster was not noted until the discovery of their parent galaxy (Bellazzini et al., 2003c).

If we consider the radial velocities, the present Sgr globular cluster system appears much more compact () than the considered group (). However the data presented in Figure 12 show that the LSR-corrected radial velocity of the group members correlates well with Galactic longitude. Moreover, their Galactocentric distance also correlates with Galactic longitude. These facts are strongly suggestive of a coherent motion along a common orbit.
After the discovery of this remarkable phase space grouping of globular clusters we noted that their positions are virtually coincident with the Canis Major structure discussed in this paper. The strong analogy with the Sgr case brings us to the conclusion that the two structures are associated and that NGC 1851, NGC 1904, NGC 2298 and NGC 2808 are likely the local remnant of the globular cluster system of the galaxy that was the progenitor of the Canis Major object and the Northern Arc.
These clusters also show some interesting similarities in their intrinsic properties. For instance, their metallicity is enclosed in the relatively limited range , all of them show an extended blue Horizontal Branch in their colour-magnitude diagrams, and NGC 1851 and NGC 2808 are the only two halo clusters showing simultaneously a well populated red clump and a blue tail in their HB morphology (see Harris, 1996; Bedin et al., 2000; Bellazzini et al., 2001, and references therein).
There are other globular clusters that may be related to the Canis Major structure. NGC 1261 is also nearby in space to the above described group but its velocity does not fit well with the velocity gradients shown in Figure 12. We will return to this issue in Section 5 below.


It is also interesting to study the distribution of open clusters in light of the discovery of the Canis Major object. Figure 13 shows the open clusters in the WEBDA database (Mermilliod, 1995) 111The WEBDA database, developed and maintained by J.-C. Mermilliod, can be found on with ; a puzzling asymmetry is evident with absolutely no clusters for the part of the Milky Way. Caveats may include strong uncertainties in distance and/or age since the directions are often obscured and the cluster population is small. Moreover, the presence of the Outer Arm of the Galaxy could provide a stronger background in the quadrant against which it could be more difficult to identify clusters. On the other hand, part of the quadrant is behind the Perseus Arm which is much closer to the Sun: Therefore the considered region suffers from a less severe contamination and the identification of remote clusters is easier.
With these caveats in mind, it is still possible that part of these remote open clusters belong to the Canis Major galaxy. In particular Dol 25 and H 18 which are both young () and with a Heliocentric distance that corresponds to the Canis Major object could be the consequence of a strong perturbation of the disk by the accreted dwarf Galaxy and the resulting enhanced star-formation activity in the disk. We also note that the position of the old open cluster AM2 (previously classified as a globular) nearly coincides with that of the central peak of the Canis Major structure, within the (large) distance uncertainties. Unfortunately the lack of any radial velocity estimate for this cluster prevents any definite conclusion about its possible physical association with the newly discovered object.
5 N-body simulation
We undertook a series of N-body experiments in an attempt to determine whether a single accretion of a dwarf galaxy could be responsible for the detected over-densities and the correlations seen among globular and open clusters. In this first study, we concentrate on constructing a simple model to guide interpretation of the observations, and will defer a more detailed analysis to a subsequent contribution.
For our simulations, we take a static Milky Way potential, which is not perturbed by the passage of the accreted dwarf galaxy. The potential model 2b of Dehnen & Binney (1998a) is adopted, but with the halo component modeled by a spherical NFW halo. Taking a static potential is unrealistic, of course, but it saves a great deal of computation time, making the simulation tractable. The key effects that this approach leaves out are the back-reaction of the dwarf galaxy on the Galactic disk, and the back-reaction on the halo. The disk will likely become deformed (though note that the progenitor of the Galactic “Ring” has an angular momentum vector that is almost at right angles to that of the Galactic warp, so it is unlikely to warp the disk strongly), and these deformations will in turn alter the trajectory of the accreted object. Since we do not include a live halo component, we neglect the back-reaction on the halo (formation of a wake), and the resulting dynamical friction on the dwarf galaxy.
A useful working picture is that the dwarf galaxy began its life as a typical dark matter-dominated dwarf satellite galaxy, far away in the Milky Way halo. The dark matter halo of the dwarf galaxy became progressively more and more disrupted as the orbit decayed. However, the central stellar component stayed largely intact during this initial phase. We start our simulation ago, and assume that by this stage much of the dark matter has been removed from the system, leaving a much less massive dwarf galaxy that will not suffer significant dynamical friction. We therefore do not add dynamical friction in our simulation.
The simulations were performed with falcON, a fast and momentum-conserving tree code (Dehnen, 2000, 2002). Gravity was softened with the kernel “”, with a softening length of . The minimum time-step was set to , and the tolerance parameter . In order to obtain a starting position and velocity for the dwarf galaxy model, we refined iteratively an initial guess of these values, and required that the resulting orbit fit the velocity and position information of the Y03 SDSS and the 2MASS fields presented above, as well as the globular clusters. Acceptable orbits could be fit for both a co-rotating and a counter-rotating object, so we examine both cases below. These fitted orbits have an azimuthal period of and , respectively, for the co-rotating and counter-rotating models.
The initial dwarf galaxy was modeled with a King model with particles. We experimented with several such models, trying out masses in the range of to (the range suggested by Ibata et al. 2003, and which is consistent with the mass estimate derived above), and with different tidal radii and concentration parameters. Some fine-tuning of these parameters is needed to give both a stream and remnant that approximates the observed distribution. One of the better fitting models had a mass , tidal radius and , and it is this model that we will discuss below. However, these values are by no means the required initial parameters of the satellite galaxy. They are sensitive to the orbit, and must therefore also be sensitive to the decay rate of the satellite due to dynamical friction, which we have neglected. The model is therefore only illustrative.
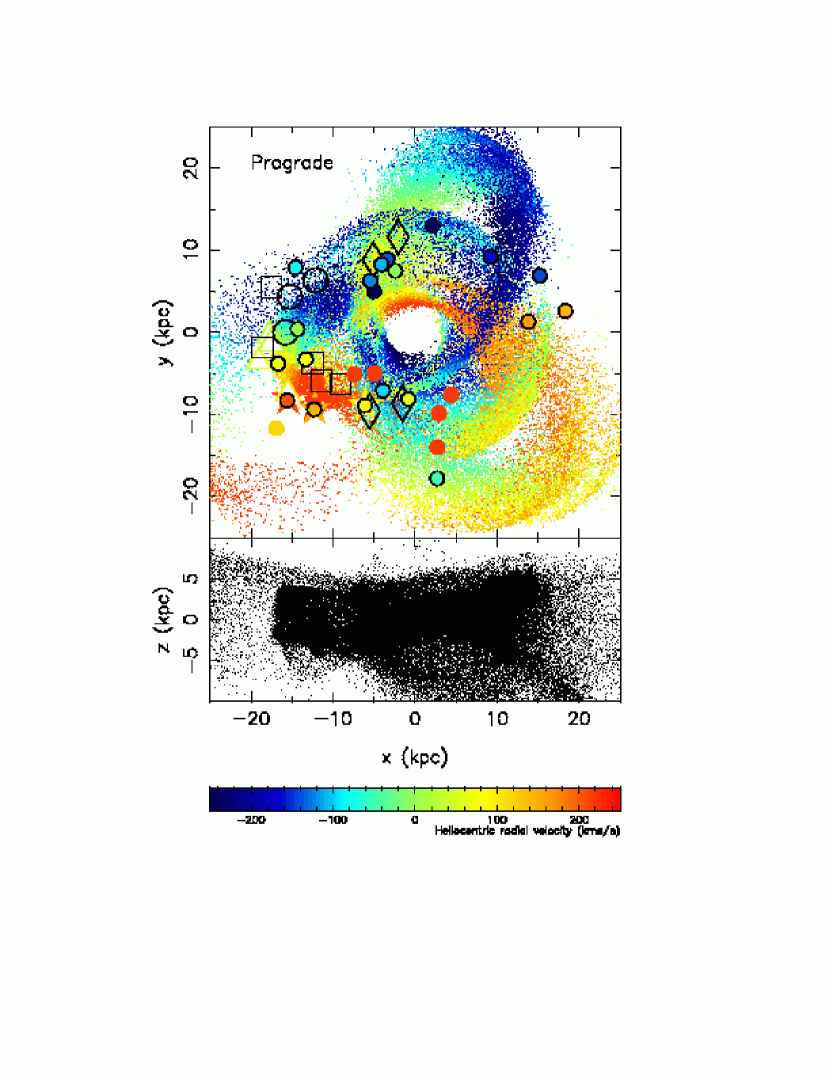
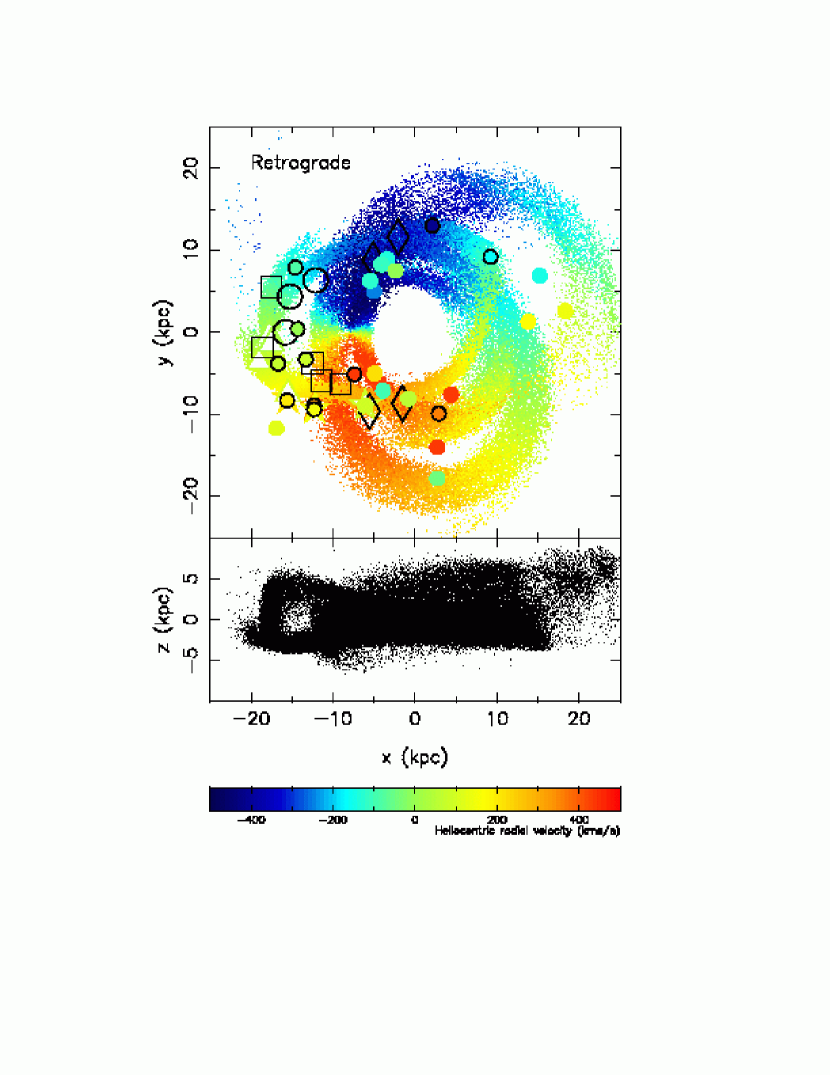
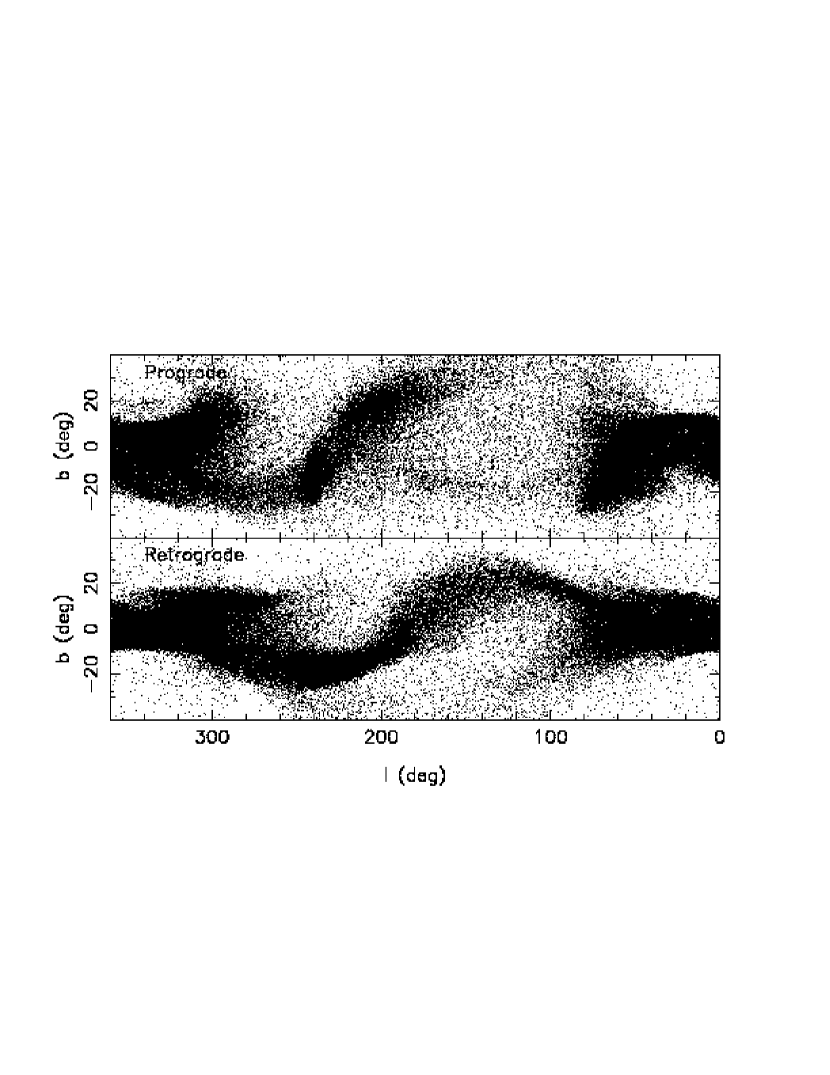
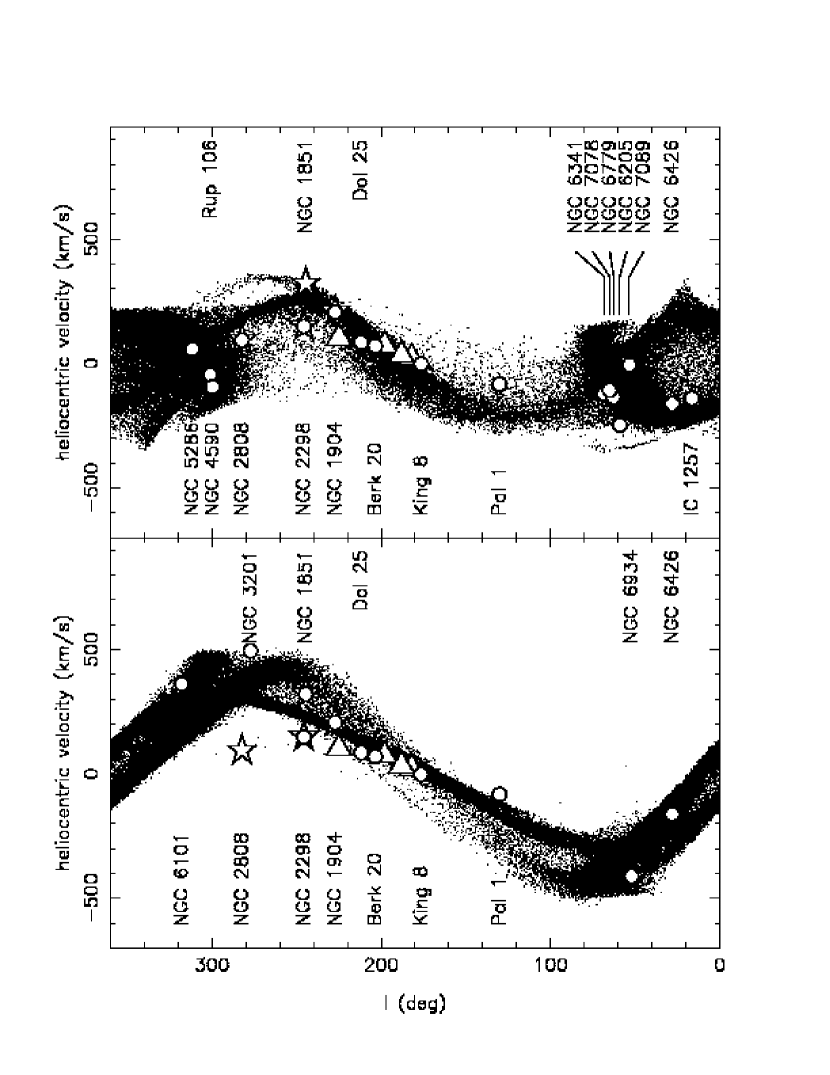
In the top panels of Figures 14 and 15, we show respectively the – configuration (looking down onto the Milky Way from the north Galactic pole) at the end of the simulation, for the co-rotating and counter-rotating models. Given the simplicity of the assumptions the similarity between the simulations and observations is remarkable, though we feel that a formal statistical comparison is not very meaningful at this stage due to the fact that we have left out the self-gravity of the Milky Way. However, what the simulations do show is that the streams that arise naturally during the tidal disruption of a dwarf galaxy can be pulled out to be seen as multiple streams, even in the relatively short time () that we simulated. This may account for the different peaks in the distance modulus distributions (Figures 2 and 8). Figures 14 and 15 also show the positions of the globular clusters that have Galactocentric distances , and that lie within of the Galactic plane. To select the closest star clusters to our simulation, we choose somewhat arbitrarily a simple statistic: ; we list the globular and open clusters that have in the prograde and retrograde models, in Tables 1 and 2 respectively. We defer analyzing the likelihood of the alignment of these star clusters with the Canis Major stream to a future contribution when we present a more realistic simulation with a live Milky Way.
The distribution of the simulation particles projected onto the sky is shown in Figure 16; the models nicely reproduce the curving behaviour of the Northern Arc observed towards the Galactic anticentre (compare to Figure 4), the Canis Major over-density as well as the over-densities “A” and “B” (see Figure 5) seen towards and . The Heliocentric radial velocity profiles of the models are given in Figure 17. To our surprize, we find that current data do not appear to prefer the prograde model over the retrograde. Future measurements of the radial velocity of the stream in directions sufficiently far away from the Galactic anticentre should resolve this uncertainty.
The numerical simulations presented here lend support to the notion that the Canis Major over-density is the remnant of a larger accreted galaxy whose tidal disruption gave rise to the asymmetries in the Galactic M-giant distributions that we report above. If we accept this model, we find that the progenitor had an orbit that was closely aligned with the Galactic Plane (the orbit is inclined at only from the Plane). It is unclear at present whether the object follows a prograde or a retrograde orbit, though a-priori the prograde case would appear to be more likely since it would allow for stronger interactions with the Galactic disk, due to which the orbit would have decayed to its present, rather circular, state. The remaining debris has an apocentre of and a pericentre close to the Solar radius. Indeed, according to the simulations displayed in Figures 14 and 15, the debris from the Canis Major dwarf streams through the Solar Neighbourhood. Comparing the kinematics of the Canis Major stream to the stream discovered by Helmi et al. (1999), the only other large stream known to pass close to the Sun, shows that the streams of our models have very different angular momentum. The angular momentum distribution of the particles within of the Solar Neighbourhood is shown in Figure 18; these particles display very different kinematics, and are unlikely to be associated to the Helmi et al. (1999) stream.

6 Discussion and Conclusions
We have shown that the distribution of M-giant stars at low latitude is highly asymmetric. The most striking over-density is due to an elliptical object present in the disk, in the direction of the Canis Major constellation in the southern Galactic hemisphere at . This structure contains as many M-giant stars as the remnant of the Sagittarius dwarf galaxy. A less dense structure, but of huge proportions, the Northern Arc curves around the Galaxy in the direction of the Galactic anticentre. This arc ranges from the Galactic plane at to at . Between it has a mean displacement of above the Galactic Plane, with a distance of , it is separated from the disk in the radial direction along the line of sight, and has a Gaussian profile of width .
Several other structures are also detected. In the southern hemisphere, the “Southern Arc” population with Galactocentric distance is observed between ; this may be the continuation of the southern hemisphere structure reported by Y03 for and . Two other over-densities are detected towards the Galactic bulge, and close to the Galactic Plane: one is found between at , while the other is between at .
Given these observations, we examine the idea of an in-plane accretion of a dwarf satellite galaxy onto the Milky Way. The realization that the four globular clusters NGC 1851, NGC 1904, NGC 2298, and NGC 2808, are close to each other in phase space and are also close in position and distance to the Canis Major over-density also lends strong support to this possibility. In this scenario the remnant of the satellite is likely the object in the direction of Canis Major. During the tidal disruption process, the dwarf galaxy loses stars in a long stream which loops around the Milky Way and is now seen as the Monoceros “Ring” structure. The two other hypotheses presented by I03 do not seem to be allowed by our observations. Indeed, the height of the structure (generally more than ) could hardly be explained by a spiral arm. Furthermore, the multiple peaks in the distance distribution are more suggestive of multiple crossings of a stream rather than of a ring-like Galactic structure, produced by the dynamical evolution of ancient stellar warps.
The simple N-body models we presented reproduce many of the observed spatial features, including the Canis Major over-density, the vast ring-like arc towards the Galactic anticentre, the over-densities towards and , as well as faint debris scattered out to large distance below the Galactic Plane in the anticentre direction. The models also reproduce the available kinematic data and point to the possibility that several star clusters, apart from those close to the Canis Major over-density, could be related to the Canis Major Stream. The success of this simple model strongly suggests that many, if not all, of the asymmetries in the Galactic M-giant population presented above, are due to a single accretion event. The accreted satellite must have had an orbital plane closely aligned to the plane of the Milky Way galaxy. Our analysis shows that the “shell” model of Helmi et al. (2003) gives poor agreement with the observations, but we confirm the tidal stream model for the “Monoceros Ring” proposed by Y03.
The observations and model also suggest a connection to the Galactic thick disk. The orbital eccentricity of the model is , a value that is typical for Galactic thick disk stars of metallicity (Chiba & Beers, 2000). Furthermore, the vertical exponential scale height of the debris , is very close to the thick disk value of determined by Reylé & Robin (2001). It is therefore possible that we have uncovered one of the galactic building blocks from which the thick disk grows. This analysis suggests that the thick disk is continually growing, even up to the present time, through accretions of dwarf galaxies in co-planar orbits. Although with a progenitor mass of , as suggested by our analysis, only a handful of accretions of the magnitude of that of the Canis Major dwarf galaxy are needed to populate the thick disk entirely. Globular clusters with disk-like kinematics may also have been brought to their present locations in this way. The observations and modeling we presented strongly support the analysis of Abadi et al. (2002), in which a large proportion of thick stars have their origin in accreted galaxy fragments. If the scenario we have developed here is correct, thick disks should be a generic component of giant spiral galaxies, since accretions are a generic feature of galaxy formation. Furthermore, at the edge of the disk where the dynamical times are longest, their structure will likely be a complex mess where streaming debris from the most recent accretions piles up at apocentre. These messy structures may indeed already have been detected in the Andromeda galaxy (Ibata et al., 2001b; Ferguson et al., 2002).
Further observational work is needed to constrain the kinematics of the structures we report here. These constraints are needed to determine whether the structure follows a prograde or a retrograde orbit, to verify the kinematic predictions of our models, as well as to guide future simulations. Detailed abundance distributions will also be invaluable in order to study the chemical difference between an accreted population, such as that of the Canis Major galaxy, and that of the normal Galactic disk. Future simulations with a live Milky Way will provide a more realistic comparison to the observations. It will be interesting to investigate the reaction of the Galactic disk stars and in particular the reaction of the HI gas, to this sizable accretion, while the back-reaction onto the Canis Major dwarf galaxy will be essential in order to model its dynamical evolution accurately.
Acknowledgments
We are grateful to A. Bragaglia and L. Monaco for useful suggestions and discussion, and to A. Helmi for kindly providing the kinematics of the Solar Neighbourhood stream stars. MB acknowledges the financial support to this research by the Italian Ministero dell’Università e della Ricerca Scientifica (MURST) through the grant p. 2001028879, assigned to the project Origin and Evolution of the Galactic Spheroid.
This publication makes use of data products from the Two Micron All Sky Survey, which is a joint project of the University of Massachusetts and the Infrared Processing and Analysis Center/California Institute of Technology, funded by the National Aeronautics and Space Administration and the National Science Foundation.
| Name | |||||
|---|---|---|---|---|---|
| (deg) | (kpc) | ||||
| IC 1257 | 16.5 | 2.7 | -140.2 | -138.8 | 1.8 |
| NGC 6426 | 28.1 | 2.2 | -162.0 | -148.3 | 1.7 |
| NGC 7089 | 53.4 | 1.5 | -5.3 | 15.8 | 1.6 |
| NGC 6205 | 59.0 | 2.7 | -246.6 | -235.7 | 2.2 |
| NGC 6779 | 62.7 | 1.0 | -135.7 | -137.1 | 0.2 |
| NGC 7078 | 65.0 | 2.2 | -107.3 | -97.3 | 1.5 |
| NGC 6341 | 68.3 | 0.9 | -122.2 | -114.3 | 0.4 |
| Pal 1 | 130.1 | 2.6 | -82.8 | -88.0 | 1.8 |
| King 8 | 176.4 | 0.9 | -2.0 | -9.9 | 0.4 |
| Berk 20 | 203.5 | 0.8 | 70.0 | 69.6 | 0.1 |
| Dol 25 | 211.9 | 1.1 | 85.0 | 73.8 | 0.6 |
| NGC 1904 | 227.2 | 2.8 | 206.0 | 195.3 | 2.2 |
| NGC 2298 | 245.6 | 3.3 | 148.9 | 150.9 | 2.7 |
| NGC 2808 | 282.2 | 1.4 | 93.6 | 91.2 | 0.5 |
| NGC 4590 | 299.6 | 2.5 | -94.3 | -102.0 | 1.7 |
| Rup 106 | 300.9 | 1.6 | -44.0 | -33.2 | 0.9 |
| NGC 5286 | 311.6 | 2.7 | 57.4 | 63.4 | 1.9 |
Data extracted from Harris (1996) and Mermilliod (1995). Column 2 states the Galactic longitude of the cluster; column 3 lists , the difference in position between the simulation and the cluster; columns 4 and 5 list, respectively, the Heliocentric radial velocity of the cluster and simulation; finally, in column 6, we give the value of the closeness statistic.
| Name | |||||
|---|---|---|---|---|---|
| (deg) | (kpc) | ||||
| NGC 6426 | 28.1 | 1.6 | -162.0 | -169.0 | 0.7 |
| NGC 6934 | 52.1 | 3.2 | -411.4 | -411.2 | 2.5 |
| Pal 1 | 130.1 | 1.1 | -82.8 | -92.8 | 0.5 |
| King 8 | 176.4 | 1.8 | -2.0 | -9.3 | 0.9 |
| Berk 20 | 203.5 | 0.6 | 70.0 | 71.4 | 0.1 |
| Dol 25 | 211.9 | 1.9 | 85.0 | 87.8 | 0.9 |
| NGC 1904 | 227.2 | 2.8 | 206.0 | 201.1 | 2.0 |
| NGC 1851 | 244.5 | 1.6 | 320.5 | 340.4 | 1.7 |
| NGC 2298 | 245.6 | 1.9 | 148.9 | 150.7 | 0.9 |
| NGC 3201 | 277.2 | 1.2 | 494.0 | 482.5 | 0.7 |
| NGC 6101 | 317.8 | 0.5 | 361.4 | 361.1 | 0.1 |
References
- Abadi et al. (2002) Abadi M., Navarro J., Steinmetz M. & Eke V. astro-ph/0212282
- Bedin et al. (2000) Bedin, L.R., Piotto, G., Zoccali, M., Saviane, I., Cassisi, S., & Bono, G., 2000, A&A363, 159
- Bellazzini et al. (2001) Bellazzini, M., Fusi Pecci, F., Ferraro, F.R., Galleti, S., Catelan, M., & Landsman, W.B., 2001, AJ122, 2569
- Bellazzini, Ferraro & Ibata (2003) Bellazzini M., Ferraro F. R. & Ibata R. 2003a, AJ 125, 188
- Bellazzini et al. (2003b) Bellazzini M., Ibata R., Ferraro F. R. & Testa V. 2003b, A&A 405, 577
- Bellazzini et al. (2003c) Bellazzini M., Ibata R., Ferraro F. R., 2003c, in Satellites and Tidal Tails, D. Martinez-delgado and F. Prada Eds., S. Francisco, ASP, ASP Conf. Series, in press astro-ph/0304502
- Burton & Te Lintel Hekkert (1986) Burton W. & Te Lintel Hekkert P., A&ASupp 65, 427
- Chiba & Beers (2000) Chiba, M., Beers, T. 2000, AJ 119, 2843
- Clementini et al. (2003) Clementini, G., Gratton, R., Bragaglia, A., Carretta, E., Di Fabrizio, L., Maio, M. 2003, AJ 125, 1309
- Dehnen & Binney (1998a) Dehnen, W. & Binney, J. 1998, MNRAS 294, 429
- Dehnen & Binney (1998b) Dehnen, W. & Binney, J. 1998, MNRAS 298, 387
- Dehnen (2000) Dehnen, W. (2000), ApJ 536, 39L
- Dehnen (2002) Dehnen, W. (2002), J. Comput. Phys. 179, 27
- Ferguson et al. (2002) Ferguson, A., Irwin, M., Ibata, R., Lewis, G., Tanvir, N. 2002, AJ 124, 1452
- Gómez-Flechoso, Fux & Martinet (1999) Gómez-Flechoso, M.-A., Fux, R., Martinet, L. 1999, A&A 347, 77
- Harris (1996) Harris, W.E., 1996, AJ112, 1487
- Helmi et al. (1999) Helmi, A., White, S., de Zeeuw, T., Zhao, H.-S. (1999), Nature 402, 53
- Helmi & White (2001) Helmi, A., White, S. (2001), MNRAS 323, 529
- Helmi et al. (2003) Helmi A., Navarro J., Meza A, Steinmetz M. & Eke V. 2003, ApJ 592L, 25
- Ibata et al. (1997) Ibata, R., Wyse, R., Gilmore, G., Irwin, M. & Suntzeff, N. 1997, AJ 113, 634
- Ibata & Lewis (1998) Ibata, R., Lewis, G. 1998, ApJ 500, 575
- Ibata et al. (2001a) Ibata R., Lewis G., Irwin M., Totten E. & Quinn T. 2001, ApJ 551, 294
- Ibata et al. (2001b) Ibata, R., Irwin, M., Lewis, G., Ferguson, A., Tanvir, N. 2001, Nature 412, 49
- Ibata et al. (2002) Ibata R., Lewis G., Irwin M. & Cambrésy L. 2002, MNRAS 332, 921
- Ibata et al. (2003) Ibata R., Irwin M., Lewis G., Ferguson A. & Tanvir N. 2003, MNRAS 340, 21
- Majewski et al. (2003) Majewski S., Skrutskie M., Weinberg M. & Ostheimer J. 2003, astro-ph/0304198
- Martin (2003) Martin, N. (2003), DEA thesis, Université de Strasbourg
- Mermilliod (1995) Mermilliod, J.-C. 1995, in ”Information and On-Line Data in Astronomy”, Eds D. Egret & M.A. Albrecht (Kluwer Academic Press, Dordrecht), p. 127-138 The database for galactic open clusters (BDA)
- Newberg et al. (2002) Newberg H., et al. 2002, ApJ 569, 245
- Reylé & Robin (2001) Reylé, C., Robin, A. (2001), A&A 373, 886
- Rocha-Pinto et al. (2003) Rocha-Pinto H., Majewski S., Skrutskie M. & Crane J. 2003, ApJ 594, 115L
- Schlegel, Finkbeiner & Davis (1998) Schlegel D., Finkbeiner D. & Davis M. 1998, ApJ 500, 525
- White, Rees (1978) White, S., Rees, M. 1978, MNRAS 183, 341
- White, Frenk (1991) White, S., Frenk, C. 1991, ApJ 379, 52
- Yanny et al. (2003) Yanny B., et al. 2003, ApJ 588, 824