Could There Be A Hole In Type Ia Supernovae?
Abstract
In the favored progenitor scenario, Type Ia supernovae (SNe Ia) arise from a white dwarf accreting material from a non-degenerate companion star. Soon after the white dwarf explodes, the ejected supernova material engulfs the companion star; two-dimensional hydrodynamical simulations by Marietta et al. (2000) show that, in the interaction, the companion star carves out a conical hole of opening angle 30∘-40∘ in the supernova ejecta. In this paper we use multi-dimensional Monte Carlo radiative transfer calculations to explore the observable consequences of an ejecta-hole asymmetry. We calculate the variation of the spectrum, luminosity, and polarization with viewing angle for the aspherical supernova near maximum light. We find that the supernova looks normal from almost all viewing angles except when one looks almost directly down the hole. In the latter case, one sees into the deeper, hotter layers of ejecta. The supernova is relatively brighter and has a peculiar spectrum characterized by more highly ionized species, weaker absorption features, and lower absorption velocities. The spectrum viewed down the hole is comparable to the class of SN 1991T-like supernovae. We consider how the ejecta-hole asymmetry may explain the current spectropolarimetric observations of SNe Ia, and suggest a few observational signatures of the geometry. Finally, we discuss the variety currently seen in observed SNe Ia and how an ejecta-hole asymmetry may fit in as one of several possible sources of diversity.
1. Introduction
1.1. Asymmetry of Type Ia Supernovae
Some Type Ia supernovae (SNe Ia) are known to be aspherical; direct evidence for this comes from optical spectropolarimetric observations. Because a spherically symmetric system has no preferred direction, the polarization integrated over the projected supernova surface cancels – detection of a non-zero intrinsic polarization demands some degree of asymmetry. The measured intrinsic polarization of SNe Ia is relatively small, but certainly detected in a few cases. Pre-maximum observations of the normal Type Ia SN 2001el using the ESO Very Large Telescope found an intrinsic polarization level of , which decreased at later epochs (Wang et al., 2003; Kasen et al., 2003a). Intrinsic polarization of was also measured for the underluminous and spectroscopically peculiar SN 1999by (Howell et al., 2001).
The geometry of SNe Ia must be closely tied to the supernova explosion physics and progenitor system, both of which are still under debate. But little is known about the shape of the ejecta. For both SN 1999by and SN 2001el we do know that the bulk of the ejecta obeyed a nearly axial symmetry. This is because in both cases, after subtraction of the interstellar polarization, the polarization angle was fairly constant over the entire spectral range (with the exception of an unusual high-velocity calcium feature in SN 2001el). Most theoretical attempts at modeling the spectropolarimetry have so far assumed the ejecta was ellipsoidal (Howell et al., 2001; Wang et al., 1997; Jeffrey, 1991; Höflich, 1991). A shape like this might arise, for example, in the explosion of a rapidly rotating progenitor star.
Another potential cause of asymmetry in SNe Ia is the binary nature of the progenitor system. In the favored progenitor scenario (the single-degenerate scenario; see Branch et al. (1995) and references therein), SNe Ia arise from a white dwarf accreting material from a non-degenerate companion star. The companion may be either a main sequence star, a red-giant, or a subgiant; as it is close enough to be in Roche-lobe overflow, it subtends a substantial solid angle from the perspective of the white dwarf. The supernova explosion occurs when the white dwarf has accreted enough matter that the densities and temperatures at the center are sufficient to ignite carbon, just below the Chandrasekhar limit. The ejected supernova material moves at a few percent of the speed of light and soon after the explosion (from minutes to hours) engulfs the companion star. In the impact it would not be surprising if a substantial asymmetry was imprinted on the supernova ejecta.
The ejecta-companion interaction has been studied with two-dimensional hydrodynamical models by Fryxell & Arnett (1981), Livne et al. (1992), and most recently and extensively by Marietta et al. (2000). These studies were primarily concerned with the fate of the companion star, in particular how much hydrogen gets stripped from its outer envelope. Stripped hydrogen may appear as narrow Balmer emission lines in the supernova spectrum, which if observed might provide direct evidence of a binary progenitor system. With the advance of spectropolarimetric observations, however, the nature of SN Ia asphericity becomes another relevant test of the single-degenerate progenitor scenario. In their hydrodynamical models, Marietta et al. (2000) find that the impact with the companion star carves out a conical hole in the supernova ejecta. The opening angle of the hole is 30∘-40∘, and because the ejecta is moving supersonically, the hole does not close with time. The final configuration is axially symmetric, as was seen in the polarization observations of SN 2001el.
In this paper we use multi-dimensional radiative transfer calculations to address the possibility of SNe Ia having an ejecta hole asymmetry. We calculate the variation of the spectrum, luminosity, and polarization with viewing angle for the aspherical supernova near maximum light. In contrast to the ellipsoidal models, the angular variations in an ejecta-hole geometry can be rather extreme, especially when one looks near the hole itself. These variations would necessarily introduce some diversity into the observed properties of SNe Ia. The question is: exactly what sort of diversity arises in the ejecta-hole geometry, and does this fit in with the diversity already known to exist in SNe Ia?
While SNe Ia are considered to be a rather homogeneous class of objects, they do show some variety in their spectral and photometric properties. The observed peak magnitudes of SNe Ia vary by mag, and the brightness is found to correlate with the width of the light curve (Phillips, 1993). The spectra of SNe Ia can be classified as either normal or peculiar (Branch et al., 1993). The peculiar spectra have feature strengths at maximum light that differ from “normal” cases (such as SN 1981B), and are usually subdivided into two classes: SN 1991bg-like supernovae have a broad Ti II absorption trough not seen in the normals (Filippenko et al., 1992a); SN 1991T-like supernovae have weak or absent features from singly ionized species but noticeable Fe III lines (Filippenko et al., 1992b; Phillips et al., 1992; Jeffery et al., 1992). Not all supernovae fit cleanly into the classification scheme. In its pre-maximum spectra, SN 1999aa resembled SN 1991T, but by maximum light it had begun to look much more normal, with Si II and Ca II lines that were stronger than SN 1991T but weaker than normal (Li et al., 2001b). As such SN 1999aa is considered by some to be an intermediate link between the normal and the SN 1991T-like supernovae. Other observations have uncovered singular objects like SN 2000cx (Li et al., 2001a) and SN 2002cx (Li et al., 2003), that while resembling SN 1991T in some ways (weak Si II, strong Fe III lines) showed other peculiarities that were unique. Additional spectral diversities include the abnormally high photospheric velocities of SN 1984A (Branch, 1987) and the detached, high velocity features seen in several supernovae (Hatano et al., 1999; Wang et al., 2003; Thomas et al., 2003). The diversity of SNe Ia is thus multi-faceted, a point we return to in the conclusion.
2. The Ejecta-Hole Model
2.1. Density and Composition Structure
The ejecta model used in the calculations is based on the spherical W7 explosion model (Nomoto et al., 1984), which has often been used in spherical radiative transfer calculations to model the spectra of normal SNe Ia (Lentz et al., 2001; Jeffery et al., 1992; Nugent et al., 1997). The composition structure of W7 consists of an inner 56Ni zone ( km s-1), a middle zone of intermediate mass elements (9000 km s-1 15,000 km s-1) and an outer unburned region of carbon-oxygen rich material ( km s-1). In our calculations we found it necessary to make one adjustment to the compositions; to reproduce the depth and width of the Ca II H&K feature in a normal SN Ia, we needed to increase the calcium abundance by a factor of 10 in the outer C-O region. The difficulty W7 has in fitting the Ca II H&K feature has already been noted by Lentz et al. (2001) in the context of detailed NLTE models. The lack of burned material above 15,000 km s-1 may indicate a weakness of the parameterized deflagration explosion model used.
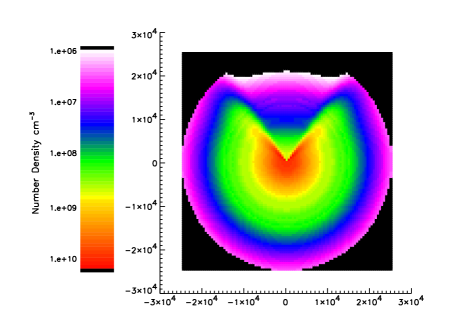
To introduce an ejecta hole into the spherical model, we describe the density structure by an analytic function that in the radial direction well reproduces W7:
| (1) |
where km s-1 and is set by the condition that total mass of the ejecta equals a Chandrasekhar mass. is an angular density variation function which would equal one in a spherical model. For the ejecta-hole model, we use a constructed function which resembles the structure seen in the interaction models of Marietta et al. (2000). The conical hole has a half opening angle of and the density in the hole is a factor less then that outside. The material that is displaced from the hole gets piled up into a density peak just outside the hole edge, with angular size . The function invented to reproduce these features is:
| (2) |
where
| (3) |
where and . The constant is set by the condition that the mass within a shell is equal to that in the spherical model (i.e the integral of over solid angle is equal to ). The density structure is shown in Figure 1.
This analytic function does not capture all the complexity present in a hydrodynamical model; for example, Marietta et al. (2000) point out that the opening angle of the hole is slightly smaller at high velocities than low velocities ( as opposed to ). Of course, the benefit of using a simple analytic function is that it isolates the essential geometrical consequences of a hole asymmetry; in addition it allows us to test in a parameterized way how varying the ejecta hole structure affects the observable signatures. Once the general ideas are understood, one can perform more specific calculations using hydrodynamical models spanning a wide range of initial progenitor conditions.
In the ejecta/companion interaction, as much as 0.1-0.5 of hydrogen rich material can be stripped and ejected from the companion star (Wheeler et al., 1975; Marietta et al., 2000). This material is not included in our calculations. The vast majority of the stripped material has low velocity ( km s-1) and sits at the center of the ejecta, where it will not affect the spectrum or polarization near maximum light. A small amount of material may be ejected at high velocities and could be related to the high-velocity spectral features seen, for example, in SN 2001el and SN 2000cx. Both Branch et al. (2003) and Thomas et al. (2003) have suggested an identification of high-velocity in SN 2000cx, which if correct would strongly suggest that the material was associated with the companion in some way. While not addressed in this paper, the observable consequences of the stripped material should be explored further with multi-dimensional transfer calculations that include a NLTE treatment of hydrogen.
2.2. Monte Carlo Code
Our calculations are carried out with a Monte-Carlo (MC) radiative transfer code, described in detail in Kasen et al. (2003b). The code applies principles described in, e.g. Lucy (1999); Mazzali & Lucy (1993); Code & Whitney (1995). In the MC approach, photon packets are emitted from within the supernova envelope and tracked through randomized scatterings and absorptions until they escape the atmosphere. Each packet is of a specific wavelength and contains a Stokes vector which describes its polarization state. All packets escaping in a certain direction are collected to construct the spectrum and polarization of the supernova from that viewing angle. Our calculations use 100 angular bins, equally spaced in , to collect escaping photon packets. While the code can handle arbitrary three-dimensional (3-D) geometries, for the axially-symmetric models of this paper we use a two-dimensional (2-D) Cartesian grid of cells to represent the supernova atmosphere.
One important issue in multidimensional MC transfer is where to place the emission source of photon packets. While most MC calculations emit packets from a spherical inner boundary surface (the inner ‘light bulb”), in an ejecta-hole model such an approach would provide a poor representation of the geometry. Therefore we have developed an integrated multi-dimensional gamma ray transfer MC to determine exactly where radioactive energy from decaying 56Ni and 56Co is deposited in the supernova envelope (see § 3.1). The optical photon packets are then emitted from individual cells throughout the atmosphere, proportional to the local instantaneous energy deposition rate. There is no inner boundary surface, and photons are allowed to propagate throughout the entire supernova envelope, including the optically thick center. Overall, this approach is likely a good approximation to the actual conditions in SNe Ia, as the luminosity at maximum light is dominated by radioactive energy deposition. However a proper treatment would also take into account diffusive energy stored in the supernova envelope by solving the full time-dependent radiative-hydrodynamics problem.
The opacities used in the calculation are electron scattering and bound-bound transitions; we ignore bound-free and free-free opacities as these are much less important in SN Ia atmospheres (Pinto & Eastman, 2000b). Excitation and ionization are computed assuming LTE, where the temperature structure of the atmosphere is determined self-consistently using an iterative approach which imposes radiative-equilibrium. Line processes included are absorption and scattering, according to a two level atom with thermalization parameter (Nugent et al., 1997). Because the detailed NLTE source function of the material is not calculated, packets are initially emitted according to a blackbody distribution with characteristic temperature . We choose so as to reproduce the continuum in the red end of the observed spectrum; the blue end of the spectrum shows very little dependence on , as packets with are absorbed and re-emitted in lines. The photon packets are initially emitted unpolarized but acquire polarization by electron scattering. Line scattered light is assumed to be unpolarized due to complete redistribution, as in the models of Höflich et al. (1996), Howell et al. (2001), and Kasen et al. (2003a).
3. Results
We have computed the gamma-ray deposition, optical spectrum, relative luminosity and polarization of the ejecta hole model near maximum light (20 days after the explosion) as a function of the viewing angle . Because the current Monte Carlo code is not time-dependent, we leave for future work the effect on the asymmetry on the light curve. For the maximum light model, the total luminosity used is ergs and the emission temperature K. We discuss the various results in turn.
3.1. Gamma Ray Deposition
In the W7 explosion models, of radioactive 56Ni is synthesized and will power the supernova luminosity. The majority of the decay energy from 56Ni and its daughter 56Co is released as gamma rays, which deposit their energy in the supernova ejecta primarily through Compton scattering. It takes only a few Compton scatterings for a gamma ray to give up the majority of its energy to fast electrons, which are in turn assumed to be thermalized locally. We compute the gamma ray energy deposition with a MC transfer routine that includes Compton and photo-electric opacities and also produces gamma ray spectra.
In a spherical SN Ia model, the gamma ray trapping is very effective at maximum light. In the inner 56Ni zone, the mean free path to Compton scattering is only 300 km s-1 and so gamma rays deposit energy nearly coincident to where they are created; only about 4% of the gamma ray energy escapes the atmosphere. Inside an ejecta hole, on the other hand, the mean free path is 20 times greater due to the lower density. Gamma rays generated in the hole can therefore escape the atmosphere, at least those that are emitted in the outward direction. This energy loss is not very significant, however, as the hole is largely evacuated and contains less then 1% of the total 56Ni mass. The material that has been displaced from the hole (containing 11% of the total 56Ni mass) is piled up around the hole edge, where the density is high, and the gamma ray trapping is even more efficient than in a spherical model. Thus we find the perhaps unexpected result that the ejecta hole actually slightly enhances the gamma ray trapping at maximum light, from 96% to 97%.
Using Arnett’s law as a rough rule of thumb (Arnett, 1982), the luminosity of a SN Ia at maximum light should be comparable to the instantaneous rate of energy deposition. One therefore expects that in the ejecta-hole model the total luminosity at peak will be close to (perhaps slightly greater than) a spherical model. In other words, although the aspherical supernova will appear significantly dimmer or brighter depending upon the viewing angle (as we will see in § 3.4), the specific luminosity integrated over all viewing angles will not be entirely different from the spherical case. However, time-dependent calculations are needed to properly address this question, and so we leave it for future work.
3.2. The P-Cygni Profile
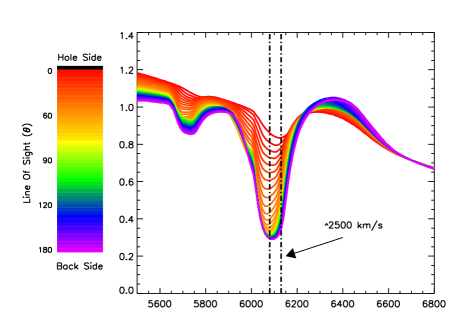
Line opacity in a spherical, expanding SN atmosphere gives rise to the well known P-Cygni profile – i.e. a blueshifted absorption trough with a redshifted emission peak. An ejecta-hole asymmetry dramatically alters the line profile from some lines of sight, as shown in Figure 2. The major effects are readily apparent: in the typical P-Cygni formation, material in front of the photosphere obscures the light below and gives rise to the blueshifted absorption feature. When one looks down the ejecta hole (), the density of this obscuring material is much lower and the line absorption features are thus much weaker. There is little change, however, in the redshifted emission component. Thomas et al. (2002) have pointed out that asymmetries have the most dramatic effect on absorption features, as the absorption depth is related directly to how much of the photosphere is covered by line opacity.
As one looks away from the hole, the line absorption depth increases rapidly, until for the depth is equal to that of the spherical model. For side-on views ), the hole is in the emission region – because some emitting material is then lacking one expects the P-Cygni emission feature to be depressed near the line wavelength center. The missing material, however, amounts to only 11% of the total emitting area, so the effect is hardly noticeable. For , the line profile changes very little with viewing angle.
The minima of the absorption features are also less blueshifted when viewed down the hole, by about 2000-3000 km s-1. This is because the hole allows one to see relatively deeper into the ejecta. In a spherical model, P-Cygni features are formed primarily by material at or above the supernova photosphere, while layers below will not be visible until the expanding supernova thins out and the photosphere recedes. For views down the ejecta hole, however, the electron scattering photosphere has an odd shape, resembling the conical hole of Figure 1. As radiation streams radially out the hole, absorption features are caused by relatively deeper layers of ejecta. This deeper material will tend to be hotter, more ionized and perhaps of a different composition than the material in the outer layers. One therefore expects that the features of more highly ionized species will be relatively more prominent when the supernova is viewed down the hole. The exact line strengths depend, of course, upon the temperature and ionization structure in the 2-D atmosphere, which is calculated self-consistently in LTE in our models.
3.3. Spectrum Near Maximum Light
In sum, the spectrum in the ejecta-hole model will look the same as in a spherical model for all lines of sight except when one looks almost directly down the hole (). In the latter case, one sees a peculiar spectrum characterized by more highly ionized species, weaker absorption features, and lower absorption velocities. We show the variation of the maximum light spectrum with viewing angle in Figure 3. Notice in particular the dramatic effect the hole has on the Si II and Ca II features, the iron blend near 5000 Å, and the UV region of the spectrum ( Å).
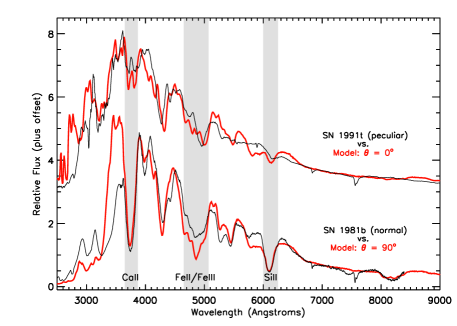
Figure 4 compares the model spectra to two well known SNe Ia. The view away from the hole () resembles the normal Type Ia SN 1981B. The model reproduces most of the major spectral features, although there are a few discrepancies. The most obvious is that the flux peak near is much to large in the model. Because the opacity at this wavelength is largely due to Co II lines, models which mix some 56Ni out to higher velocities can suppress the peak (see Branch et al. (1985); Jeffery et al. (1992)). The poor match is also likely in a part due to the approximate treatment of wavelength redistribution in our calculations (a constant , two level atom).
The spectrum down the hole () is clearly very different than a normal SN Ia. We compare it to the peculiar SN 1991T, which it resembles in the following ways: (1) the Si II absorption near 6150 Å is weak and has an unusually low velocity ( km s-1); in addition, the Si II absorption at 4000 Å is absent. (2) The Ca II H&K feature is weak and shows a “split” into two lines (due to Ca II H&K and Si II ; Nugent et al. (1997)); in addition, the Ca II IR triplet absorption is absent. (3) In the iron blend near 5000 Å, the broad Fe II absorption is weak while the sharper Fe III feature to the red is prominent. (4) The ultraviolet portion of the spectrum (2500 Å Å) is much brighter down the hole, due to the decreased line blocking.
For now, the comparison of Figure 4 is meant only to illustrate that the spectrum emanating from the hole would be categorized as having so-called SN 1991T-like peculiarities. What connection, if any, the hole asymmetry may have to SN 1991T itself will be discussed further in the conclusion. Note that there are also apparent differences between SN 1991T and the model, among them: (1) The S II “W-feature” near 5500 Å is weak but visible in the model, whereas no clear feature is seen in SN 1991T; (2) The model has too much emission in the Si II 6150 and Ca II IR triplet features. (3) The velocities of the Fe III lines are too low in the model, by about 2000 km s-1. The Fe III lines are forming just at the edge of the exposed iron/nickel core, so an explosion model that had a slightly larger 56Ni zone than W7 might provide a better match SN 1991T.
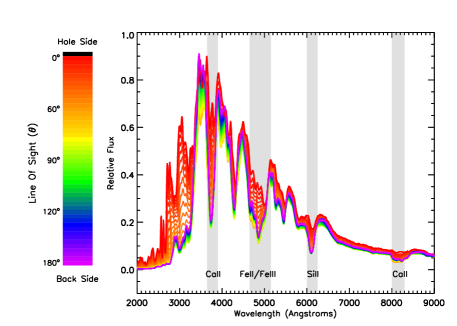
As can be seen in Figure 3, the spectrum changes continuously from peculiar to normal as the viewing angle is increased from zero. Some degree of peculiarity is seen for , but the further the viewing angle is from , the less intense the peculiarities. For a viewing angle of , for instance, the depths of the Si II and Ca II features are about half that of the normal case, and the iron blend near 5000 Å is dominated by Fe II rather than Fe III. One might rather compare the model from this viewing angle to SN 1999aa, which near maximum light was in many ways intermediate between SN 1991T and a normal SN Ia.
We have also experimented with varying the density structure of the ejecta hole. As can be expected, increasing the density in the hole or decreasing the hole opening angle tames the asymmetry and produces spectra with less intense peculiarities. If the hole opening angle is reduced below the spectral peculiarities are minor from all lines of sight. In the hydrodynamical models of Marietta et al. (2000), the hole opening angle is in the low velocity layers, and in the outer high-velocity layers, depending upon the nature of the companion star. The hole used in Figures 3 and 4 ( in all layers) thus represents the extreme end of what one might expect from their calculations.
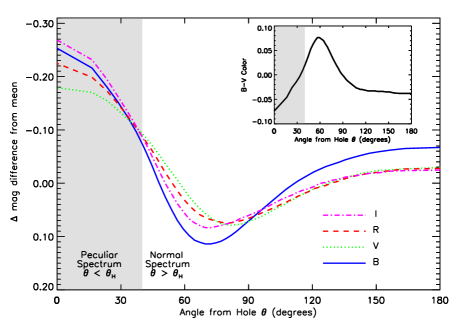
3.4. Peak Magnitudes
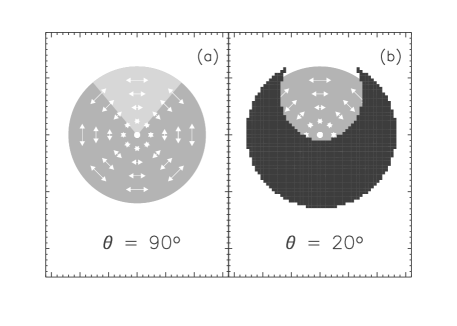
In the ejecta-hole model, the observed luminosity depends upon the viewing angle (Figure 5). When viewed down the hole, the supernova is brighter by up to 0.25 mag in . This is because photons more readily escape out the hole due to the lower opacities. On the other hand, the supernova is dimmer than average when viewed from the side () because from this angle the supernova is lacking a “wedge” of scattering material (see Figure 7a). Radiation that would normally have been scattered into the view now flows straight out the hole and goes into making the view down the hole brighter.
It is widely believed that observed SN 1991T-like supernovae are in general overluminous, although the degree and regularity of this overluminosity can be questioned (Saha et al., 2001). While Figure 5 suggests a similar relationship, keep in mind that the total luminosity is a fixed parameter in this calculation – the figure only shows how this fixed luminosity gets distributed among the various viewing angles. In general, one expects the total luminosity to depend predominately on the amount of 56Ni synthesized in the explosion, which will vary from supernova to supernova. If a certain SN Ia has a very small 56Ni mass, for example, then although the view down the hole is the brightest of all possible viewing angles, the supernova would still appear underluminous compared to a SN Ia with normal 56Ni production.
The total dispersion about the mean in the ejecta hole model is mag in and , and somewhat larger in ( mag) as a result of the -band’s greater sensitivity to line opacity. The observed dispersion in SNe Ia peak magnitudes is around 0.3 mag in the -band, and the brightness is found to correlate with the width of the light curve (Phillips, 1993). These variations are believed to be largely the result of varying amounts of 56Ni synthesized in the explosion. After correction for the width-luminosity relation and dust extinction (using the - color), the observed dispersion is reduced to mag (Hamuy et al., 1996). Some of this so-called intrinsic dispersion is likely due to an asymmetry of some sort; Figure 5 suggests that in the particular case of an ejecta-hole geometry, the asymmetry may in fact be the dominant effect. Note, however, that in the model the - color roughly correlates with peak magnitude – thus correcting for dust extinction with a - color will tend to correct for the asymmetry also. The angular variation of the luminosity is also sensitive to the details of the hole structure – decreasing the hole size to , for example, decreases the -band dispersion to 0.1 mag.
3.5. Continuum Polarization
The polarization is the most direct indication of asymmetry in the ejecta. Because a spherically symmetric atmosphere has no preferred direction, the polarization integrated over the projected supernova surface must cancel. In an axially-symmetric geometry, the net polarization can be non-zero and will align either parallel or perpendicular to the axis of symmetry. We use the convention that positive (negative) polarization designates a polarization oriented parallel (perpendicular) to the axis of symmetry. SN 2001el had a well-defined polarization angle over most of the spectral features, which indicates that the bulk of the ejecta obeyed a near axial symmetry (in addition, SN 2001el showed an unusual high velocity Ca II IR triple feature with a distinct polarization angle, corresponding to a detached “clump” of material that deviated from the dominant axis of symmetry(Kasen et al., 2003a)).
Light becomes polarized in supernova atmospheres due to electron scattering; other sources of opacity, such as bound-bound line transitions, are usually considered to be depolarizing. We define the continuum polarization as the polarization computed using only electron scattering opacity – this is most closely realized in the red end of a supernova spectrum (say near 7000 Å), where there is not much line opacity. However this may not be the maximum polarization level in the spectrum, as line opacity may partially obscure the underlying photosphere and lead to a less effective cancellation of the polarization in the line features (see § 3.6 and Kasen et al. (2003a)). Höflich (1991) computes the continuum polarization in ellipsoidal and other axially symmetric geometries.
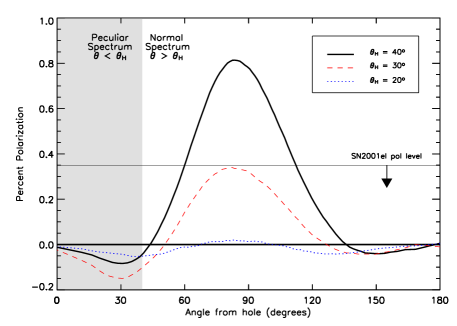
Figure 6 shows the continuum polarization of the ejecta-hole model as a function of viewing angle. When viewed directly down the hole () the projection of the supernova atmosphere is circularly symmetric and the polarization cancels. As the viewing angle is inclined, the polarization increases, reaching a maximum when the supernova is viewed nearly side-on (). The origin of the non-zero polarization is clear from Figure 7a. At inclinations near , the hole removes a “wedge” of scatterers from the top of the atmosphere, which decreases the horizontally polarized flux coming from this region. The vertically polarized flux thus exceeds the horizontal; the net polarization is non-zero and aligned with the symmetry axis of the system (positive according to our convention).
To determine the level of intrinsic continuum polarization in observed supernova, one must wrestle with the issue of subtracting the interstellar polarization (Howell et al., 2001; Leonard et al., 2000). Once this is done, the observed levels are found to be rather small: the polarization of SN 2001el was 0.3%; the polarization of the subluminous SN 1999by . For several other SNe Ia, no polarization signal was detected, but upper limits of 0.3-0.5% can be derived (Wang et al., 1996a, b). In the ejecta-hole model, the continuum polarization can be as large as 0.8%, while the polarization at the line features can be even larger (see next section). The hole asymmetry therefore produces polarization levels in the right range, though perhaps generally too high compared to the current published observations.
The polarization in the ejecta-hole model, however, is rather sensitive to the size and density of the hole. To demonstrate this we have over-plotted the continuum polarization of a model with a smaller opening angle (). This tames the asymmetry and decrease the continuum polarization by more than a factor of two. If the hole size is decreased further to , the continuum polarization level is uninterestingly small () from all inclinations. Thus the exact polarization level will depend upon the hole structure, which in turn depends upon the details of the progenitor system and hydrodynamics. In general, the more extreme the asymmetry of the hole (i.e. the larger and more evacuated it is) the higher the average polarization level. A larger sample of SNe Ia spectropolarimetry could therefore put constraints on the size of a putative hole. Current observations may already constrain the hole to have .
One correlation to keep in mind is that the continuum polarization is always relatively small () for views near the hole where the spectrum looks peculiar. For views away from the hole, the continuum polarization may be either small or large. However the continuum polarization is not the whole story and as we see in the next section, the polarization over the line features can be substantial even for .
3.6. Polarization Spectrum

The continuum polarization level actually provides very little information as to the nature of the ejecta asymmetry, as very different configurations can give the same numerical value. Line features in the polarization spectrum, on the other hand, contain more potential information about the specific geometry. We find that the ejecta-hole model has spectropolarimetric signatures that distinguish it from, for example, an ellipsoidal geometry.
The polarization spectrum in the ellipsoidal geometry has been studied in detail (Jeffrey, 1989; Höflich et al., 1996). In ellipsoidal models, the polarization level generally increases from blue to red due to the greater amount of depolarizing line opacity in the blue. Individual lines create “inverted P-Cygni” profiles in the polarization spectrum, i.e. a blueshifted polarization peak with a redshifted depolarization trough. The blueshifted peak is a result of the line opacity preferentially blocking the lowly polarized central photospheric light, while the redshifted trough is the result of unpolarized line emission light diluting the continuum polarization. The polarized line profiles look fairly similar from all viewing angles.
The line polarization profile in the ejecta-hole model shows an interesting variation with inclination (Figure 8). For views far enough away from the hole (), the profile is an inverted P-Cygni, just as in an ellipsoidal model, and for essentially the same reason. For views closer to the hole, however, the blueshifted line absorption gives rise to a large polarization peak (recall the negative sign indicates that the polarization direction is perpendicular to the symmetry axis of the system). Figure 7b helps explain the origin of the peak. From viewing angles near the hole axis, the projected electron scattering medium is fairly symmetric and the continuum polarization integrated over the ejecta surface nearly cancels. The line opacity, however, only partially obscures the underlying light. Because of the hole, horizontally polarized flux from the top of the atmosphere is relatively unobscured, whereas the vertically polarized light from the sides of the atmosphere is effectively screened by the line. The polarization over the line therefore does not cancel, but will be large and oriented perpendicular to the axis of symmetry (negative according to our convention). Note that if the hole opening angle is narrowed to , the line is even more effective in screening off all but the horizontally polarized light. The line polarization peak is therefore larger. Thus while the continuum polarization decreases with decreasing hole size, the line polarization from certain viewing angles will be relatively large () regardless of how big the hole is.
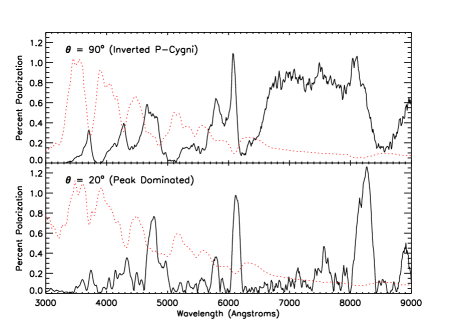
Figure 9 shows the entire ejecta-hole polarization spectrum from two lines of sight. For a view near the hole () the spectrum is “line peak-dominated” – the continuum polarization is rather low, but large polarization peaks are associated with the blueshifted line absorption features (in particular the Si II 6150 feature and the Ca II IR triplet). This spectrum is qualitatively different than what is expected in an ellipsoidal geometry. For views away from the hole (, on the other hand, the polarization spectrum would be very hard to distinguish from the ellipsoidal case. The level of polarization rises from blue to red and the line features due to Si II 6150 feature and Ca II IR triplet have the “inverted P-Cygni” profile. The shape of the polarization spectrum from these angles resembles SN 2001el, although the polarization level is too high unless , or the hole opening angle is reduced.
To discriminate between different geometries, a larger sample of polarization spectra is needed. If the asymmetry in SNe Ia is an ejecta hole, we would expect to see something like a line peak dominated polarization spectrum for , or about 25% of the time. Such a polarization spectrum has not been observed as yet, but the number of published spectropolarimetric observations is still relatively small. Uncertainty in the interstellar polarization may make it difficult to identify the peaks, for if the zeropoint of the intrinsic supernova polarization is unknown, it will be unclear whether features in the polarization spectrum are peaks or troughs. Therefore multi-epoch spectropolarimetric observations are necessary to help pin down the interstellar component. Of course, observing a line peak dominated polarization spectrum may not uniquely implicate an ejecta hole, as large line peaks could potentially occur in other geometries so far unexplored.
4. Conclusions
4.1. Asymmetry and Diversity in SNe Ia
Despite the seemingly extreme nature of an ejecta-hole asymmetry, we find that the geometry is actually consistent with what is currently known about SNe Ia, at least for the observables we have calculated. The variation of the peak magnitude with viewing angle is mag in , comparable to the intrinsic dispersion of SNe Ia, and the level of polarization in the range observed (). The spectrum of the supernova looks peculiar when viewed near the hole, but this peculiarity may fit in with the spectral diversity already known to exist in SNe Ia. In addition, the polarization spectrum from some lines of sight is a qualitative match to that of SN 2001el.
An ejecta-hole asymmetry could therefore be one source of diversity in SNe Ia, but of course not the only one. The primary source of diversity in SNe Ia is thought to be due to variations in the amount of 56Ni produced in the explosion. Because SNe Ia are powered by the radioactive decay of 56Ni and its daughter 56Co, different 56Ni production can explain the variety in SN Ia peak magnitudes. Greater 56Ni masses may lead to higher atmospheric temperatures and higher effective opacities, which may explain why brighter SNe Ia have broader light curves (Hoflich et al., 1995; Pinto & Eastman, 2000a; Nugent et al., 1997).
It has often been thought that the spectroscopic diversity of SNe Ia fits into the same one-parameter 56Ni sequence (Nugent et al., 1995). In this picture, SN 1991T-like supernovae occupy the overluminous end of the sequence, where the larger 56Ni mass leads to higher envelope temperatures and a higher ionization fraction. This may explain the peculiar spectral appearance (Mazzali et al., 1995; Jeffery et al., 1992). As the models in this paper show, there could be a second, physically very different route to the same sort of spectral peculiarities – one could be peering down an ejecta hole. In the ejecta-hole model, the spectrum shows some level of peculiarity for or about 12% of the time, although the peculiarities will only be very intense for views more directly down the hole ( or of the time). The observed rate of SN 1991T-like supernovae is % in the samples of both Branch (2001) and Li et al. (2001b); the rate of SN 1991T/SN 1999aa-like supernovae is in the Li et al. (2001b) sample. Therefore it is possible that a substantial percentage of these peculiar supernovae could be the result of an ejecta-hole asymmetry.
In this paper we have chosen to compare the spectra emanating from the hole with SN 1991T only because it is the well-known prototype of a certain kind of spectral peculiarity. Whether SN 1991T itself was an example of merely looking down an ejecta hole is debatable. Initial estimates suggested that SN 1991T was as much as 0.7-0.8 magnitudes brighter in than normal, which is too much to be explained by the asymmetry alone (Fisher et al., 1999). More recent Cepheid measurements of the distance to the host galaxy, however, show that SN 1991T was not really much brighter than a normal SN Ia. (Saha et al., 2001) find a moderate overluminosity of 0.3 mag, although a value as high 0.6 mag cannot be ruled out due to large uncertainty in the dust extinction. This lower value for the brightness of SN 1991T calls into question whether the peculiar spectral appearance can still be explained alone by high envelope temperatures due to a larger 56Ni mass.
SN 1991T also had a rather broad light curve (M15= 0.95 0.05; Phillips et al. (1999)), which is often taken as an indication of a large 56Ni mass. Because we have not yet computed time-dependent models, we do not know exactly what effect an ejecta hole asymmetry will have on the light curve. Because the hole acts as an energy leak, it probably lowers the net diffusion time, and we expect that the integrated light curve (i.e that summed over all viewing angles) will be narrower in a ejecta-hole model than a spherical model. But the real question relevant to SN 1991T is not how the integrated light curve compares to a spherical model, but whether the light curve viewed down the hole is broader or narrower than that from other viewing angles. In other words we need to know how Figure 5 – the distribution of the total luminosity among viewing angles – varies with time. This is more difficult to intuit, because as the ejecta thins out and the asymmetry and opacities evolve with time, it is hard to say off-hand whether it will become more or less easy for photons to preferentially escape out the hole. We leave the question for future work.
In any case, although the prototype SN 1991T did have a broad light curve, it is not clear whether a general correlation between light curve width and SN 1991T-like spectral peculiarities even exists (Howell, 2003). Several SNe Ia have similar or broader light curves, and yet the spectrum is apparently normal – at least eight such supernovae with M15 are listed in Phillips et al. (1999), for example SN 1992bc (M15= 0.87 0.05) and SN 1994ae (M15= 0.86 0.05). SN 2001ay also had a normal spectrum but an exceptionally broad light curve (M15= 0.6-0.7; Phillips et al. (2003)). Among the supernovae with SN 1991T-like spectral peculiarities, there also appears to be diversity. SN 1997br had a moderately broad light curve (M15; Li et al. (1999)), but the light curve of SN 2002cx was on the narrow side (M15; Li et al. (2003)). In another SN 1991T-like supernova the -band light curve was lopsided – SN 2000cx brightened much faster than SN 1991T (resembling the rise of the normal SN 1994D) but the decline was slow (M15= 0.93 0.04; Li et al. (2001a)). The examples make it clear that the connection between light-curve width and SN 1991T-like spectral peculiarities remains vague, and that more than one parameter of diversity needs to be identified.
The nebular spectra of SN 1991T may also suggest a large 56Ni production. In the late time spectra, the iron emission lines of SN 1991T have larger velocity widths than in most SNe Ia (Mazzali et al., 1998). Assuming the late time ionization/excitation conditions are similar in all SNe Ia, this implies that the nickel/iron core in SN 1991T is larger than normal. Confusing this conclusion, however, is the fact pointed out by Hatano et al. (2002) that the Si II velocities in the post maximum spectra are among the lowest of all SNe Ia. If SN 1991T really did have a large inner 56Ni zone, one naively expects the zone of silicon and other intermediate mass elements to occur at especially high velocities (as for instance in the delayed detonation models of e.g. Höflich et al. (2002)). To account for the low Si II velocities, some have invoked a late-detonation model for SN 1991T, which produces a layer of intermediate mass elements sandwiched between two nickel zones (Yamaoka et al., 1992; Ruiz-Lapuente et al., 1992). Of course a lower Si II velocity is also naturally expected if one is looking down an ejecta hole.
It is possible that SN 1991T did have a relatively large 56Ni mass, rather than (or perhaps in addition to) being viewed down the ejecta hole. However among other supernovae with SN 1991T-like peculiarities there is a good deal of diversity, and the large 56Ni mass explanation will not apply in all cases. The most obvious case in point is SN 2002cx (Li et al., 2003). The spectrum of SN 2002cx resembled SN 1991T in that Si II, S II, and Ca II lines were weak, while Fe III was prominent, but the supernova was underluminous by mag. The velocities of the absorption features were also unusually low ( km s-1) (Branch, 2003). The singularity of the supernova led Li et al. (2003) to consider alternative progenitor systems, although they conclude that no existing theoretical model could explain all the peculiarities. On the other hand, there is also the possibility that we are seeing multiple channels of diversity operating at once – one scenario to entertain now is that we are looking down the ejecta hole of a “weak” supernova that produced a small mass of 56Ni. Such underluminous objects (e.g. SN 1991bg) typically have relatively low absorption velocities (Turatto et al., 1996; Mazzali et al., 1997; Hatano et al., 2002) which would be further reduced by looking down the hole. Despite the low luminosity, the spectrum might still appear hot and iron dominated if one is peering into the deeper layers, and (eventually) into the iron core. Of course, the chance of seeing two distinct sources of diversity operating at once would be, like SN 2002cx, a very rare occurrence.
Whatever the final explanation for SN 2002cx, its singularity highlights the fact that the diversity of SNe Ia is more complicated than a one-parameter sequence based upon 56Ni. One can imagine many sources of variation contributing, including: different amounts and distributions of high-velocity material, different sizes and inclinations of an ejecta hole (or other) asymmetry, various explosion processes (e.g. pure deflagration, deflagration-to-detonation, late-detonation), metallicity variations and even the possibility of completely different progenitor channels (e.g. a double-degenerate scenario). With so much going on at once, interpreting the observations becomes a daunting task, but in some sense the identification of multiple channels of diversity is welcome, considering that observations continue to turn up unusual SNe Ia.
4.2. Observational Consequence of an Ejecta Hole
The results of this paper suggest a few observational signatures of the ejecta-hole geometry. First, the continuum polarization should be low for views directly down the hole, where the spectrum looks peculiar. However because of the partial obscuration effect, the polarization spectrum should show large line peaks for views just away the hole (), where the spectrum looks marginally peculiar or normal. For views from the side (), a relatively high continuum polarization should be correlated with a slightly dimmer supernova with normal spectral features and inverted P-Cygni line polarization features. Another possible signature of the ejecta hole is “lopsided” P-Cygni flux profiles – the view down the hole weakens only the absorption, not the emission feature, so one could look for a weak (or absent) absorption associated with noticeable emission. The easiest place to look would be in the Si II 6150 and the Ca II IR triplet features of SN 1991T-like supernova. Unfortunately the relative strength of absorption to emission depends also on the line source function, which is determined by the detailed excitation conditions in the atmosphere. In general, because we recognize that an ejecta-hole asymmetry is only one of several possible sources of diversity in SNe Ia, it will be difficult to isolate the geometrical effects from the other variations that may be operating. The only hope is to collect a large sample of supernovae with well observed light curves, spectra and polarization, so that one might try to pull out the different trends.
In our calculations we have used a parameterized hole (half opening angle ) in order to explore the essential observable consequences of the geometry. The next step is to address the same questions using specific hydrodynamical models representing a wide variety of progenitor configurations. The details of the progenitor system could potentially affect the size and shape of the hole. Marietta et al. (2000) compute interactions using main sequence, subgiant and red giant companions and note that the variation in the hole asymmetry is not large. This is because in all cases the companion star is near enough to have undergone Roche lobe overflow and always occupies a similar solid angle (the red giant is farther away but physically larger than a main sequence companion which is smaller but much closer). However if the ratio of companion radius to separation distance is decreased for some reason, the size of the hole also decreases. A larger sample of spectropolarimetric observations will help determine if SNe Ia really do have an ejecta-hole geometry, and could constrain the hole opening angle if one exists. While a hole smaller than has only minor effects on the spectrum, luminosity and continuum polarization, it will still create substantial line peaks in the polarization spectrum when seen from some viewing angles. If such signatures of the hole are not seen in future spectropolarimetric observations, this would have interesting consequences for the progenitors of SNe Ia, or the hydrodynamics of the ejecta/companion interaction.
Finally, we mention that an asymmetry like an ejecta hole could have a number of subtle consequences on the use of SNe Ia as standard candles for cosmology. The asymmetry causes a dispersion in observed SNe Ia peak magnitude. If the asymmetry is identical in all supernova, this dispersion behaves like a statistical error (although a non-gaussian one) and can be averaged out by observing enough objects. The averaging out is not achieved, however, if one does not sufficiently sample every possible viewing angle, either because not enough supernovae are observed, or because those viewed down the hole are withheld from the sample due to concern over their spectral peculiarities. In addition, if the nature, degree, or frequency of the asymmetry evolves with redshift (say because of evolving progenitor populations) the peak magnitude of SNe Ia becomes a function of redshift. One might also be concerned that the significant angular variation of the colors and spectrum may complicate extinction and K-corrections. The errors incurred from all these and other related systematic effects would be relatively small, but may need to be considered in the next generation of precision supernova cosmology experiments.
References
- Arnett (1982) Arnett, W. D. 1982, ApJ, 253, 785
- Branch (1987) Branch, D. 1987, ApJ, 316, L81
- Branch (2001) —. 2001, PASP, 113, 169
- Branch (2003) —. 2003, To appear in 3-D Signatures of Stellar Explosions: astro-ph/0310685
- Branch et al. (1985) Branch, D., Doggett, J. B., Nomoto, K., & Thielemann, F.-K. 1985, ApJ, 294, 619
- Branch et al. (1993) Branch, D., Fisher, A., & Nugent, P. 1993, AJ, 106, 2383
- Branch et al. (1995) Branch, D., Livio, M., Yungelson, L. R., Boffi, F. R., & Baron, E. 1995, PASP, 107, 1019
- Branch et al. (2003) Branch, D. et al. 2003, ApJ, in preparation
- Code & Whitney (1995) Code, A. D. & Whitney, B. A. 1995, ApJ, 441, 400
- Filippenko et al. (1992a) Filippenko, A. V., Richmond, M. W., Branch, D., Gaskell, M., Herbst, W., Ford, C. H., Treffers, R. R., Matheson, T., Ho, L. C., Dey, A., Sargent, W. L. W., Small, T. A., & van Breugel, W. J. M. 1992a, AJ, 104, 1543
- Filippenko et al. (1992b) Filippenko, A. V., Richmond, M. W., Matheson, T., Shields, J. C., Burbidge, E. M., Cohen, R. D., Dickinson, M., Malkan, M. A., Nelson, B., Pietz, J., Schlegel, D., Schmeer, P., Spinrad, H., Steidel, C. C., Tran, H. D., & Wren, W. 1992b, ApJ, 384, L15
- Fisher et al. (1999) Fisher, A., Branch, D., Hatano, K., & Baron, E. 1999, MNRAS, 304, 67
- Fryxell & Arnett (1981) Fryxell, B. A. & Arnett, W. D. 1981, ApJ, 243, 994
- Höflich et al. (2002) Höflich, P., Gerardy, C. L., Fesen, R. A., & Sakai, S. 2002, ApJ, 568, 791
- Hamuy et al. (1996) Hamuy, M., Phillips, M. M., Suntzeff, N. B., Schommer, R. A., Maza, J., & Aviles, R. 1996, AJ, 112, 2391
- Hatano et al. (1999) Hatano, K., Branch, D., Fisher, A., Baron, E., & Filippenko, A. V. 1999, ApJ, 525, 881
- Hatano et al. (2002) Hatano, K., Branch, D., Qiu, Y. L., Baron, E., Thielemann, F.-K., & Fisher, A. 2002, New Astronomy, 7, 441
- Höflich (1991) Höflich, P. 1991, A&A, 246, 481+
- Hoflich et al. (1995) Hoflich, P., Khokhlov, A. M., & Wheeler, J. C. 1995, ApJ, 444, 831
- Höflich et al. (1996) Höflich, P., Wheeler, J. C., Hines, D. C., & Trammell, S. R. 1996, ApJ, 459, 307+
- Howell (2003) Howell, D. 2003, To appear in 3-D Signatures of Stellar Explosions
- Howell et al. (2001) Howell, D. A., Höflich, P., Wang, L., & Wheeler, J. C. 2001, ApJ, 556, 302
- Jeffery et al. (1992) Jeffery, D. J., Leibundgut, B., Kirshner, R. P., Benetti, S., Branch, D., & Sonneborn, G. 1992, ApJ, 397, 304
- Jeffrey (1989) Jeffrey, D. J. 1989, ApJS, 71, 951
- Jeffrey (1991) —. 1991, ApJ, 375, 264
- Kasen et al. (2003a) Kasen, D., Nugent, P., Wang, L., Howell, D. A., Wheeler, J. C., Höflich, P., Baade, D., Baron, E., & Hauschildt, P. H. 2003a, ApJ, 593, 788
- Kasen et al. (2003b) Kasen, D. et al. 2003b, in preparation
- Lentz et al. (2001) Lentz, E. J., Baron, E., Branch, D., & Hauschildt, P. H. 2001, ApJ, 557, 266
- Leonard et al. (2000) Leonard, D. C., Filippenko, A. V., Barth, A. J., & Matheson, T. 2000, ApJ, 536, 239
- Li et al. (2003) Li, W., Filippenko, A. V., Chornock, R., Berger, E., Berlind, P., Calkins, M. L., Challis, P., Fassnacht, C., Jha, S., Kirshner, R. P., Matheson, T., Sargent, W. L. W., Simcoe, R. A., Smith, G. H., & Squires, G. 2003, PASP, 115, 453
- Li et al. (2001a) Li, W., Filippenko, A. V., Gates, E., Chornock, R., Gal-Yam, A., Ofek, E. O., Leonard, D. C., Modjaz, M., Rich, R. M., Riess, A. G., & Treffers, R. R. 2001a, PASP, 113, 1178
- Li et al. (2001b) Li, W., Filippenko, A. V., Treffers, R. R., Riess, A. G., Hu, J., & Qiu, Y. 2001b, ApJ, 546, 734
- Li et al. (1999) Li, W. D., Qiu, Y. L., Qiao, Q. Y., Zhu, X. H., Hu, J. Y., Richmond, M. W., Filippenko, A. V., Treffers, R. R., Peng, C. Y., & Leonard, D. C. 1999, AJ, 117, 2709
- Livne et al. (1992) Livne, E., Tuchman, Y., & Wheeler, J. C. 1992, ApJ, 399, 665
- Lucy (1999) Lucy, L. B. 1999, A&A, 344, 282
- Marietta et al. (2000) Marietta, E., Burrows, A., & Fryxell, B. 2000, ApJS, 128, 615
- Mazzali et al. (1998) Mazzali, P. A., Cappellaro, E., Danziger, I. J., Turatto, M., & Benetti, S. 1998, ApJ, 499, L49+
- Mazzali et al. (1997) Mazzali, P. A., Chugai, N., Turatto, M., Lucy, L. B., Danziger, I. J., Cappellaro, E., della Valle, M., & Benetti, S. 1997, MNRAS, 284, 151
- Mazzali et al. (1995) Mazzali, P. A., Danziger, I. J., & Turatto, M. 1995, A&A, 297, 509
- Mazzali & Lucy (1993) Mazzali, P. A. & Lucy, L. B. 1993, A&A, 279, 447
- Nomoto et al. (1984) Nomoto, K., Thielemann, F., & Yokoi, K. 1984, ApJ, 286, 644
- Nugent et al. (1997) Nugent, P., Baron, E., Branch, D., Fisher, A., & Hauschildt, P. H. 1997, ApJ, 485, 812
- Nugent et al. (1995) Nugent, P., Phillips, M., Baron, E., Branch, D., & Hauschildt, P. 1995, ApJ, 455, L147+
- Phillips (1993) Phillips, M. M. 1993, ApJ, 413, L105
- Phillips et al. (2003) Phillips, M. M., Krisciunas, K., Suntzeff, N. B., Roth, M., Germany, L., Candia, P., Gonzalez, S., Hamuy, M., Freedman, W. L., Persson, S. E., Nugent, P. E., Aldering, G., & Conley, A. 2003, in From Twilight to Highlight: The Physics of Supernovae. Proceedings of the ESO/MPA/MPE Workshop held in Garching, Germany, 29-31 July 2002, p. 193., 193–+
- Phillips et al. (1999) Phillips, M. M., Lira, P., Suntzeff, N. B., Schommer, R. A., Hamuy, M., & Maza, J. 1999, AJ, 118, 1766
- Phillips et al. (1992) Phillips, M. M., Wells, L. A., Suntzeff, N. B., Hamuy, M., Leibundgut, B., Kirshner, R. P., & Foltz, C. B. 1992, AJ, 103, 1632
- Pinto & Eastman (2000a) Pinto, P. A. & Eastman, R. G. 2000a, ApJ, 530, 744
- Pinto & Eastman (2000b) —. 2000b, ApJ, 530, 757
- Ruiz-Lapuente et al. (1992) Ruiz-Lapuente, P., Cappellaro, E., Turatto, M., Gouiffes, C., Danziger, I. J., della Valle, M., & Lucy, L. B. 1992, ApJ, 387, L33
- Saha et al. (2001) Saha, A., Sandage, A., Thim, F., Labhardt, L., Tammann, G. A., Christensen, J., Panagia, N., & Macchetto, F. D. 2001, ApJ, 551, 973
- Thomas et al. (2002) Thomas, R. C., Kasen, D., Branch, D., & Baron, E. 2002, ApJ, 567, 1037
- Thomas et al. (2003) Thomas, R. C. et al. 2003, ApJ, submitted; astro-ph/0302260
- Turatto et al. (1996) Turatto, M., Benetti, S., Cappellaro, E., Danziger, I. J., della Valle, M., Gouiffes, C., Mazzali, P. A., & Patat, F. 1996, MNRAS, 283, 1
- Wang et al. (1997) Wang, L., Wheeler, J. C., & Hoeflich, P. 1997, ApJ, 476, L27
- Wang et al. (1996a) Wang, L., Wheeler, J. C., Li, Z., & Clocchiatti, A. 1996a, ApJ, 467, 435+
- Wang et al. (1996b) —. 1996b, ApJ, 467, 435
- Wang et al. (2003) Wang, L. et al. 2003, ApJ, in press
- Wheeler et al. (1975) Wheeler, J. C., Lecar, M., & McKee, C. F. 1975, ApJ, 200, 145
- Yamaoka et al. (1992) Yamaoka, H., Nomoto, K., Shigeyama, T., & Thielemann, F. 1992, ApJ, 393, L55