NIR Observations of the QSO 3C 48 Host Galaxy ††thanks: Based on observations with the VLT; proposal number 67.B-0019
In this paper we present new near infrared (NIR) imaging and spectroscopic data of the quasar 3C 48 and its host galaxy. The data were obtained with the ESO-VLT camera ISAAC. We report the first detection of the apparent second nucleus 3C 48A about 1″NE of the bright QSO nucleus in the NIR bands , , and . 3C 48A is highly reddened with respect to the host, which could be due to warm dust, heated by enhanced star formation or by interstellar material intercepting the radio jet. In fact, all colors on the host galaxy are reddened by several magnitudes of visual extinction. Imaging and initial spectroscopy also reveal a stellar content of about 30% to the overall QSO-light in the NIR. These results are important input parameters for future models of the stellar populations by taking extinction into account.
Key Words.:
Galaxies: fundamental parameters – Infrared: galaxies – Quasars: individual: 3C 481 Introduction
Revealing the physical properties of quasi stellar objects (QSOs) and their host galaxies is one key to understand how the overall galaxy structure affects the extreme activity in active galactic nuclei (AGN) and how in turn the QSO and its black hole influence the surrounding galaxy structure.
The host galaxy of the radio-loud quasar 3C 48 is an unusually large and bright object with excess far-infrared emission, (Neugebauer et al. 1985), showing a one-sided radio jet extending about 0.5″to the north, fanning out to the east to about 1′′ (Wilkinson et al. 1991). At its redshift of (Boroson & Oke 1984) 3C 48 is one rare member of the class of compact steep spectrum (CSS) radio sources with a radio-spectral index (Tyul’bashev & Chernikov 2001). The quasar is rich in molecular gas, , as CO(1-0) observations show (Scoville et al. 1993; Wink et al. 1997).
There is also morphological evidence for a recent merger event, like a possible double nucleus and a tidal tail extending several arcseconds to the northwest (Stockton & Ridgway 1991; Chatzichristou et al. 1999; Canalizo & Stockton 2000, and references therein). But it is still unclear, whether the brightness peak northeast (NE) of the QSO is really the nucleus of the companion galaxy, as it could also be a region of interaction of the radio jet with the interstellar medium of the host galaxy, inducing star formation (Canalizo & Stockton 2000) or even both. Canalizo & Stockton (2000) found unusually high stellar velocity dispersions as well as very young stellar populations, possibly due to the interaction of the jet with the ambient medium (see also Chatzichristou et al. 1999). The merger morphology, its high FIR luminosity, and its large content of molecular gas put 3C 48 in an evolutionary scheme envisioned by Sanders et al. (1988). It fits nicely as an transition object between ultra-luminous infrared galaxies (ULIRGs) and pure QSOs, being still dominated by its FIR excess but also displaying QSO features like its luminosity and rather flat spectral energy distribution.
The 3C 48 nucleus is an ideal target for high-resolution near infrared studies of AGN and their hosts, in order to study the influence of the nuclear activity as well as the ongoing merger on the host environment. 3C 48 also offers access to a unique set of diagnostic lines (Pa, Pa, Si I, CO(6-3) and see Table 8) to study stellar populations, effects of extinction, varying metallicity and initial mass function.
A major advantage of the NIR is that contamination due to scattered light is much smaller than in the visible. Previous work did not take extinction due to molecular material into account, which must play a role in the dusty and gas rich host galaxy. Therefore it is likely that the patchy velocity and age distribution found by Canalizo & Stockton (2000) may be in part due to variations in extinction.
Section 2 of this article describes details of our new NIR observations, the data reduction procedures, and calibration in both imaging and spectroscopy. In Section 3 we present and discuss the results of photometry of the nuclear region, the 3C 48A potential second nucleus and the tidal tail, and we present the initial spectroscopic results. Section 4 gives a final discussion and summary.
2 Observations and Data Reduction
The data were acquired with the Infrared Spectrometer and Array Camera (ISAAC, Moorwood 1995) mounted at the Nasmyth B focus of Unit Telescope 1 (UT1, Antu) of the Very Large Telescope (VLT; ESO, Chile).
| Date | Band | [s] |
|---|---|---|
| 30.07.01 | 720 s | |
| 03.08.01 | 1680 s | |
| 03.08.01 | 720 s | |
| 24.09.01 | 1200 s | |
| 24.09.01 | 1440 s | |
| 24.09.01 | 360 s |
| Date | Band | [s] |
|---|---|---|
| 18.08.01 | 960 s | |
| 20.09.01 | 2400 s | |
| 20.09.01 | 2400 s |
2.1 Imaging
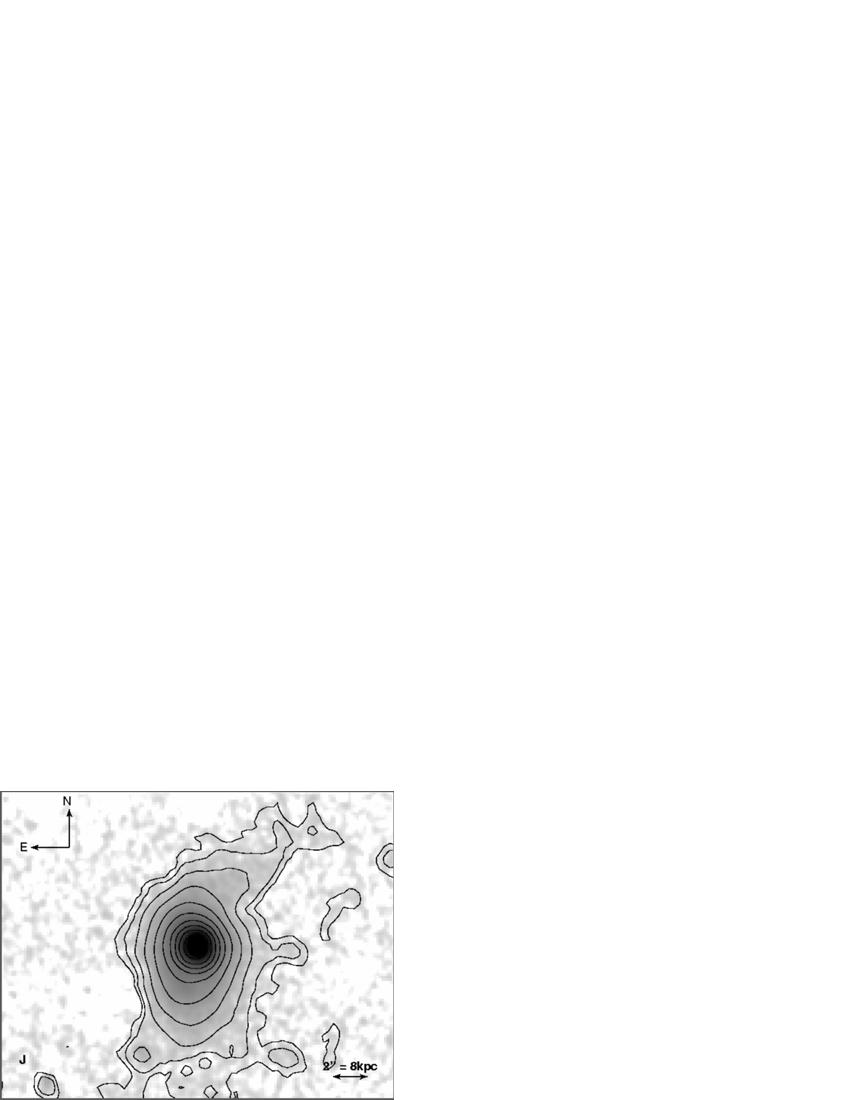
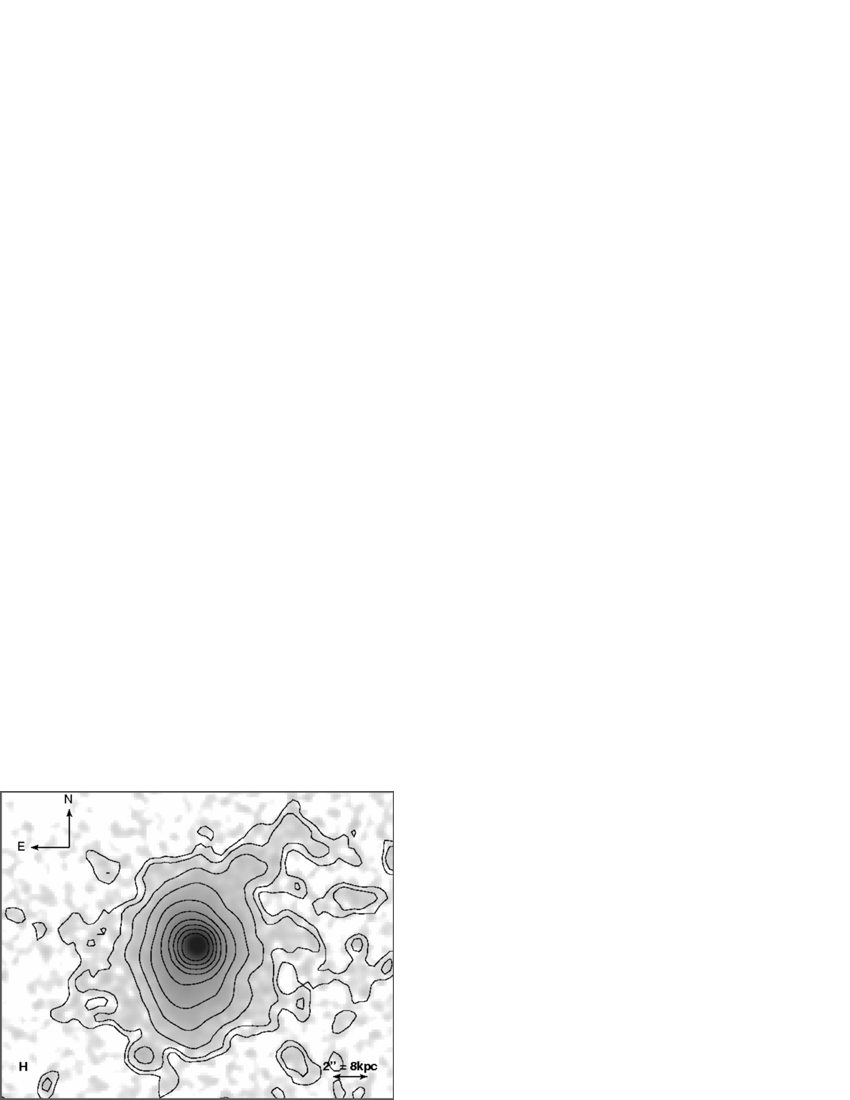
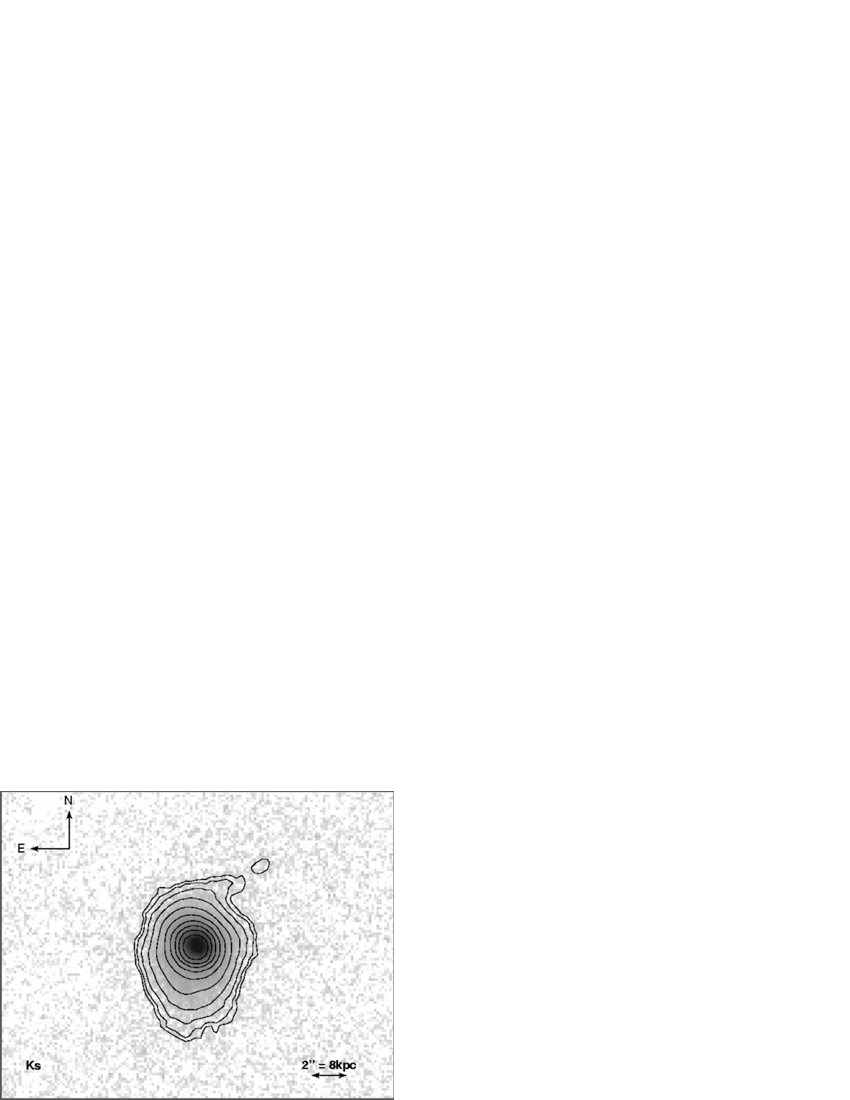
The data cover the short wavelength range from 1.2 - 2.2 m. Imaging was performed in the broad bands , and . The 1024x1024 pixel Hawaii Rockwell array detector provides a pixel scale of 0.1484″/pixel with a field of view of 152x152 arcsec2. Tables 1 and 2 list the observational parameters. The data were reduced with IRAF using standard procedures. Considering our data, we concluded by visual inspection, that the flat fields in all bands seem to be adequately flat with a variation smaller than 3% over the area of interest. The science object was also moved across the array, so that these variations are reduced due to the averaging of the individual exposures. Therefore no flat field correction was applied. Successive object and sky observations were used to produce sky subtracted images. Shifting all sky subtracted images with respect to one reference image and a median averaging results in the images displayed in Figure 1. All these resulting images were smoothed to a common seeing limited resolution of 0.5″. Calibration of our data relies on the observation of the three standard stars FS10 (Hawarden et al. 2001), S677D and S279-F (Persson et al. 1998). Airmass-corrected zero-points, ZPc, for the three bands, are presented together with the used apertures in Table 4. The extinction coefficients are mean values supplied by the ESO-Paranal web page. An average ZP in each band was computed and is used for the 3C 48 photometry. The ZP errors were calculated to be of the order of mag in , mag in and mag in .
2.2 Spectroscopy
In order to study the nucleus and host of 3C 48 we used slit spectroscopy to get spectra of a number of regions along the slit in bands and . The slit was positioned such, that it provided a north-south cut through the galaxy including part of the disk, the active nucleus, and the boundary region of the potential second nucleus. As with imaging the sky was subtracted. Again, the flat fields are flat to within better than 3%, so that no correction was applied. The individual 2-dimensional spectra were geometrically corrected. After combining the shifted, double sky subtracted 2-dimensional spectra, 1-dimensional spectra were extracted using standard IRAF procedures. The integration time in both filters and was too short (because of the proposal being B-rated, only about 1 hour and 0.6 hours respectively have been acquired) to reveal many spectral features. These give upper limits for the - and -lines in emission or absorption (see Section 3.2). We thus extracted only one spectrum per band from the nuclear region of the quasar. The FWHM of the 3C 48 trace is pixels in and pixels in . This has to be compared with the FWHM of the calibration star traces which are about 11 pixels. While extracting the spectrum a sky is subtracted by sampling a region above and beneath the trace. Using the IRAF task telluric we also removed most of the atmospheric lines.
The continua of the resulting spectra of 3C 48 are quite flat. We used the flux111The flux is calculated from magnitudes via where , in units of W cmm-1, is the science object’s flux, using for a 0mag-star as given in Table 3. of the nuclear region from our NIR imaging data to flux-calibrate the spectra. Using the facts of the flatness of the spectra and the absence of strong line features, one can distribute the imaging data flux, in W cmm-1, over the filter-bandwidth222We assumed that the imaging and spectral filters are identical to first order, because the ISAAC spectroscopic filters are somewhat broader than the photometric ones.:
| (1) |
where in units of W cmm-1 is the new y-axis .
| Band | [W cmm-1] | [W cmm-1] | |
|---|---|---|---|
| 1.63 | |||
| 2.19 |
In the spectra there are very few features detectable from the overall noise in both spectra. The major reason for this seems to be the very short integration time. The spectrum has a RMS noise of about W cmm-1 and the spectrum one of about W cmm-1.
3 Results and Discussion
3.1 3C 48 Surface Photometry
To place the QSO and the host galaxy into a two-color diagram, photometry was carried out at several positions on the galaxy in the three bands , , and .
Overall Colors:
Overall magnitudes of 3C 48 were determined using an aperture of a diameter of 10″(= 68 pixels) centered on the centroid of the brightness distribution. In this case one arcsecond corresponds to a linear scale of 4 kpc. These magnitudes are dominated by the unresolved active nucleus. Additionally two smaller apertures with diameters of 5″(= 34 pixels) and 1″(= 7 pixels) respectively have been applied, centered on the same position. A comparison allowed to estimate the stellar contribution to the AGN luminosity (see below).
The IRAF task qphot (centering and integrating the flux) has been used to determine the flux in ADUs in these apertures in the individual bands. Table 4 displays the resulting magnitudes using the above determined zero-points. The error is dominated by sky-noise, determined from the standard deviation within 5x5 pixel boxes at several positions on the sky. This yields a precision in magnitudes of about in the individual bands.
From these magnitudes the and colors for the three apertures have been calculated (Table 5).
Colors of the Host Galaxy:
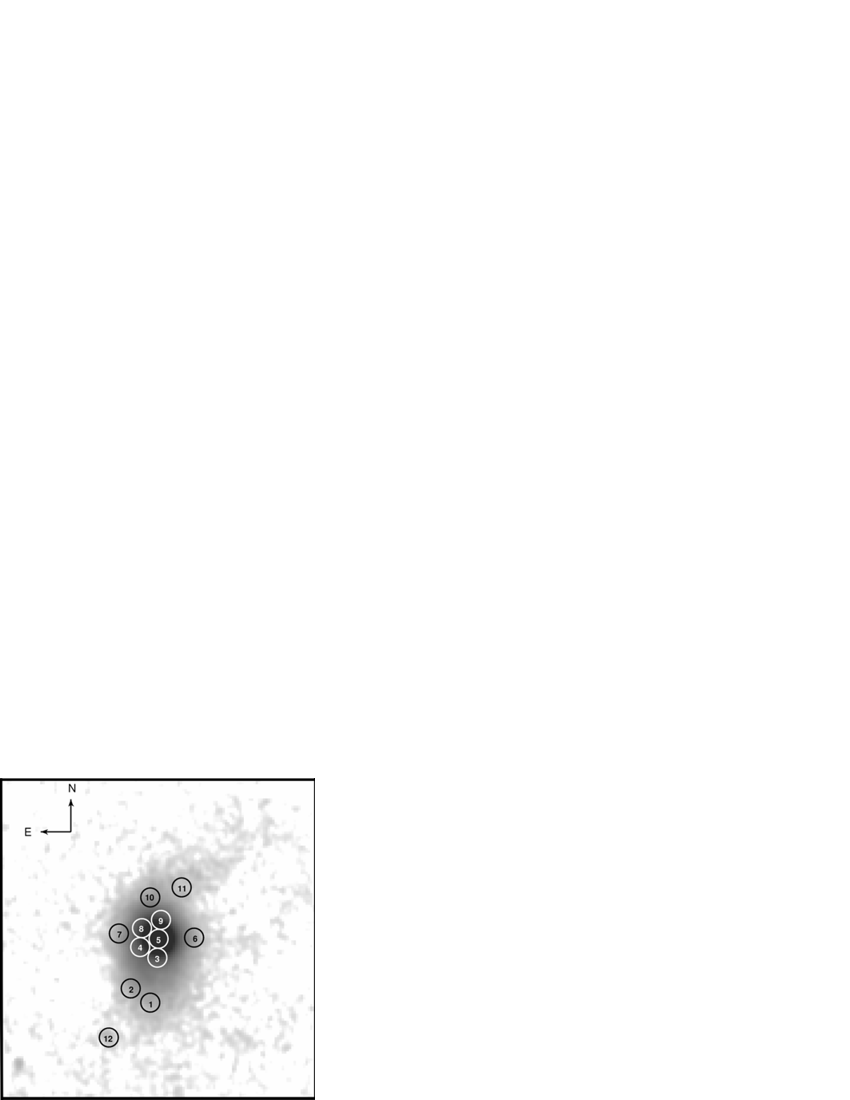
In order to obtain information on the nature of the host galaxy, it is necessary to carry out photometry at several positions on the host. Using for example models for color evolution (Bruzual A. & Charlot 1993; Hutchings & Neff 1997), one can estimate the age of the stellar content residing in the disk of the host galaxy. With surface photometry one can additionally investigate the importance of reddening due to (warm) dust. We therefore measured the flux at several positions across the galaxy, which are indicated in Figure 2. Altogether we choose 12 apertures of 1.2″(8 pixels) diameter at representative positions. Three apertures are lying in the south and two in the tidal tail region to the northwest. Five apertures lie around the active nucleus and cover the location of the potential second nucleus to the northeast. Aperture number 12 lies at the position within an apparent counter tidal (Canalizo & Stockton 2000) reaching out to about 7″to the southeast (see Fig. 2). In our NIR images we do not see a tidal tail feature reaching out to about 85 as proposed in Boyce et al. (1999).
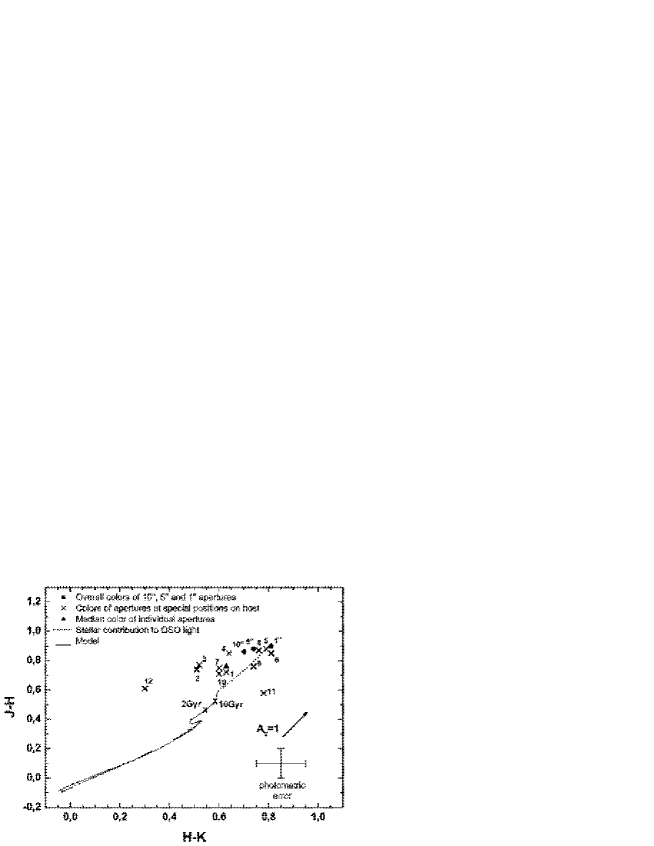
two Color Diagram of 3C 48:
The two-color diagram in Fig. 3 shows (1) the overall colors, (2) the colors derived from the 12 distinct positions on interesting locations in the 3C 48 host (as discussed above) and (3) a model for color-evolution at a redshift of (of about the distance to 3C 48) (Hutchings & Neff 1997) and (4) the stellar contribution to the light measured within an aperture centered on the nucleus (see also Fig. 4).
(1) Overall colors. Considering only the overall colors (green dots), there is a trend of redder colors in as well as in for smaller apertures (10″down to 1″). This is in agreement with the idea, that in a large aperture there is a contribution of both the host galaxy (filled circles) and the active nucleus. In a smaller aperture, in contrast there only remains the nuclear contribution which is usually redder due to gas and dust the active core is embedded in. The dotted line in the two color diagram (Fig. 3) presents the influence of mixing the nuclear color, determined in the 1″aperture, with a stellar contribution, taking typical stellar colors at the 10 Gyr point333We have chosen this age, because the dominant, underlying stellar population is of about 10 Gyr (Canalizo & Stockton 2000) and is also typical for ’inactive’ stellar dominated galaxies. of the evolutionary curve and holding the flux in the Ks-band constant, so that the total flux is conserved for the start and end points. Starting with no stellar contribution at the point of the 1″(4 kpc) aperture and arriving at 100% stellar contribution at the 10 Gyr color point, the data points of the two larger apertures lie on this curve within the errors and correspond to a stellar contribution of about 15% for the 5″(20 kpc) aperture and about 30% for the 10″(40 kpc) aperture (see Fig. 4). The stellar contribution originates in the disk of the host galaxy. The 10″aperture covers essentially the whole galaxy. Therefore the stellar contribution of the underlying host galaxy to the light from the active nucleus is of the order of 30% at 2.2 m. A consistent check for the stellar content can be the CO(6-3) absorption, a tracer for the stellar content (Origlia et al. 1993). One has to note that for the 1″aperture for the nuclear region a stellar contribution still has to be taken into account.
| Band | DIT [s] | Airmass | k | ZPc [mag] | Diam. [″] | Mag |
|---|---|---|---|---|---|---|
| 20 | 1.90 | 0.11 | 25.13 | 10 | 14.4 | |
| 5 | 14.4 | |||||
| 1 | 15.1 | |||||
| 15 | 2.01 | 0.06 | 24.77 | 10 | 13.5 | |
| 5 | 13.6 | |||||
| 1 | 14.3 | |||||
| 10 | 2.01 | 0.07 | 24.26 | 10 | 12.8 | |
| 5 | 12.8 | |||||
| 1 | 13.4 |
| Diameter [″] | ||
|---|---|---|
| 10 | 0.7 | 0.9 |
| 5 | 0.8 | 0.9 |
| 1 | 0.8 | 0.9 |
(2) Colors from single apertures. Colors derived from measurements of aperture 12 are unusually blue compared to the colors derived from other apertures on the host galaxy. Its colors are more typical for normal galaxies at redshifts close to zero (Frogel et al. 1978). This suggests that this feature ( to the southeast of the quasar nucleus), while being aligned with the apparent counter-tidal tail to the southeast, in fact is a foreground galaxy. This contravenes with the redshift derived in Canalizo & Stockton (2000) (). As both results assume that this feature is not associated with 3C 48, further investigation is necessary. Furthermore recent multi-particle simulations (Scharwächter et al. 2003) indicate, that starting from an Antennae-like setup (e.g. Toomre & Toomre 1972) one can arrive at a 3C 48 look-alike due to different projection parameters. In the case of Scharwächter et al. (2003), the counter-tidal tail is extending from the SW towards a NE direction in front of the galaxy host. Based on their HST images Canalizo & Stockton (2000) already speculated on the presence of a tidal tail in a SE-SW direction. This extension of the host towards the SW is also visible in our J- and H-band maps (Fig. 1). But it could also belong to the tidal tail resulting from the multi particle simulations.
(2) and (3) Color-evolution model. The two crosses on the evolutionary curve in Fig. 3 show the loci of stellar populations at an age of 2 and 10 Gyr, respectively. Noticing that the color of the upper right end of the model curve corresponds to an age of 20 Gyr for the stellar population, a striking result is that all derived colors are considerably reddened in comparison to the model shown. Indicated in the figure is also the effect of reddening for a visual extinction of (as discussed in Glass 1999). This indicates, that extinction might play an important role in deriving the physical properties of the host galaxy. As already mentioned, Canalizo & Stockton (2000) did not take extinction into account in their calculations. They state that the underlying old population has an age of about 10 Gyr. Taking the median color of all our measurements on the host
we find that within the errors and including a visual extinction of (Rieke & Lebofsky 1985) this result is consistent with an age of 10 Gyr. But we also sample regions of active star formation (as indicated by Canalizo & Stockton 2000), i.e. regions with much younger stellar components. The authors find e.g. a young starburst population within the tidal tail at the position of our aperture 11. The color is about 0.25 mag bluer than the median color of the host galaxy. Its position is shifted in by about 0.2 mag to the red with respect to the evolutionary track shown in Fig. 3. This indicates a younger stellar population which may be associated with warm dust that contributes to the red color in emission. Canalizo & Stockton (2000) quote an age of the corresponding stellar population of about 10 Myrs mixed with an underlying old stellar population of about 10 Gyr. Starburst populations with those ages lie at the lower (bluer) end of the color-evolution curve in the two color diagram. The presence of warm dust and the location of the aperture in the two color diagram, however, may indicate that a considerable reddening is at work. In this case the optical radiation would only be indicative of the properties of a fraction of the underlying stellar population.
(4) The circum-nuclear region. The flux from central regions of the host galaxy is still dominated by emission from the active nucleus. In order to get a more detailed view on the underlying host we subtracted the contribution of the active nucleus. Here we used the fact that the QSO-nucleus is unresolved, i.e. star like in extent. We have done the subtraction by taking a star within a distance of 1′to 3C 48 shifting its centroid with subpixel-accuracy onto the position of the 3C 48-centroid and subtracting it scaled to the flux of the active nucleus. One has to take care that no ’holes’ appear in the galaxy after this process. Ideally this should give a smooth brightness distribution in the central region after subtraction and primarily the host contribution should remain.
| Band | Mag |
|---|---|
Figure 5 displays the core-subtracted images in the -, - and -bands and Table 6 lists the nuclear contributions which have been subtracted. After the subtraction there remains no really smooth brightness distribution but certain residuals. This is most probable due to psf-mismatching. It would be favorable to take a composite psf by measuring several stars, giving a more realistic sampling of the point-spread function, impossible in this case due to the restricted FOV of the science exposures. But a brightness excess region about 1″northeast of the QSO is clearly visible in the residual images as indicated in Figure 5.
| Band | FWHM [″] | magPeak |
|---|---|---|
| J | 2.1 | 0.42 |
| H | 2.1 | 0.49 |
| Ks | 1.2 | 2.84 |
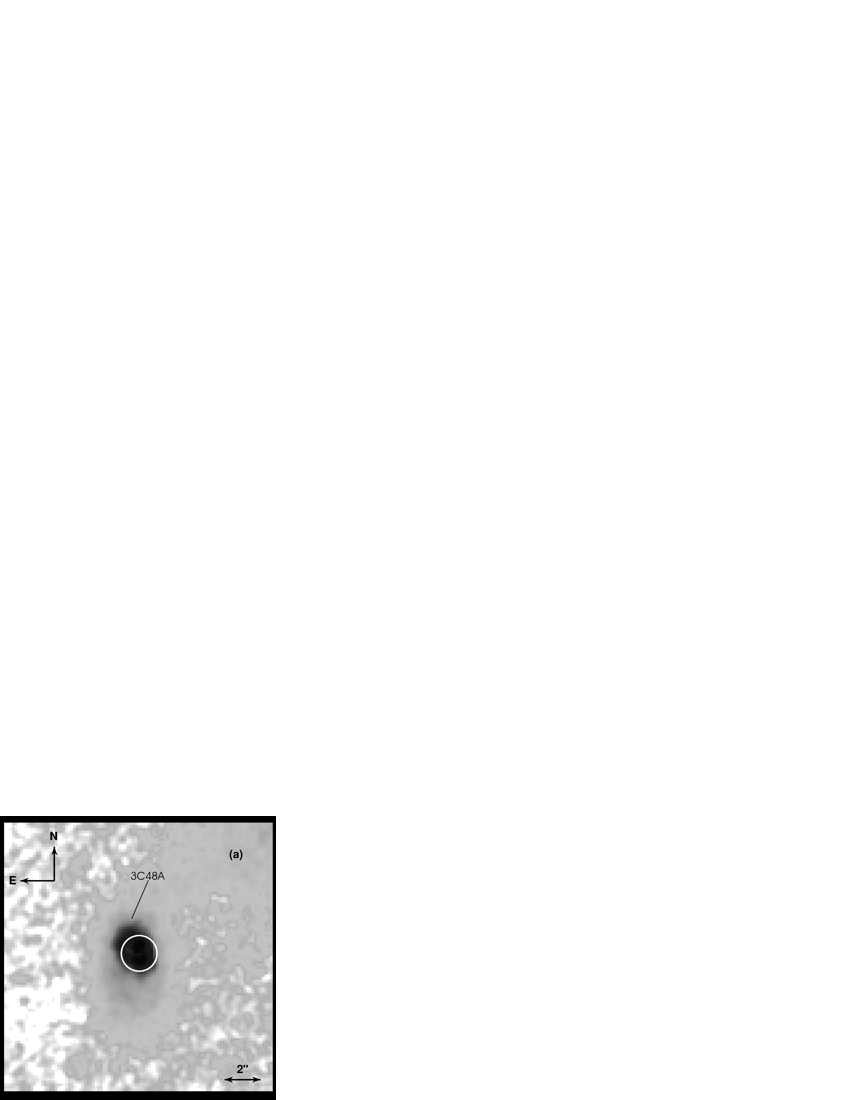

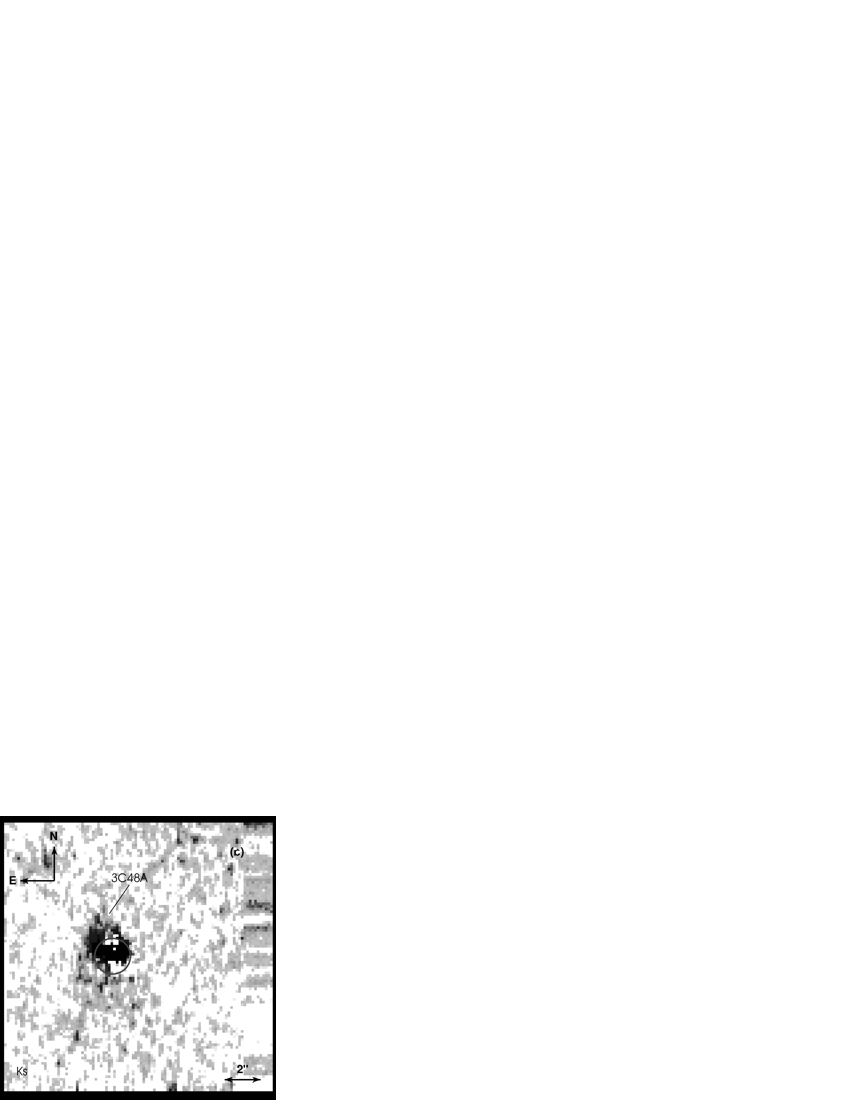
Its peak position in all three bands is north-east of the QSO-location, having a position angle of about 40∘ (as measured from north to east). This feature is most prominent in the Ks image whereas it gets fainter in the and images.
In order to estimate the amount of magnitudes with which 3C 48A exceeds the underlying host galaxy emission, we fitted a Gaussian to this emission region. After subtraction of a Gaussian with this scaling we recognized a circular symmetric residual emission from the central region as expected. On the opposite side of 3C 48 at the same distance as 3C 48A we determined the flux value of the host galaxy. The difference between these two values then gives an estimate of the 3C 48A contribution presented in Table 7.
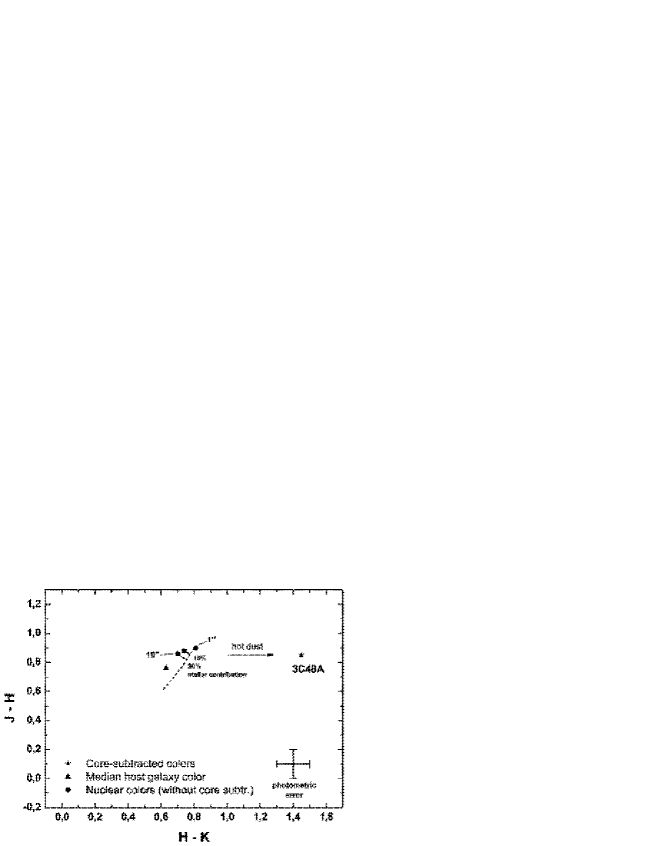
and colors were determined by measuring the flux in , and in apertures of the size of the FWHM of the Gaussian profile. Figure 4 displays the data in a two color diagram. The determined colors of 3C 48A have to be taken with care, because of the psf mismatch mentioned above. Additionally, the band image is quite noisy which makes the measurement process more complicated. Together this leads to a high degree of freedom in choosing an appropriate Gaussian fit of this region. The apertures have been chosen to be of the sizes listed in Table 7, i.e. rather small, in order to reduce the impact of the imperfect QSO-subtraction process, which did not result in a smooth brightness distribution and produced some ’holes’.
Figure 4 shows that the 3C 48A area is heavily reddened in the direction. This indicates the presence of hot dust which usually shifts colors exclusively in the direction as it influences predominantly the band (Glass & Moorwood 1985).
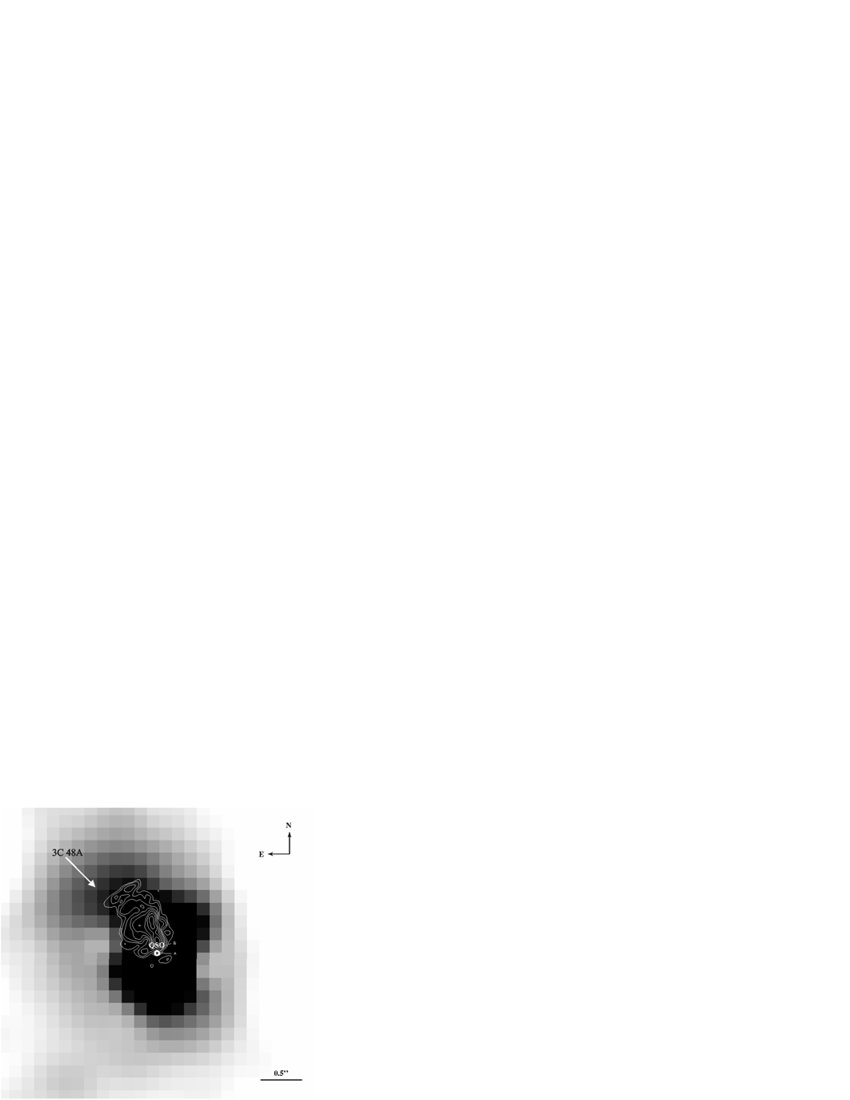
An overlay of the NIR images with a radio continuum map of Merlin and European VLBI data at 1.66 GHz (Wilkinson et al. 1991) shows an apparent alignment of the radio jet and the position of 3C 48A (Fig. 6). Such an alignment was also found by Stockton & Ridgway (1991). Together with the results of Scharwächter et al. (2003) there is still no definite answer on the origin of the excess brightness of 3C 48A. Probably it is a combination of both, a second nucleus and a jet-ISM interaction.
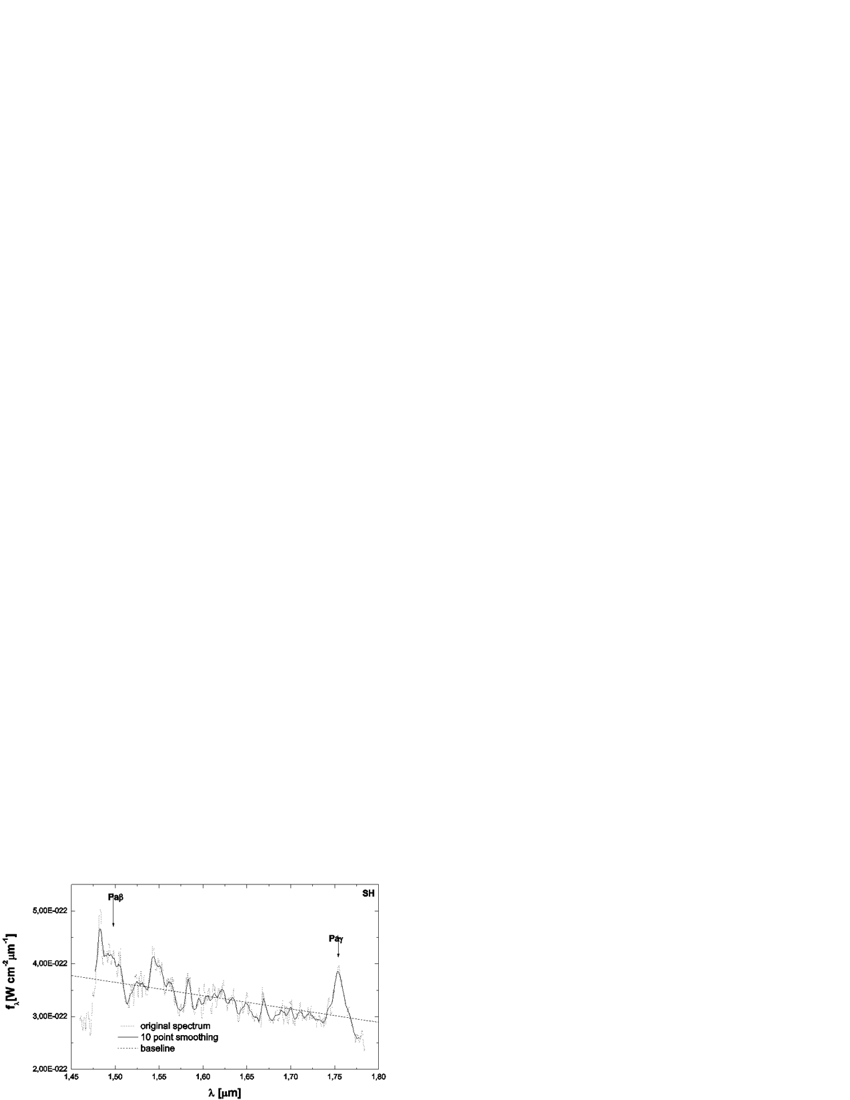
3.2 The -band Spectrum
The most prominent features in the spectrum (Fig. 7) are the Pa17561 and Pa14985 lines (cf. Table 8).
| Line | [m] | [m] |
|---|---|---|
| -band | ||
| Pa | 1.2818 | 1.7561 |
| Pa | 1.0938 | 1.4985 |
| -band | ||
| CO(6-3) | 1.6185 | 2.2173 |
| Si I | 1.5892 | 2.1772 |
| H2(1-0) S(7) | 1.7475 | 2.3941 |
| Fe II | 1.5335 | 2.1009 |
| Fe II | 1.6435 | 2.2516 |
| Fe II | 1.7449 | 2.3905 |
The baseline is subtracted using a straight line. A Gaussian fit to the Pa and Pa lines gives line fluxes of
| (2) | |||||
| (3) |
The line ratio PaPa can then be calculated:
| (4) |
When using line ratios for Menzel’s case B (see e.g. Glass 1999 or Osterbrock 1989), this result is consistent within its errors with temperatures of K and electron densities of cm-3, which are typically found for the atomic interstellar medium in QSO nuclei.
3.3 The -band Spectrum
The spectrum (Fig. 8) is less noisy but there is hardly any feature to be recognized at its original spectral resolution of m. Therefore we smoothed the spectrum with a boxcar of a width of 4 pixels. There are two features appearing in the spectrum, one left of the indicated Si I line and one at a wavelength of about 2.3 m. The latter one could not be identified. At this location there seems to be no prominent emission line. We suggest this to be a noise peak. The absorption feature shortward of the Si I line is most probably an atmospheric or stellar residual from the telluric-line removal and can therefore not be attributed to 3C 48. The noise per pixel of the smoothed spectrum is about half of the noise in the original spectrum
| (5) |
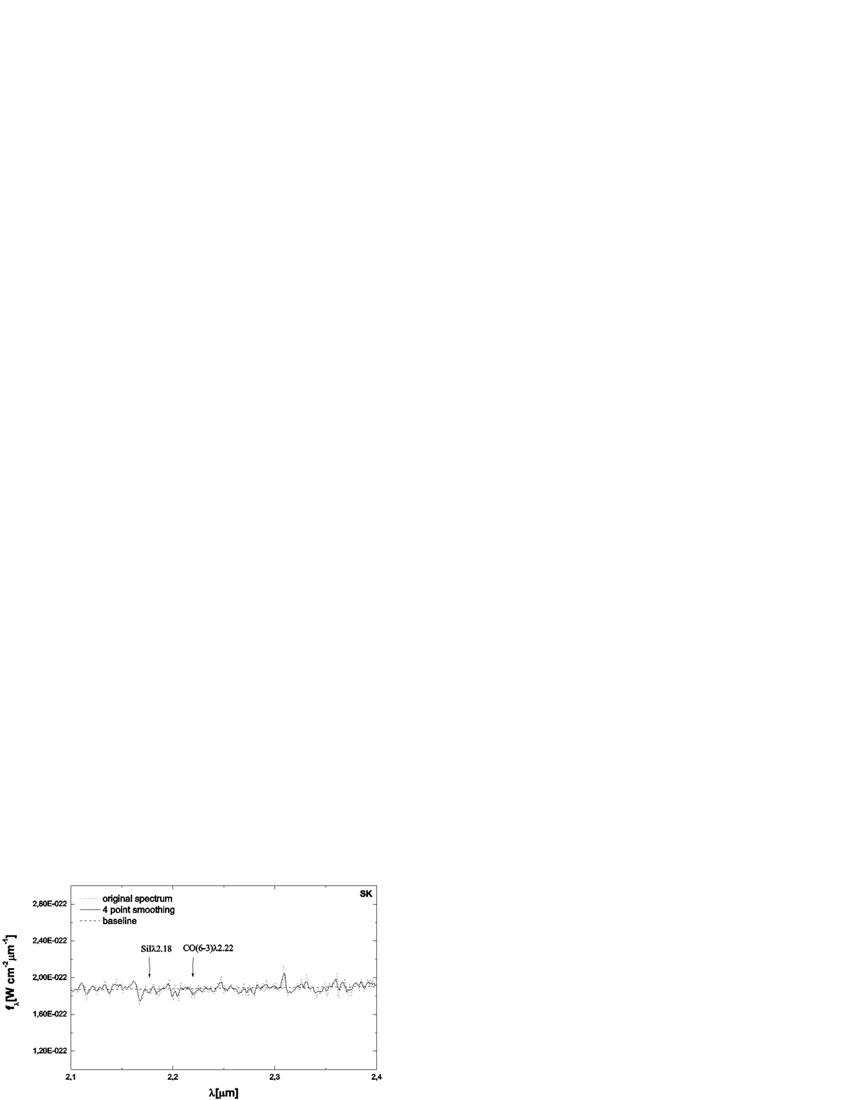
We investigated the noise features at the CO(6-3) line at a redshifted wavelength of 2.217 m (cf. Table 8). The CO(6-3) line is a tracer of the stellar content of a galaxy, as this line arises in the atmospheres of cool stars (Origlia et al. 1993). It is weak in early K- but strong in late M-type stars. We determined the line flux by using the triangular area above the absorption line. The flux and noise integrated over a wavelength interval of nm is
| (6) | |||||
where the noise was determined by measuring the fluctuations throughout the spectrum except at the CO(6-3) wavelength. We thus have a detection of the line. The depth of the line is about 3% of the continuum level at that wavelength. According to Origlia et al. (1993) the typical depth of this line is about 15% of the continuum for a pure stellar contribution. Taking into account our photometrically determined stellar contribution of about 30% of the galaxy light, this leads to an expected CO(6-3) line depth of . Accordingly our spectroscopic result seems to be consistent with the photometric results within the errors.
4 Summary
We have presented the most recent imaging and spectroscopy data on 3C 48 obtained with ISAAC at the ESO VLT UT1 (Antu). Based on these sensitive high angular resolution data for the first time we can identify the disputed secondary nucleus 3C 48A in the NIR. The location of 3C 48A in the diagram indicates the presence of warm dust, probably heated by starbursts or ongoing starformation discussed in Canalizo & Stockton (2000). Our NIR images do not allow us to decide whether 3C 48A is a true second nucleus (e.g. of a merging companion) or rather due to a jet-ISM interaction.
We have shown that the NIR colors of 3C 48 are reddened compared to a pure 10 Gyr-old stellar population and therefore extinction due to molecular gas and dust plays a role throughout the host galaxy. Measurement of the colors in the NW tidal tail indicate a younger (blue ) but dust-associated (red ) stellar population. However, a high visual extinction seems to be at work as un-reddened young main sequence populations are located further to the blue in Fig. 3. Therefore deep, high resolution NIR spectroscopy of the host galaxy is needed.
The QSO-subtracted colors compared to pure 10 Gyr stellar colors show a stellar contribution to the overall galaxy continuum light of about 30% in , which is consistent with the 1 depth limit of the CO(6-3) absorption line in the -band spectrum.
We can see tidal features in the images obtained in all three NIR bands. Judging from the colors, the apparent counter-tidal tail to the southeast of the QSO more likely seems to be an un-associated galaxy in the foreground, whereas Canalizo & Stockton (2000) find it to be a background galaxy at a redshift of =0.8. Despite this discrepancy it seems to be established that the apparent counter-tidal tail is not associated with 3C 48. Therefore further investigation is necessary. Another solution to the missing counter tidal tail is given by multi particle simulations (Scharwächter et al. 2003), which show that there could be a counter tidal tail in a SW-NE direction in front of the galaxy. This is in correspondence with the velocity dispersions measured by Canalizo & Stockton (2000) in the optical along their slit B.
Its large host galaxy which is clearly subject to strong tidal interactions makes 3C 48 an ideal candidate for further studies of the merger-induced starformation at its redshift of .
Acknowledgements.
This work was supported in part by the Deutsche Forschungsgemeinschaft (DFG) via grant SFB 494. We kindly thank T. Ott, MPE Garching, for interest and initial support. We also kindly thank P. N. Wilkinson for the permission to use the 1.66 GHz continuum map.References
- Boroson & Oke (1984) Boroson, T. A. & Oke, J. B. 1984, ApJ, 281, 535
- Boyce et al. (1999) Boyce, P. J., Disney, M. J., & Bleaken, D. G. 1999, MNRAS, 302, L39
- Bruzual A. & Charlot (1993) Bruzual A., G. & Charlot, S. 1993, ApJ, 405, 538
- Canalizo & Stockton (2000) Canalizo, G. & Stockton, A. 2000, ApJ, 528, 201
- Chatzichristou et al. (1999) Chatzichristou, E. T., Vanderriest, C., & Jaffe, W. 1999, A&A, 343, 407
- Frogel et al. (1978) Frogel, J. A., Persson, S. E., Matthews, K., & Aaronson, M. 1978, ApJ, 220, 75
- Glass (1999) Glass, I. S. 1999, Handbook of infrared astronomy (Cambridge University Press)
- Glass & Moorwood (1985) Glass, I. S. & Moorwood, A. F. M. 1985, MNRAS, 214, 429
- Hawarden et al. (2001) Hawarden, T. G., Leggett, S. K., Letawsky, M. B., Ballantyne, D. R., & Casali, M. M. 2001, MNRAS, 325, 563
- Hutchings & Neff (1997) Hutchings, J. B. & Neff, S. G. 1997, AJ, 113, 550
- Moorwood (1995) Moorwood, A. F. 1995, in Proc. SPIE Vol. 2475, p. 262-267, Infrared Detectors and Instrumentation for Astronomy, Albert M. Fowler; Ed., Vol. 2475, 262–267
- Neugebauer et al. (1985) Neugebauer, G., Soifer, B. T., & Miley, G. K. 1985, ApJ, 295, L27
- Origlia et al. (1993) Origlia, L., Moorwood, A. F. M., & Oliva, E. 1993, A&A, 280, 536
- Osterbrock (1989) Osterbrock, D. E. 1989, Astrophysics of Gaseous Nebulae and Active Galactic Nuclei (University Science Books)
- Persson et al. (1998) Persson, S. E., Murphy, D. C., Krzeminski, W., Roth, M., & Rieke, M. J. 1998, AJ, 116, 2475
- Rieke & Lebofsky (1985) Rieke, G. H. & Lebofsky, M. J. 1985, ApJ, 288, 618
- Sanders et al. (1988) Sanders, D. B., Soifer, B. T., Elias, J. H., et al. 1988, ApJ, 325, 74
- Scharwächter et al. (2003) Scharwächter, J., Eckart, A., Pfalzner, S., et al. 2003, accepted A&A, astro-ph/0310740
- Scoville et al. (1993) Scoville, N. Z., Padin, S., Sanders, D. B., Soifer, B. T., & Yun, M. S. 1993, ApJ, 415, L75
- Stockton & Ridgway (1991) Stockton, A. & Ridgway, S. E. 1991, AJ, 102, 488
- Toomre & Toomre (1972) Toomre, A. & Toomre, J. 1972, ApJ, 178, 623
- Tyul’bashev & Chernikov (2001) Tyul’bashev, S. A. & Chernikov, P. A. 2001, A&A, 373, 381
- Wilkinson et al. (1991) Wilkinson, P. N., Tzioumis, A. K., Benson, J. M., et al. 1991, Nature, 352, 313
- Wink et al. (1997) Wink, J. E., Guilloteau, S., & Wilson, T. L. 1997, A&A, 322, 427