EVOLUTION IN THE COLORS OF LYMAN–BREAK GALAXIES FROM TO 11affiliation: Based on observations taken with the NASA/ESA Hubble Space Telescope, which is operated by the Association of Universities for Research in Astronomy, Inc. (AURA) under NASA contract NAS5–26555, and based on observations collected at the European Southern Observatory, Chile (ESO Programmes 168.A-0485, 64.O-0643, 66.A-0572, 68.A-0544).
Abstract
The integrated colors of distant galaxies provide a means for interpreting the properties of their stellar content. Here, we use rest–frame UV–to–optical colors to constrain the spectral–energy distributions and stellar populations of color–selected, –dropout galaxies at in the Great Observatories Origins Deep Survey. We combine the ACS data with ground–based near–infrared images, which extend the coverage of galaxies at to the rest–frame –band. We observe a color–magnitude trend in the rest–frame versus diagram for the galaxies that has a fairly well–defined “blue–envelope”, and is strikingly similar to that of color–selected, –dropout galaxies at . We also find that although the co-moving luminosity density at rest–frame UV wavelengths (1600Å) is roughly comparable at and , the luminosity density at rest–frame optical wavelengths increases by about one–third from to . Although the star–formation histories of individual galaxies may involve complex and stochastic events, the evolution in the global luminosity density of the UV–bright galaxy population corresponds to an average star–formation history with a star–formation rate that is constant or increasing over these redshifts. This suggests that the evolution in the luminosity density corresponds to an increase in the stellar–mass density of %.
Subject headings:
early universe — cosmology: observations — galaxies: evolution — galaxies: formation — galaxies: high–redshift — galaxies: photometry1. Introduction
Current investigations of high–redshift () galaxies have been focusing on the properties of these objects as a global population. Many surveys identify these galaxies by their strong emission at rest–frame UV wavelengths (observed–frame optical) and spectral breaks at Lyman and the Lyman limit (so–called Lyman–break galaxies [LBGs]; e.g., Giavalisco 2002). These galaxies are generally dominated by the light from OB stars, and have properties that are similar to local starburst galaxies (e.g., Shapley et al., 2003). Near–infrared (NIR) photometry of galaxies at extends the observations to rest–frame optical wavelengths, probing the light from A– and later–type stars. Several studies have used NIR observations to constrain the properties of the stellar populations of galaxies (e.g., Sawicki & Yee 1998; Papovich, Dickinson, & Ferguson 2001; Shapley et al. 2001; Labbé et al. 2003; Franx et al. 2003), and to estimate the evolution of the global stellar–mass density for (e.g., Dickinson et al., 2003).
At present, some of the constraints on the parameters of the galaxies’ stellar–population models are uncertain by more than an order of magnitude (Papovich et al. 2001; Shapley et al. 2001). Even so, the stellar–population ages and star–formation histories of the models have broad implications for galaxy evolution at higher redshifts (see Ferguson, Dickinson, & Papovich 2002). The galaxies’ spectral–energy distributions (SEDs) contain the integrated record of their past and current star formation. Thus, comparing galaxy SEDs at different redshifts allows us to improve the constraints on the star–formation histories of these galaxies.
In this Letter, we study galaxies at selected from deep imaging with the Advanced Camera for Surveys (ACS) onboard the Hubble Space Telescope (HST) and augmented with NIR observations from the ground (§ 2), and we compare these to similar rest–frame colors for color–selected galaxies at from the Hubble Deep Fields, North and South (HDF–N and –S; § 3). We then discuss the SEDs of the luminosity density generated by these galaxies, and we consider the implications on the galaxies’ star–formation histories (§ 4). Throughout this Letter, we use a flat cosmology with , , a Hubble constant of 70 km s-1 Mpc-1, and we use AB magnitudes, .
2. The Observations and Galaxy Sample


The HST data used in this letter stem from the first three epochs of ACS imaging of the Chandra Deep Field South (CDF–S) as part of the Great Observatories Origins Deep Survey (GOODS) program. These data provide imaging in the , , , and –bands covering a field of view of . The dataset, its reduction procedures, and object cataloging are described in Giavalisco et al. (2003a).
The ACS data only probe rest–frame UV wavelengths for galaxies at . To study the rest–frame optical light from higher redshift galaxies we combined the ACS data with VLT/ISAAC imaging in the bands obtained as part of GOODS (Giavalisco et al., 2003a). Currently, we use eight individual ISAAC tiles covering a total area of 50 arcmin2.
We have analyzed the ISAAC images to extract optimal photometry matched to the ACS –selected catalog. In brief, we use the –band data to create two–dimensional templates for each object, convolve these to match the point–spread function (PSF) of the ground–based data, and scale and fit the convolved templates to the –band images to extract object fluxes (see C. Papovich et al. in preparation; Fernández-Soto, Lanzetta, & Yahil 1999). The advantage of this method as applied to faint galaxies is that it reduces concerns about PSF– and aperture–matching effects on the relative photometry and permits deblending of objects partially merged by the terrestrial seeing.
We identified high–redshift galaxies whose SEDs reveal a spectral discontinuity at the observed Lyman limit, which arises from H I absorption systems along the line of sight (e.g., Madau, 1995). We selected “–dropout” galaxies with, , , and (see Giavalisco et al., 2003b). Using these colors, we are able to reject most lower–redshift interlopers while detecting galaxies at with bright rest–frame UV spectra (which is indicative of ongoing star formation; Leitherer et al. 1999). Indeed, using the spectroscopic redshifts available for GOODS objects, we observe no contamination from stars or galaxies at . Our modeling indicates that these criteria identify galaxies with an expected redshift distribution that peaks at and tapers to higher and lower redshifts, with 50% completeness limits of .
3. UV–Optical Colors of High–Redshift Galaxies
In the left panel of figure 1, we show the versus color–magnitude diagram for the –dropout galaxies. For , these colors correspond approximately to rest–frame . Although most of the –dropout galaxies have relatively blue rest–frame UV–to–optical colors, the brightest galaxies in have redder optical–infrared colors with a fairly well–defined “blue–envelope”. Because this sample is selected in the –band, there is no reason to expect that the lack of bright galaxies () with blue colors is due to some selection effect. At fainter magnitudes, part of this trend may be due to increasing photometric uncertainties. However, the trend among the –dropouts is apparent even at bright magnitudes where the photometric errors are small, and exists for the –dropouts (see below), where the optical and IR data are much deeper than the GOODS data.
A similar blue–envelope exists for the colors of galaxies at . The right panel of figure 1 shows the versus –band color–magnitude diagram for –dropout galaxies from the WFPC2 and NICMOS data of the HDF–N (Papovich et al. 2001; M. Dickinson et al. in preparation) and from the WFPC2 and VLT/ISAAC data of the HDF–S (Labbé et al., 2003), and using the color–selection of Steidel et al. (1999). The –dropout criteria identify galaxies with a mean redshift, , and 50% completeness limits of . Although the galaxy samples for the HDF–N and –S are originally detected in NIR data, our tests using an –band–selected sample for the HDF–N yield essentially no change in the number of selected –dropout galaxies nor in the number and luminosity densities derived below. The advantage of using these data is that they provide band–matched catalogs from optical–to–NIR wavelengths that are comparable to the data for the –dropout galaxies.
For the galaxies, the color corresponds to nearly identical rest–frame colors as for the galaxies at . The color–magnitude trends at and 4 are strikingly similar. Thus, the LBGs at both and seem to require that either (or likely some combination of) the mean stellar population age, metallicity, and/or dust opacity increase with optical luminosity. Furthermore, we also note that the –dropout galaxies have slightly redder rest–frame colors as evidenced by the fact that the “blue–envelope” shifts by mag. This reddening seems to imply that the mean ages, metallicity, and/or dust opacity are actually increasing from to 3.
4. The Integrated SEDs of High–Redshift Galaxies
To measure the number and luminosity densities, we require the redshift distribution and effective volumes probed by the – and –dropout criteria. For the –dropout galaxies, we have used the effective volume derived by Steidel et al. (1999). For the –dropout galaxies, we have simulated artificial LBGs in the GOODS data with a distribution of colors and sizes that match the observed –dropout properties (see Ferguson et al. 2003). We then measure photometry for the simulated galaxies and apply our color–selection criteria to derive the probability that a LBG with given magnitude and redshift is detected in the data, . This technique accounts for incompleteness due to magnitude and surface–brightness effects as well as the color–selection process. We then compute the effective volumes, . Because these selection criteria are insensitive to heavily obscured galaxies and to galaxies with passively evolving, older stellar populations, our estimates of galaxy densities are strictly lower limits, derived from the UV–bright population alone.
To calculate the galaxy densities we consider galaxies brighter than mag, where for the –dropouts (Steidel et al. 1999; where , and has been adjusted slightly to account for differences in cosmology and the mean redshifts of the samples here and those of Steidel et al.), and for the –dropouts (Giavalisco et al. 2003b). We derive specific luminosity densities by integrating the flux densities in each bandpass to mag (where the –dropout galaxies are well–detected in both the ACS and ISAAC data, see figure 1): , where is the observed number density, , and is the luminosity distance. We plot the measured values in figure 2 along with uncertainties from a bootstrap resampling. Note that we have made no correction for fainter galaxies.
The area of the HDFs and the portion of the GOODS field with ISAAC imaging are fairly small, and cosmic variance may be a substantial source of uncertainty (see Somerville et al. 2003). To limit this effect on our results, we have normalized the luminosity densities of both the – and –dropout samples such that they match the rest-frame UV values of Steidel et al. (1999) and Giavalisco et al. (2003b), respectively, while preserving the measured “color” between the rest–frame UV and other wavelengths. These surveys average over more area and sightlines than considered here, which significantly reduces the uncertainties from cosmic variance. Cosmic variance may still be a factor for the –band luminosity densities. The luminosity weighted mean rest-frame colors of the –dropout galaxies in the HDF–N and -S vary by mag, which provides an estimate on the uncertainty in the typical luminosity–density colors of LBGs in single HDF-sized fields. Future studies using the entire GOODS dataset (with full –band and NIR observations of both fields) will substantially increase the sample size of both the – and –dropouts by roughly a factor of and 10, respectively, and should strengthen our results.
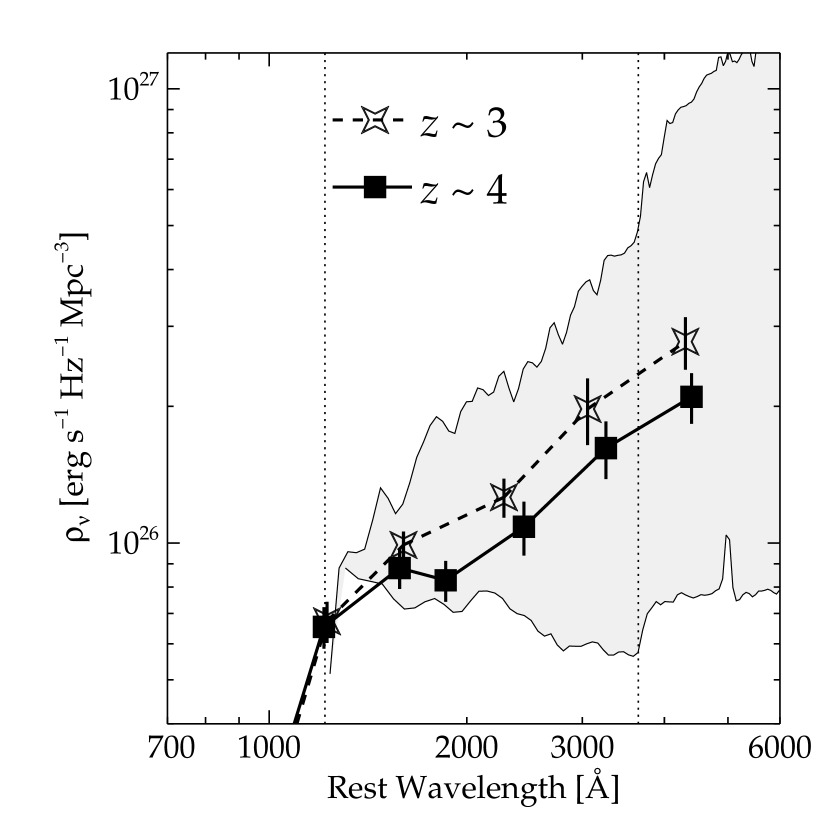
The fact that the rest–frame 1600 Å luminosity density is roughly unchanged (to within %) implies that the star–formation rate (SFR; at least of massive, OB stars) is roughly constant (see, e.g., Madau, Pozzetti, & Dickinson 1998). However, we observe marginal evidence for a steepening of the UV continuum ( Å), and strong evidence (% confidence) that the average color becomes redder for the –dropouts relative to those for the –dropouts. In particular, the luminosity density at rest–frame 4400 Å grows from erg s-1 Hz-1 Mpc-3 at to erg s-1 Hz-1 Mpc-3 at . Based on the observed color distribution of LBGs (to fainter magnitude limits than our samples here), our simulations suggest that this result is unlikely to be biased significantly by the color–selection of these galaxies. This change in the mean color suggests that the mean stellar mass–to–light ratio of these galaxies is also increasing. Therefore, the total stellar mass density of this population is presumably growing by more than the % increase seen in the rest–frame –band optical light. Dickinson et al. (2003) found evidence for a substantial build–up in the global stellar mass density from to . The present results extend that trend to still higher redshifts.
The luminosity densities constrain the global, average star–formation histories of galaxies at . One possible scenario is a roughly constant SFR with an unchanging dust content. This would produce approximately equal at and 4, and build up the global stellar mass with time, which would redden the average galaxy SED from to as the –band light increases. We note that the Universe ages by % from to 3, and may imply that galaxies formed stars at a near–constant rate from to 3. An alternative scenario is a rising SFR from to 3 with an increasing dust content that is tuned to produce a roughly constant , and is consistent with the suggestion that the UV continuum is redder at . The fractional stellar–mass build-up in this scenario would be still greater than that with constant SFR and an unchanging dust content.
Both of the above scenarios invoke a SFR that is either constant or growing in time. However, the stellar populations observed in galaxies appear to be young (a few yr for simple, monotonic star–formation histories; Sawicki & Yee 1998; Papovich et al. 2001; Shapley et al. 2001), which implies that these stars had not formed by . Galaxies at these redshifts probably have star–formation histories that are more complex (with multiple formation episodes) than those described by the simple models (see Ferguson et al. 2002). However, even though the star–formation histories for individual galaxies may be fairly stochastic, the global, average SFR at high redshift must be roughly constant in order to explain the evolution in the UV and optical luminosity densities.
Although the increase in the observed optical luminosity density from to appears robust, the uncertainties due to cosmic variance and other systematics are non-negligible. If there is, in fact, no evolution in the optical luminosity density then this could imply that stars formed in the –dropout galaxies are not present within the –dropout galaxies, and that at some point the galaxies cease forming stars and evolve beyond the –dropout selection criteria. This would have interesting implications for constraints on the sources of reionization and/or on the IMF at higher redshifts (see, e.g., Ferguson et al. 2002). However, this would likely be inconsistent with the low number density of red, objects (Franx et al., 2003). Moreover, the majority of galaxy evolution models predict growth in the stellar–mass density by amounts consistent with our observations (although specific predictions vary from model to model; see Dickinson et al. 2003, and references within), and this suggests that much of the stellar–mass assembly at high–redshifts does occur in these UV–bright galaxies.
5. Summary
We have compared the rest–frame UV–optical colors of color–selected galaxies at to those of similarly selected galaxies at . We find a great degree of similarity in the rest–frame versus diagram for galaxies from . However, although the rest–frame UV luminosity densities at and are comparable, there is evidence that the rest–frame –band luminosity density grows by %. Even though the star–formation histories of individual galaxies may involve complex and stochastic processes, the evolution of the luminosity density corresponds to a globally average SFR that is constant or increases with time. This implies that the average stellar-mass–to–light ratio of galaxies is also increasing over this redshift range and that the global stellar–mass density grows by more than % over the Gyr interval that elapses between and 3.
By selecting in the rest–frame UV, we are likely to miss galaxies without ongoing, relatively unobscured star formation. For example, Franx et al. (2003) have used deep NIR images of the HDF–S to identify red galaxies which may have evolved, massive stellar populations at , and may contribute significantly to the global stellar mass density. Such objects would be missing from the samples here, leading to an underestimate of the total density. Logically, the number and mass content of these red galaxies should grow as the Universe ages. Therefore, the apparent increase in stellar mass density from to 3, as traced here by the UV–bright population, would only be strengthened if red, UV–faint objects were also considered. Ultimately, the full GOODS dataset will permit more direct tests of the star–formation histories of the distant galaxy population, as will future observations with the Space Infrared Telescope Facility and the James Webb Space Telescope.
References
- Calzetti et al. (2000) Calzetti, D., Armus, L., Bohlin, R. C., Kinney, A. L., Koornneef, J., & Storchi–Bergmann, R. 2000, ApJ, 533 682
- Dickinson et al. (2003) Dickinson, M., Papovich, C., Ferguson, H. C., & Budavári, T. 2003, ApJ, 587, 25
- Fernández–Soto, Lanzetta, & Yahil (1999) Fernández–Soto, A., Lanzetta, K. M., & Yahil, A. 1999, ApJ, 513, 34
- Ferguson et al. (2002) Ferguson, H. C., Dickinson, M., & Papovich, C. 2002, ApJ, 569, L65
- Ferguson et al. (2003) Ferguson, H. C., et al. 2003, ApJ, in press (astro-ph/0309058)
- Franx et al. (2003) Franx, M. et al. 2003, ApJ, 587, L79
- Giavalisco (2002) Giavalisco, M. 2002, ARA&A, 40, 579
- Giavalisco et al. (2003a) Giavalisco, M. et al. 2003a, ApJ, in press (astro-ph/0309105)
- Giavalisco et al. (2003b) Giavalisco, M. et al. 2003b, ApJ, in press (astro-ph/0309065)
- Kinney et al. (1996) Kinney, A. L., Calzetti, D., Bohlin, R. C., McQuade, K., Storchi-Bergmann, T., & Schmitt, H. R. 1996, ApJ, 467, 38
- Labbé et al. (2003) Labbé, I. et al. 2003, AJ, 125, 1107
- Leitherer et al. (1999) Leitherer, C. et al. 1999, ApJS, 123, 3
- Madau (1995) Madau, P. 1995, ApJ, 441, 18
- Madau, Pozzetti & Dickinson (1998) Madau, P., Pozzetti, L., & Dickinson, M. 1998, ApJ, 498, 106
- Papovich, Dickinson, & Ferguson (2001) Papovich, C., Dickinson, M., & Ferguson, H. C. 2001, ApJ, 559, 620
- Sawicki & Yee (1998) Sawicki, M., & Yee, H. K. C. 1998, AJ, 115, 1329
- Shapley et al. (2001) Shapley, A. E., Steidel, C. C., Adelberger, K. L., Dickinson, M., Giavalisco, M., & Pettini, M. 2001, ApJ, 562, 95
- Shapley et al. (2003) Shapley, A. E., Steidel, C. C., Pettini, M., & Adelberger, K. L. 2003, ApJ, 588, 65
- Somerville et al. (2003) Somerville, R. S., Lee, K., Ferguson, H. C., Gardner, J. P., Moustakas, L. A., Giavalisco, M., & Renzini, A. 2003, ApJ, in press (astro-ph/0309071)
- Steidel et al. (1999) Steidel, C. C., Adelberger, K. L., Giavalisco, M., Dickinson, M., & Pettini, M. 1999, ApJ, 519, 1