Nuclear Dynamics and Star Formation of AGN 11institutetext: Max-Planck-Institut für extraterrestrische Physik, Postfach 1312, 85741 Garching, Germany 22institutetext: Department of Astrophysics, Denys Wilkinson Building, Keble Road, Oxford, OX1 3RH, UK
Nuclear Dynamics and Star Formation of AGN
Abstract
We are using adaptive optics on Keck and the VLT to probe the dynamics and star formation in Seyfert and QSO nuclei, obtaining spatial resolutions better than 0.1′′ in the H- and K-bands. The dynamics are traced via the 2.12 m H2 1-0 S(1) line, while the stellar cluster is traced through the CO 2-0 and 6-3 absorption bandheads at 2.29 m and 1.62 m respectively. Matching disk models to the H2 rotation curves allows us to study nuclear rings, bars, and warps; and to constrain the mass of the central black hole. The spatial extent and equivalent width of the stellar absorption permits us to estimate the mass of stars in the nucleus and their contribution to the emission. Here we report on new data for I Zwicky 1, Markarian 231, and NGC 7469.
1 Introduction
QSOs include some of the most luminous objects in the universe. Their prodigious energy output is powered by accretion onto a black hole with mass in the range – M⊙, although it is becoming increasingly apparent that star formation also plays an important part — one that is perhaps still underestimated. This project focusses on studying the gas and stars in the nuclei of such AGN. In order to select nearby targets where adaptive optics can probe the nuclear scales, we are limited to the lower end of the luminosity range spanning the crossover between QSOs and Seyfert nuclei. The aims are to: 1) measure the gas dynamics on scales less than 1 kpc to understand how gas is driven in to the nucleus, and to constrain the mass of the black hole there; 2) determine the contribution and mass of the nuclear stellar cluster, and to further our understanding of the relation between an AGN and the surrounding star formation.
In this summary, we briefly discuss 3 nearby QSO/Seyfert nuclei for which at least some data has been analysed: spectroscopy of NGC 7469 and Mkn 231, and imaging of I Zw 1. Even for these objects, 1′′ corresponds to 300-1200 pc, making the use of adaptive optics mandatory to probe the nuclear scales of order 100 pc or less. These are all luminous objects, with – L⊙, in which the nuclear activity appears to have been triggered by an interaction. In every case at least 2/3 of the luminosity originates in star formation rather than the black hole. So it is clear that star formation does play a crucial role in AGN, and we must begin with such objects if we are to understand how this may apply to the more luminous QSOs at higher redshift.
| Object | Telescope | Instrument | Slit Width | Band | Resolution |
|---|---|---|---|---|---|
| NGC 5506 | VLT | NAOS + CONICA | 86 mas | K | 1400 |
| I Zw 1 | VLT | NAOS + CONICA | 86 mas | H/K | 1500/1400 |
| Mkn 231 | Keck | NIRC-2 + AO | 80 mas | H/K | 1800/2500 |
| Mkn 509 | Keck | NIRC-2 + AO | 80 mas | K | 2500 |
| NGC 7469 | Keck | NIRSPEC + AO | 37 mas | K | 2900 |
2 Instrumentation and Observations
A summary of the spectroscopic observations which have been made to date (from mid-2002 until late-2003) is given in Table 1. The data have been collected using both the Keck II telescope and the VLT, putting us in a fortunate position of being able to compare the adaptive optics systems and their instrumentation. The original AO camera on Keck was NIRSPEC which used a special optical feed to change the plate scale so that it was suitable for adaptive optics. Although this meant that the slit length was only 4′′ and the width 37–74 mas, it was possible to achieve spectral resolutions of necessary for dynamics work. This is now superceeded by NIRC-2 which is designed to work with an AO system. Its larger detector provides good sampling with a 10–40′′ field of view, and allows one to reach the necessary spectral resolution with a wider slit, better matched to the full size of the diffraction limited PSF. While the AO system is good and relatively straight forward to use, it has only a fixed number of about subapertures. This is where NAOS on the VLT has a big advantage: it can switch between and lenslet arrays, allowing it to perform well even on fainter objects. For example, in unexceptional conditions it was possible to reach 15% Strehl in the H-band correcting on the slightly extended nucleus of I Zw 1. While its camera CONICA has a large number of observational modes, and is equipped with tools that make it easy to align the slit across 2 objects, the spectral resolution is relatively low. It is not yet clear whether (200 km s-1) is sufficient to allow useful dynamics studies of AGN.
3 I Zw 1
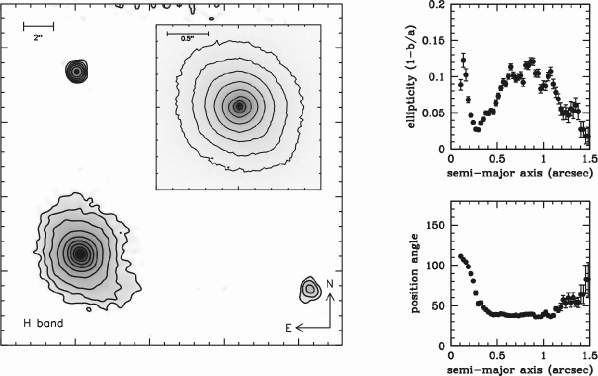
An H-band image of I Zw 1 is presented in Fig. 1. In addition to the bright nucleus, two outlying regions are visible. Both of these, as well as fainter emission throughout the whole region and a tidal tail have been seen at other wavelengths (e.g. J-band, see sch03 ). The faint diffuse region to the west has usually been interpreted as a tidal dwarf galaxy; the compact northern knot was thought to be a foreground star. We have now resolved the northern region (transverse to its offset from the nucleus, to minimise anisoplanatic effects) to have a FWHM of 0.186′′, equivalent to 220 pc. We have not yet measured the flux density, nor estimated its stellar mass — but the large size already suggests that it may also be a tidal dwarf galaxy, or possibly even the progenitor nucleus of the galaxy with which I Zw 1 is interacting.
The inset in Fig. 1 reveals elliptical isophotes around the AGN. These are quantified in the right hand panels: at radii 0.6–1.1′′ the axis ratio is 0.9 at a position angle (PA) of . This is perhaps surprising, since radio CO 1-0 data in the central few arcsec sch98 show that the nucleus is inclined by at PA — almost perpendicular to the elongation of the isophotes. Deprojecting the nuclear region thus increases the isophotal axis ratio to about 1.4. Such a strong deviation from axisymmetry implies the presence of a stellar bar on scales of 0.5–1 kpc, which may be the key to understanding how gas is fed into the nuclear region to fuel the AGN and star formation there.
Lastly, the nucleus itself has a FWHM of 0.102′′, although the data are diffraction limited (the Strehl ratio achieved was 15%). Even accounting for loss of resolution due to undersampling and sub-pixel shifting, we have resolved the nucleus. This suggests that there is a significant stellar cluster on scales of 100 pc.
4 Mkn 231
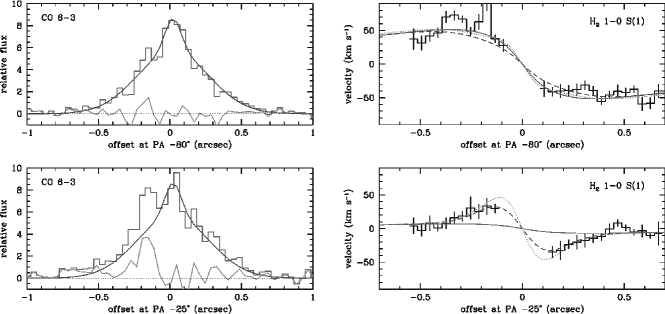
Fig. 2 summarises the spectroscopic results for Mkn 231 (see dav04b for a more complete analysis). The left hand panels show the spatial profile of the 1.62 m CO 6-3 stellar absorption, which has been fit with a double Gaussian. At , the stellar absorption is extended with a FWHM of 0.37′′. For reference, the H-band continuum has a FWHM of 0.19′′, and the resolution is smaller still. The stellar cluster is therefore resolved over a scale of 300 pc. At the CO profile can be reproduced by the same double Gaussian, apart from a residual bump (which also appears in the continuum) offset by ′′ (120 pc) from the peak This cannot be an AO artifact because its shape is well fit in both continuum and CO by a Gaussian with FWHM 0.10′′, rather than simply being a copy of the on-axis shapes. Also, the equivalent width of the CO feature () is different. In the core of the on-axis peak Å (compared to late type stars which have –5 Å), while the off-axis feature has Å; the extended CO has a mean value Å. A full analysis of the mass of the nuclear stellar cluster has not yet been been carried out, but based on these numbers it is already clear that the CO feature is hugely diluted by hot dust associated with the AGN (and perhaps also to some extent with the star cluster itself): even in the H-band the on-axis dilution is a factor 20.
The velocity profiles of the 2.12 m H2 1-0 S(1) are plotted in the two right hand panels, overdrawn with 3 models based on a thin axisymmetric disk. Model 1 (solid line) is for a single disk having a Gaussian mass surface density with FWHM 0.5′′. The disk is inclined by with major axis at PA , as determined by 0.6′′ radio CO 2-1 measurements dow98 . The mass has been set at M⊙ in order to match the rotation curve at . This model clearly does not replicate the Keplerian-like rotation curve at . Instead the observations indicate that at smaller radii gas exists with a different effective major axis, requiring a warped disk model. Model 2 (dashed line) reproduces this in a simplified way. At radii larger than ′′, the disk is as for Model 1. But inside this, the disk is tilted out of its primary plane until the observed major axis lies along . In the model shown here, the resulting inclination of this inner disk is , although any value in the range 20– is possible depending on how much and at what PA the inner disk is tilted. This model matches the observations well, and tends to confirm that there is indeed a warp in the central 100–150 pc of Mkn 231. Model 3 (dotted line) shows the effect on the rotation curve if there were also a M⊙ black hole in the nucleus, and provides an estimate of the upper limit on the black hole mass.
5 NGC 7469
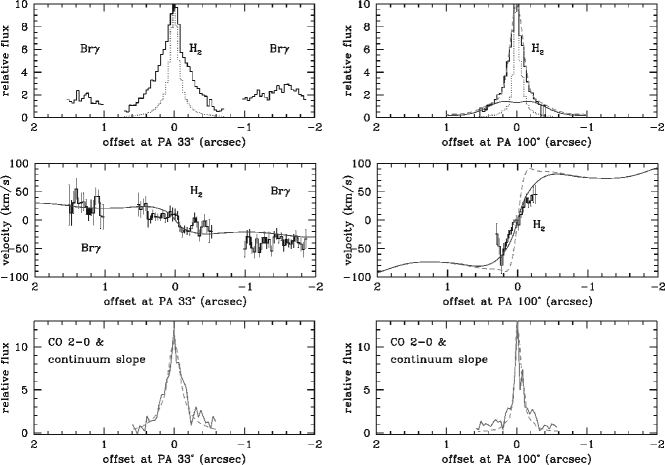
The 85 mas resolution spatial profiles of the 2.12 m H2 1-0 S(1) line are plotted in the upper panels of Fig. 3 for PAs and . At we also show the circumnuclear 2.17 m Br line. The velocity profiles of these emission lines are shown in the centre panel. Overplotted are the rotation curves for a model derived from 0.7′′ radio CO 2-1 data (solid dark curve, see dav04a ). This model consists of a broad disk component, a circumnuclear ring, and a previously unknown nuclear ring at a radius of 0.2′′; it matches both the radio and near infrared data at their different resolutions. However, as shown in the right hand upper panel, the mass distribution of the model is different to the profile of the 1-0 S(1) line. If instead, the 1-0 S(1) line were to trace the mass distribution (pale dashed curve) then the velocity gradient across the inner 0.2′′ would be much steeper. We conclude that the 1-0 S(1) does not trace the mass distribution, but that the emission probably originates in gas irradiated by X-rays from the AGN. Its morphology would then be dominated by the photon density and dust distribution rather than the gas.
The lower panel in Fig. 3 shows that we have resolved the nuclear stellar cluster in NGC 7469 using two different methods. The solid line represents the spatial profile of the 2.29 m CO 2-0 bandhead absorption; the dashed line denotes the continuum slope. This latter method assumes that the continuum comprises stellar light and hot dust emission, and decomposes the spectral slope at each point accordingly. Serendipitously, it demonstrates that the spatial resolution achieved is in fact better than that measured directly from the full continuum. We find that the stellar cluster is asymmetrical, with FWHM of 0.12′′ (30 pc) and 0.22′′ (60 pc) at the 2 PAs. Using a combination of starburst models, the CO equivalent width, the mass model, and the K-band flux density, we can show that in this region the mass is dominated by stars rather than gas. This result adds weight to our prior finding that the gas exists in a nuclear ring around a compact star cluster, similar to the situation seen in NGC 1068 sch00 ; tha97 .
6 Conclusions
So far, this on-going study which uses adaptive optics to probe the nuclear regions of AGN in the near infrared on scales less than 0.1′′, has shown that we can: 1) directly resolve nuclear star clusters, from scales of 30 pc in NGC 7469 to 300 pc in Mkn 231; 2) understand the details of the dynamics in terms of thin disks, including bars, warps, rings, etc; 3) quantify the contributions to the mass from gas, stars, and the black hole itself on these small scales.
References
- (1) R. Davies, L. Tacconi, R. Genzel, 2004a, ApJ, in press
- (2) R. Davies, L. Tacconi, R. Genzel, 2004b, to be submitted to ApJ
- (3) D. Downes, P. Solomon, 1998, ApJ, 507, 615
- (4) E. Schinnerer, A. Eckart, L. Tacconi, 1998, ApJ, 500, 147
- (5) E. Schinnerer, A. Eckart, L. Tacconi, R. Genzel, 2000, ApJ, 533, 850
- (6) J. Scharwächter, A. Eckart, S. Pfalzner, J. Moultaka, C. Straubmeier, J. Staguhn, 2003, A&A, 405, 959
- (7) N. Thatte, A. Quirrenbach, R. Genzel, R. Maiolino, M. Tecza, 1997, ApJ, 490, 238