Spectroscopic analysis of sdB stars from the ESO Supernova Ia Progenitor Survey††thanks: Based on observations collected at the Paranal Observatory of the European Southern Observatory for program No. 165.H-0588(A) and 167.D-0407(A).
Abstract
We report on the analysis of high-resolution optical spectra for 77 subdwarf B (sdB) stars from the ESO Supernova Ia Progenitor Survey. Effective temperature, surface gravity, and photospheric helium abundance are determined simultaneously by spectral line profile fitting of hydrogen and helium lines, and are found to be in agreement with previous studies of sdB stars. 24 objects show spectral signs of a cool companion, being either companion absorption lines or a flux contribution at . Five stars with relatively high luminosity show peculiar profiles, possibly indicating stellar winds. Our results are compared to recent theoretical simulations by Han et al. (2003) for the distribution in effective temperature and surface gravity, and are found to agree very well with these calculations. Finally we present a binary system consisting of two helium-rich hot subdwarfs.
keywords:
stars: subdwarfs, stars: horizontal branch, stars: evolution, stars: winds1 Introduction
In the past years, subdwarf B (sdB) stars were subject to many observational and also theoretical studies, raising lots of new questions in attempting to answer the old ones. How are these stars formed? The relative importance of single-star formation as well as binary evolution still needs to be determined from observations. Maxted et al. (2001) showed that many sdB stars reside in close binaries, indicating a former mass transfer phase to account for the thin envelope of the star. Han et al. (2003) examined various formation channels for simulating sdB formation in this context, combining them to yield the observed sdB population. Theoretical studies of this kind need to be compared to observational data of high quality to evaluate the simulation results and judge our current understanding of sdB formation. With our sdB sample from the ESO Supernova Ia Progenitor Survey (SPY, Napiwotzki et al. 2001), we present a homogeneous, high quality dataset of higher resolution and larger wavelength coverage than previous studies of comparable size. Its analysis should therefore bring new insight into the physics of sdB stars.
2 Observation, reduction, and spectral classification
Spectra were obtained at ESO VLT with the UV-Visual Echelle Spectrograph (UVES) at UT2 (Kueyen). A slit width of was used, resulting in a resolving power of ( at ) or better. The wavelength coverage is , with gaps at about and . For most of the stars, two spectra in different nights were taken. They were then reduced with a procedure developed by C. Karl using the ESO MIDAS software package and parts of the UVES automatic reduction pipeline. The reduced spectra were convolved with a Gaussian of FWHM and rebinned to pixel size.
After a first selection of potential sdB spectra from SPY by visual inspection, a rough line profile fit was performed, and objects with helium-dominated atmospheres were excluded. Following the common assumption that sdB and sdOB stars belong to the same evolutionary type, all selected stars are named sdB stars, being 77 objects with , and (photospheric helium abundance ). 51 program stars are objects from the Hamburg/ESO survey (Wisotzki et al. 1996), 9 from the Hamburg Quasar Survey (Hagen et al. 1995), 14 from McCook & Sion (1999), and 3 from other sources.
In many spectra, signs of a cool companion can be seen, e.g. a broad Ca K line () as opposed to the frequently occuring narrow interstellar Ca K line. The Mg I triplet at , and turned out to be a good indicator for cool companions, because it reveals even the presence of companions with a very low contribution to the total flux. In the spectra of five stars, though, only a rise in the continuum level at pointed towards a composite object. Altogether, 24 out of 77 sdB stars show signs of a cool companion. These objects are excluded from the following analysis, because their determined parameters cannot be considered reliable.
3 Results from spectral analysis
The determination of , , and was done by fitting simultaneously each hydrogen and helium line (except ) to synthetic model spectra, using a procedure by R. Napiwotzki (Napiwotzki et al. 1999) based on Saffer et al. (1994). See Edelmann et al. (2003) for a more detailed description. The final results were calculated as the mean value of the fit results from individual exposures of each star. For six objects, only one useful exposure was available.
The statistical 1--errors yielded by the fit procedure are typically lower than , , and for , , and , respectively. However, since the differences in the fit results of individual exposures of each star are mostly larger, we used the distribution of those differences for estimating the “true errors”, leading to , , .
3.1 Atmospheric Parameters

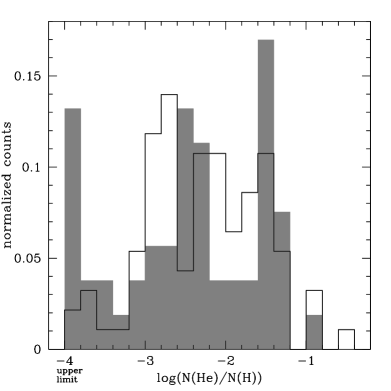
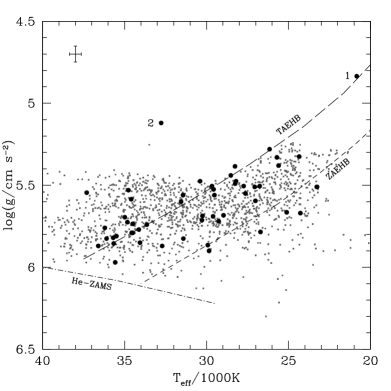
Figure 1 shows the position of our sdB stars in the --plane, along with the Zero-Age EHB and Terminal-Age EHB for solar metallicity (ZAEHB and TAEHB, Dorman et al. 1993) and the Zero-Age Main Sequence for pure helium stars (He-ZAMS, Paczyński 1971). Up to effective temperatures of , most of our stars lie on the so-called EHB strip (defined by ZAEHB and TAEHB), while for higher , almost all objects lie near the TAEHB or above it. This behaviour is reproduced in current theoretical calculations, as discussed in Sect. 4.
Our distribution of helium abundances (Fig. 2) shows a wide spread from to slightly supersolar helium abundance. Compared with the values from Edelmann et al. (2003) shown in Fig. 2, there is overall agreement, but we find a higher fraction of stars with very low helium abundances, lacking an explanation. Theoretical calculations of the photospheric helium content, which include mass loss rates of to , are able to explain values of (Fontaine & Chayer 1997; Unglaub & Bues 2001). In our data, 18 out of 53 stars (one third) have , clearly pointing towards higher mass loss rates in many cases or alternative (additional) physical mechanisms.
3.2 Peculiar Halpha profiles
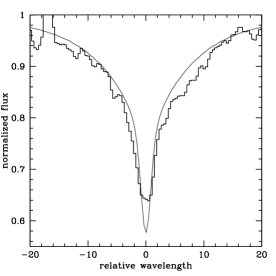
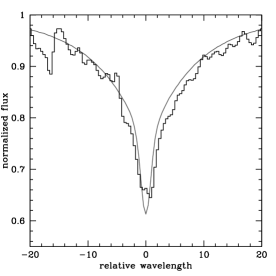
Five of our sdB stars show abnormal line core profiles (Fig. 3), having a lower depth than the model line core, being broader, and in two cases showing a faint emission. No significant variation is observed between the first and second exposure of the stars (time intervals range from to ), but slight changes cannot be excluded. All objects are amongst the hottest program stars with (Fig. 1), and four lie among the highest luminosity objects of the sample (the luminosity of the fifth sdB is about average). The helium abundances are in the normal range of .
Line broadening could possibly be caused by rotation. However, convolution of the synthetic spectra with rotational profiles does not lead to acceptable fits for any hydrogen or helium line. Even for itself, the match is still not satisfying, implying that other physical effects have to be the cause.
There is an obvious similarity to the findings of Heber et al. (2003), who observed such profiles in four high-luminosity sdB stars and suggested stellar winds to be the cause. Their profiles also show broadening around the core region, with the core being flattened in one case and containing emission in the other cases. As shown by Vink (2003, these proceedings), it is possible to reproduce the emission when calculating winds of . The broadening, however, is not accounted for, and still remains to be explained.
3.3 Comparison with other samples

SdB samples of comparable size were presented in the last decade by Saffer et al. (1994), Maxted et al. (2001), and Edelmann et al. (2003). They can best be compared to our sample by using their respective cumulative luminosity distribution, shown in Fig. 4. It can be seen that the SPY data agree well with the observations of Maxted et al. (2001) and Edelmann et al. (2003), whereas there is a larger average offset to the data of Saffer et al. (1994) (which has already been discussed in Edelmann et al. 2003). Different resolution, signal-to-noise ratio, homogeneity, and models used for line profile fitting can probably explain these moderate differences between the samples.
4 Observation versus Theory
In order to draw conclusions about potential sdB formation scenarios, we now compare our data with the simulations of Han et al. (2003), which aim to determine the relative importance of different sdB binary formation channels (stable Roche-lobe overflow channel, common envelope ejection channel, helium white dwarf merger channel). Several poorly known physical parameters, e.g. common envelope ejection efficiency, are varied in order to produce twelve simulation sets with different parameter configurations. Out of them, Han et al. (2003) determined a best-fit model by comparing periods and minimum companion masses for binary sdB stars with observations by Maxted et al. (2001) and Morales-Rueda et al. (2003). A comparison with our --data is interesting because of the homogeneity and high resolution of our sdB spectra, surpassing previous observational samples.
Before comparing theory and observation, one must consider observational selection effects, in the present case mainly due to main sequence (MS) companions, which either outshine the sdB and thus prevent its detection, or make its analysis unreliable. Han et al. (2003) apply this effect by excluding all systems with a MS companion having , which is matched by our exclusion of all composite spectra and therefore allows us to compare our data with the theoretical predictions.
Figure 5 shows our data along with the simulated sdB stars from the best-fit model of Han et al. (2003). The simulations match well the shape of our sdB distribution as well as the --area covered. One of our objects is a potential blue Horizontal Branch star (labeled “1” in Fig. 5) and is therefore not subject to a comparison with calculations for EHB stars. The object labeled “2” lies in a region where there is almost no simulated star. However, this object may be in a fast post-EHB phase of evolution (see also Fig. 1). As long as theory does not predict the formation of such an object to be impossible, it cannot be considered a disagreement with the simulations to observe one such star.
The positions of our stars at or above the TAEHB at higher temperatures are reproduced in the simulations, partially reflecting their prediction of masses in the range , as opposed to from single star evolutionary calculations (which define the ZAEHB and TAEHB shown in Fig. 5) . Note, however, that the latter predict some of the objects to be in the post-EHB stage (Dorman et al. 1993), which could probably explain the observed stars at high temperatures and luminosities above the TAEHB as well.
5 A subdwarf + subdwarf binary
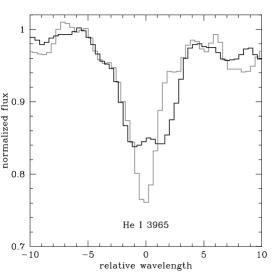
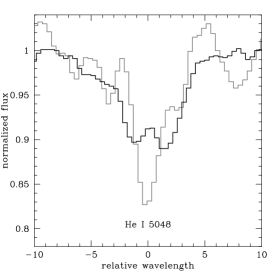
Figure 6 shows parts of two spectra of the helium-rich hot subdwarf HE 03013039, the time interval being months. The lines split into two apparently equal components, being obviously deeper when combined than when separated, the radial velocity difference being about for all lines. Hence HE 03013039 is a double-lined binary system consisting of two very similar hot subdwarfs. To our knowledge this is the first such system discovered. Further observations are scheduled to measure its radial velocity curve and system parameters.
6 Conclusions
We have reported on the spectral analysis of 77 sdB stars from SPY, as well as on the detection of the first known binary consisting of two hot subdwarfs. 24 sdB stars show signs of a cool companion. Of the 53 non-composite objects, five stars with relatively high luminosity show peculiar profiles, possibly indicating stellar winds. Our data are found to be in good agreement with previous studies of sdB stars. The best-fit model of the binary population synthesis calculations by Han et al. (2003) reproduces the observed sdB distribution very well. Note, however, that at this point no statement can be made as to the relative importance of single-star formation channels. A detailed comparison of our observations with all simulation sets of Han et al. (2003) will be presented in a forthcoming paper.
Acknowledgements.
We would like to thank Zhanwen Han for providing us with his simulation results, and Jorick S. Vink for valuable information on stellar winds.References
Dorman, B., Rood, R. T., & O’Connell, R. W. 1993, ApJ, 419, 596
Edelmann, H., Heber, U., Hagen, H.-J., et al. 2003, A&A, 400, 939
Fontaine, G. & Chayer, P. 1997, in The Third Conference on Faint Blue Stars, 169
Hagen, H.-J., Groote, D., Engels, D., & Reimers, D. 1995, A&AS, 111, 195
Han, Z., Podsiadlowski, P., Maxted, P. F. L., & Marsh, T. R. 2003, MNRAS, 341, 669
Heber, U., Maxted, P. F. L., Marsh, T. R., Knigge, C., & Drew, J. E. 2003, in ASP Conf. Ser. 288: Stellar Atmosphere Modeling, 251
Maxted, P. F. L., Heber, U., Marsh, T. R., & North, R. C. 2001, MNRAS, 326, 1391
McCook, G. P. & Sion, E. M. 1999, ApJS, 121, 1
Morales-Rueda, L., Maxted, P. F. L., Marsh, T. R., North, R. C., & Heber, U. 2003, MNRAS, 338, 752
Napiwotzki, R., Christlieb, N., Drechsel, H., et al. 2001, Astron. Nachr., 322, 411
Napiwotzki, R., Green, P. J., & Saffer, R. A. 1999, ApJ, 517, 399
Paczyński, B. 1971, Acta Astronomica, 21, 1
Saffer, R. A., Bergeron, P., Koester, D., & Liebert, J. 1994, ApJ, 432, 351
Unglaub, K. & Bues, I. 2001, A&A, 374, 570
Wisotzki, L., Koehler, T., Groote, D., & Reimers, D. 1996, A&AS, 115, 227