S1296-2147 \PITFLA \PXHY???? \Add? \Volume0 \Year2003 \FirstPage1 \LastPage?? \AuteurCourantJ.-Ch. Hamilton, A. Benoît and the Archeops Collaboration \TitreCourantArcheops results \Journal\RubriqueRubriqueHeading \SousRubriqueSous-rubriqueSub-Heading \PresenteParJean-Christophe HAMILTON, Alain BENOIT & the Archeops Collaboration \Recu \TitleOfDossierThe Cosmic Microwave Background
Archeops results
Archeops is a balloon–borne instrument dedicated to measuring cosmic microwave background (CMB) temperature anisotropies at high angular resolution ( 12 arcmin.) over a large fraction (30%) of the sky in the (sub)millimetre domain (from 143 to 545 GHz). We describe the results obtained during the last flight: the Archeops estimate of the CMB angular power spectrum linking for the first time Cobe scales and the first acoustic peak, consequences in terms of cosmological parementers favouring a flat- Universe. We also present the first measurement of galactic dust polarization and accurate maps of the galactic plane diffuse (sub) millimetre emisson.
Introduction
The Cosmic Microwave Background (CMB) gives many clues as to the origin of the Universe. It contains a wealth of diverse information, in contrast with the other 2 so–called pillars of Cosmology. The advent of BLIP (Background limited Performance) detectors (bolometers at 100 to 300 mK) and mostly sidelobe–free HEMT based interferometers has provided CMB maps with increasing accuracy and resolution in the last 10 years. The fluctuations that are now routinely detected in a few hours–days of integration time (e.g. [de Bernardis et al., 2000, Netterfield et al., 2002, Hanany et al., 2000, Lee et al., 2001, Prycke et al., 2002, Sievers et al., 2002, Rubiño-Martin et al., 2002]) provide vivid proof of the seeds that lead to large–scale structure formation. They are best analysed with spherical harmonic angular power spectrum as a function of multipole familiar to quantum physics. The generation of the power spectrum is now theoretically understood so that cosmological parameters can be deduced accurately. Archeops 111http://www.archeops.org is a CMB bolometer–based instrument with Planck – Hfi 222http://astro.estec.esa.nl/Planck technology that fills a niche where previous experiments were unable to provide strong constraints. Namely, Archeops seek to join the gap in between the large angular scales as measured by Cobe /Dmr and degree–scale experiments, typically for between 10 and 200. For that purpose, a large sky coverage is needed. The solution was to adopt a spinning payload mostly above the atmosphere, scanning the sky in circles with an elevation of around 41 degrees. The Earth’s rotation makes the circle span a large area of the sky.
In section 1 we will describe the instrument characteristics and the various flights, in section 2 the data analysis process. We will present the results concerning the CMB angular power spectrum in section 3 and the cosmological constraints in section 4. The Archeops diffuse galactic emission maps is presented in section 5 and the first detection of galactic dust polarization will be presented in section 6
1 Instrument and flights
The instrument [Benoît et al., 2002] was designed by adapting concepts put forward for Planck – Hfi and using balloon–borne constraints: namely, an open 3He–4He dilution cryostat cooling spiderweb–type bolometers at 100 mK, cold individual optics with horns at the different temperature stages (0.1, 1.6, 10 K) and the telescope. The Gregorian off–axis aluminum telescope is made of an effective 1.5 m aperture primary and a secondary ellipsoid mirror. The whole instrument is baffled so as to avoid stray radiation from the Earth and the balloon. The scan strategy imposes to observe by night. Maximising integration time means going above the Arctic circle. After a test flight in Trapani (Sicily) with four–hours integration time, the upgraded instrument was launched three times from the Esrange base near Kiruna (Sweden) by the CNES in the last 2 Winter seasons. The last and best flight on Feb. 7th, 2002 yields 12.5 hours of CMB–type data (at ceiling altitude and by night) from a 19–hours total. The balloon landed in Siberia and it was recovered (with its precious data recorded on–board) by a Franco–Russian team with –40 deg.C. weather.
2 Data analysis
The data are calibrated with the CMB dipole [Smoot et al., 1992], the FIRAS Galaxy and Jupiter (point–like) emission (beside yielding effective beams of typically 12 arcminute FWHM). The calibration error on the dipole is estimated as 4% (resp. 8%) at 143 (resp. 217 GHz). The other methods have calibration uncertainties of about 10 % and are consistent with the dipole calibration within less than 20 %. Eight detectors at 143 and 217 GHz are found to have a sensitivity better than 200 rms, in one second of integration corresponding to the stationary part of the noise. For a square pixel of 20 arcmin the average 1 sensitivity with all detectors combined per channel is 100 and 150 (0.04 and 0.06 MJy/sr) at resp. 143 and 217 GHz. It is 0.4 and 0.8 MJy/sr at 353 and 545 GHz. A large part of the data reduction was devoted to removing additional noises which come from the various thermal stages at frequencies , and atmospheric effects: an elevation systematic effect is seen below and the four frequencies are correlated between 0.1 and 1 Hz. These decorrelations in the timelines are mostly done for the low side of the power spectrum. The data are cleaned and calibrated, and the pointing is reconstructed from stellar sensor data [Benoît et al., 2003c].
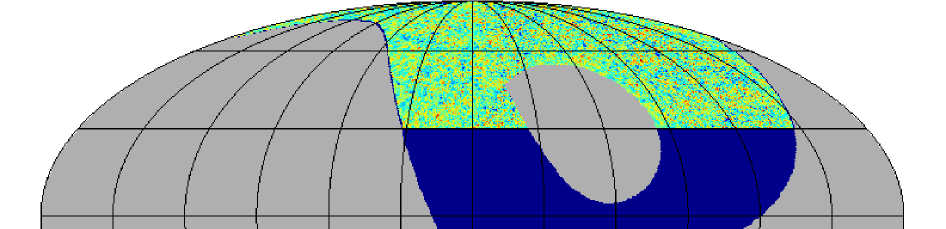
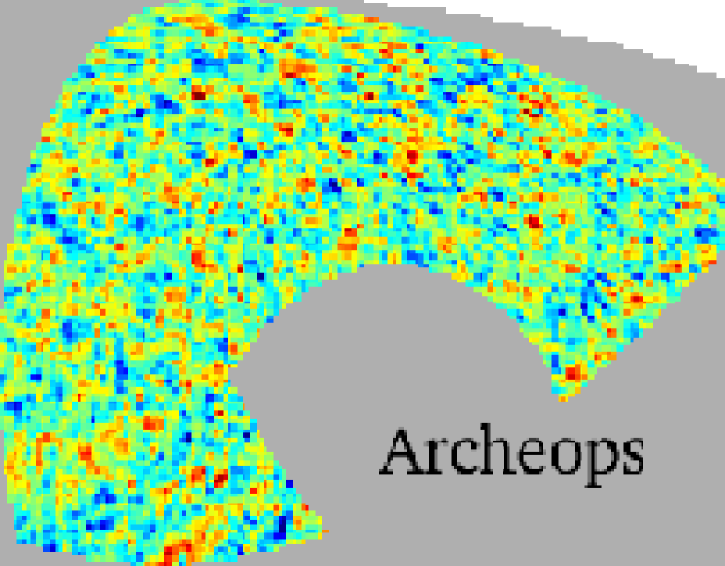
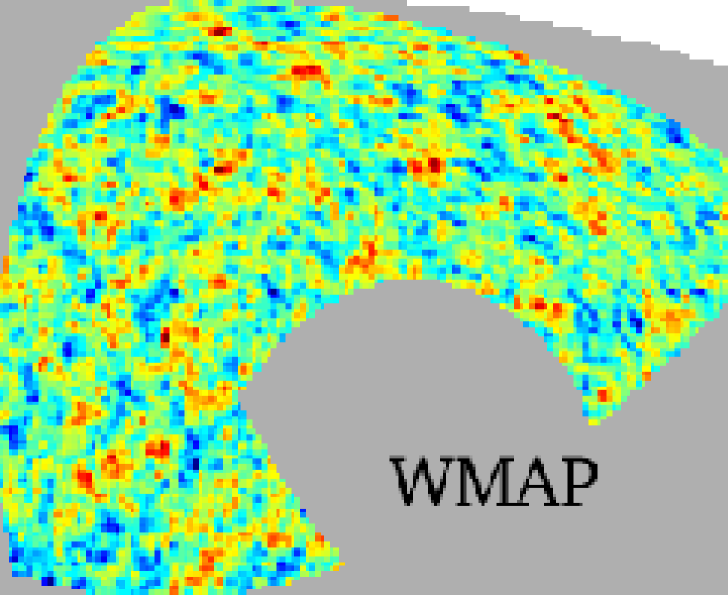
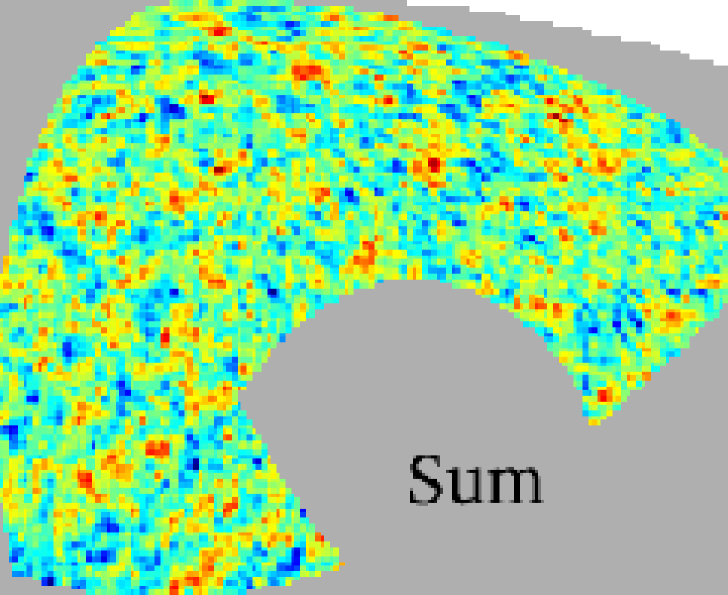
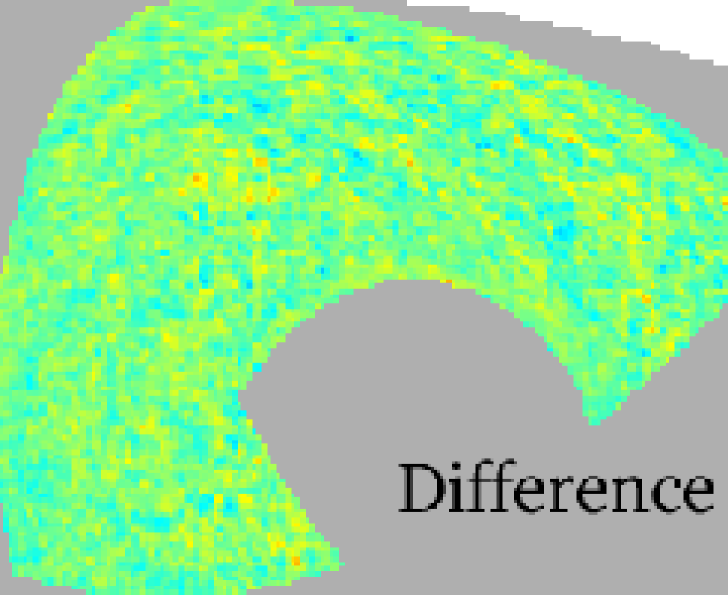

We then make CMB-designed maps in the cleanest region (from the Galactic foreground point of view) restricted to deg. giving a total of 13.7 arcmin. pixels (HEALPIX nside=256) covering 12.6% of the sky (see Fig. 1). The maps are obtained by coadding filtered data (bandpass between 0.3 and 45 Hz) avoiding ringing effects with a process described in [Amblard & Hamilton, 2003]. Residual ringing is estimated to be less than on the power spectrum in the first -bin and negligible for larger multipole. We then only keep maps of two best photometers, one at 143GHz and one at 217GHz which are coadded using a weighting ( being the noise RMS in each pixel). We apply the MASTER method [Hivon et al., 2002] to estimate the CMB power spectrum from these maps. The noise Fourier power spectrum is estimated from the time stream data using the algorithm described in [Amblard & Hamilton, 2003]. Our maps show structure on the sky at the degree angular scale that can be attributed to CMB anisotropies. A comparison of the anisotropies seen by Archeops and by WMAP is shown in Fig. 2.
3 Angular power spectrum results
The CMB anglar power spectrum is estimated in 16 bins ranging from to (see Fig. 3 for a comparison with a selection of other recent experiments and a best–fit theoretical model). Much attention was paid to the possible systematic effects that could affect the results. At low , dust contamination and at large , bolometer time constant and beam uncertainties are all found to be negligible with respect to statistical error bars. The sample variance at low and the photon noise at high are found to be a large fraction of the final Archeops error bars in Fig. 3. Various tests for systematic effects have been performed, such as Jack-knife tests and are described in [Benoît et al., 2003a].
| 15 | 22 | ||
| 22 | 35 | ||
| 35 | 45 | ||
| 45 | 60 | ||
| 60 | 80 | ||
| 80 | 95 | ||
| 95 | 110 | ||
| 110 | 125 | ||
| 125 | 145 | ||
| 145 | 165 | ||
| 165 | 185 | ||
| 185 | 210 | ||
| 210 | 240 | ||
| 240 | 275 | ||
| 275 | 310 | ||
| 310 | 350 | ||
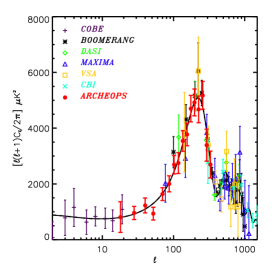
The first acoustic peak appears clearly from Archeops data itself. A Gaussian fit of the Archeops and the COBE data leads to a location of the peak at with a width and an amplitude K, compatible with previous determinations and achieving a better precision than earlier experiments, even combined together. One of the main goals of the experiment, i.e. to provide an accurate link between the large angular scales from Cobe and the first acoustic peak as measured by degree–scale experiments like Boomerang, Cbi, Dasi, Maxima, Vsa, has been achieved.
4 Cosmological constraints
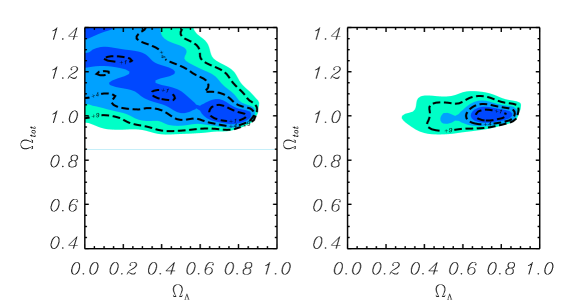
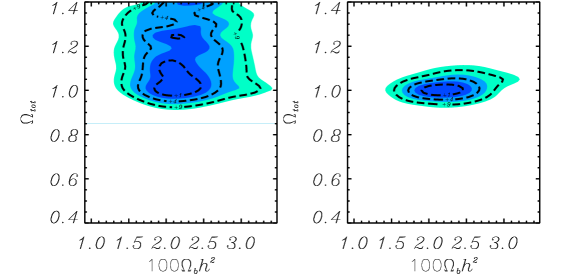
Cosmological constraints can be placed on adiabatic cold dark matter models with passive power-law initial fluctuations. Because Archeops power spectrum has small bins in and large coverage down to Cobe scales, it provides a precise determination of the first acoustic peak in terms of position at the multipole , height and width. Using a large grid of cosmological adiabatic inflationary models described by 7 parameters, one can compute their likelihood with respect to the datasets. An analysis of Archeops data in combination with other CMB datasets constrains the baryon content of the Universe to a value which is compatible with Big-Bang nucleosynthesis (O’Meara et al.2001)[O’Meara et al., 2001] and with a similar accuracy (Fig. 4). Using the recent HST determination of the Hubble constant [Freedman et al., 2001] leads to tight constraints on the total density, e.g. , i.e. the Universe is flat. An excellent absolute calibration consistency is found between Cobe, Archeops and other CMB experiments (Fig. 3). Finally, an analysis adding data from other CMB experiments (Cobe , Boomerang , Dasi , Maxima , Vsa and Cbi ), the HST prior and an additionnal prior on the value of (see [Douspis et al., 2003] for details) leads to tight constraints on the quintessence parameters: and (95% CL) comforting the flat- cosmological model.
All these measurements are fully compatible with inflation–motivated cosmological models. In particular, the best fit model shown in Fig. 3 is close to the mean likelihood Universe characterised by , , , , , , , obtained with Archeops and other CMB experiments and with the HST and priors. Moreover, the constraints shown in Fig. 4 (right), leading to a value of for the dark energy content, is independent from and in agreement with supernovæ measurements [Perlmutter et al., 2001] if a flat Universe is assumed.
5 Diffuse galactic plane emission maps
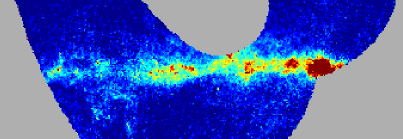
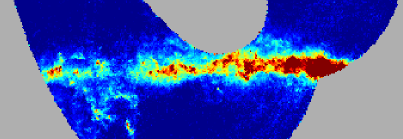
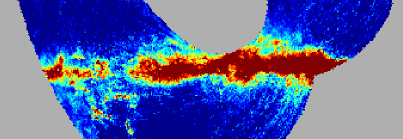
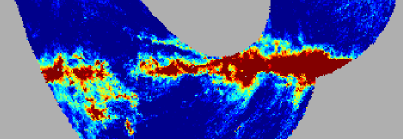
A specific data analysis pipeline has been designed to optimize the maps in the Galactic plane region. We use a destriping method that estimates the low frequency drifts by minimizing the cross-scan variations in the map and introduces a 2 highpass filter. The maps obtained by coadding all bolometers at each channel are shown in Fig. 5. These maps are the first Galactic plane high resolution maps at these frequencies on such a wide area of the sky. They show new dense bright regions, such as in the Taurus complex, on the lower–left part and also diffuse emission at large Galactic latitude.
6 Dust polarisation detection
The six 353 GHz Archeops channels are three Ortho Mode Transducers (hereafter OMT) [Bøifot et al., 1990, Chattopadhyay et al. 1999] composed by a pair of bolometers having a common entry horn, the light is separated in its two linear polarizations with a polarizer beam splitter, one polarization is transmitted to the first bolometer and the second one reflected to the second bolometer. The sum of two coupled bolometers measures the total intensity while their difference measures the Stokes parameters in the OMTs eigen basis. The three OMT are oriented at 60 degrees from each other following the recommendations of [Couchot et al. 1999] to optimize the polarization reconstruction. Details on the Archeops polarization experimental setup and data analysis will be found in [Benoît et al., 2003d].
A specific analysis pipeline is used for the polarisation analysis. Cross-calibration between two coupled channels is obtained by intercomparing the large signal coming from Galactic latitude profiles from different bolometers. Simulations show that the method leads to an accuracy on the cross-calibration better than 1% which is sufficient to measure galactic dust polarization in an unbiased way. The time stream data are filtered using a combination of the method described in [Amblard & Hamilton, 2003], used for the Archeops CMB analysis and wavelet shrinkage techniques [Macías–Pérez 2003]. This ensures that no ringing is created in the Galactic plane region. The filtered polarization channels are then combined to produce maps of , and with a pixel size of 27.5 arcmin. (HEALPIX nside=128). The maps are clipped to remove pixels containing less than 100 time samples corresponding to a noise level of . The maps are shown in Fig. 6 along with a map of the normalized squared polarized intensity . Twice this quantity is statistically distributed like a with 2 degrees of freedom. The 68, 95.4, 99.7% CL of the mapped quantity correspond to 1.1, 3.1, 5.8 respectively.
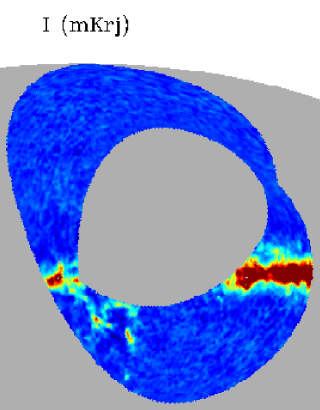
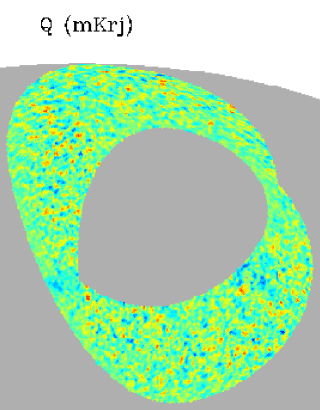
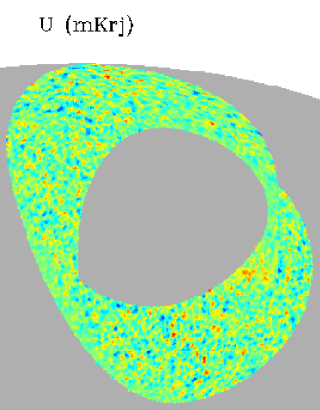
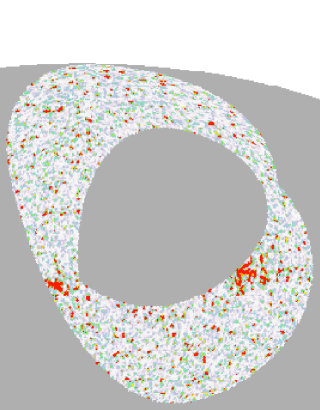
Seven polarized Galactic dense clouds are detected at the 3 level with sizes ranging from to deg2 and polarization degree ranging from % to %. The precise characteristics of these clouds are given in [Benoît et al., 2003d]. A search for diffuse galactic polarization shows significant (3 to 4) coherent polarization levels of a few percents in the Galactic plane, even after masking the dense clouds discussed above. The detected clouds appear to belong to two complexes, one in Cassiopeia that includes the CasA supernova remnant (the point source was however not projected in the maps), the other in the southern part of Gem OB1. The polarization orientation is found to be coherent between clouds and diffuse regions and nearly orthogonal to the Galactic plane. These results are in agreement with expectations from starlight polarization measurements [Fosalba et al. 2002], the presence of dense polarized regions provides evidence for a powerful grain alignement mechanism thoughout the interstellar medium [Hildebrand & Dragovan 1995] and a coherent magnetic field coplanar to the Galactic plane and following the spiral arms. Interestingly, the observed part of the Cygnus complex is not found to be significantly polarized. Projection effects along the line of sight of sight may explain the lack of detectable polarization from Cygnus region. Extrapolating these results to high Galactic latitude indicates that interstellar dust polarized emission is the major foreground for PLANCK-HFI CMB polarization measurements as suggested by [Prunet et al. 1998].
Conclusions
Constraints on various cosmological parameters (Beno t et al.2003b)[Benoît et al., 2003b] have been derived by using the Archeops data alone and in combination with other measurements. The measured power spectrum (Beno t et al.2003a)[Benoît et al., 2003a] matches the Cobe data and provides for the first time a direct link between the Sachs–Wolfe plateau and the first acoustic peak, because of the large sky coverage that greatly reduces the sample variance. The measured spectrum is in good agreement with that predicted by simple inflation models of scale–free adiabatic peturbations and a flat– Universe assumption. Finally let us note that these results were obtained with only half a day worth of data. Precise maps of the Galactic dust emission in the Galactic plane region have been obtained and show new sources and diffuse emission. Archeops also provides the first measurement of galactic dust polarization at 353 GHz showing dense polarized clouds and diffuse polarization. The coherence of the polarization direction suggests the presence of a coherent magnetic field coplanar to the Galactic plane.
Use of all available bolometers and of a larger sky fraction should yield an even more accurate and broader CMB power spectrum in the near future. The large experience gained on this balloon–borne experiment is providing a large feedback to the Planck – Hfi data processing community.
We pay tribute to Pierre Faucon, the manager of the CNES launching team in Kiruna, who was a key figure for the success of the experiment. We wish to thank ASI, CNES, and PNC for their continued support. Healpix package [Gorski et al., 1998] was used throughout this work.
References
- [Bøifot et al., 1990] Bøifot et al., 1990, Proc. Inst. Elect. Eng., 137, 396.
- [Amblard & Hamilton, 2003] Amblard, A. & Hamilton, J.-Ch., astro-ph/0307203, A&A., submitted.
- [Bennett et al., 2003] Bennett, C.L. et al., 2002 (astro-ph/0302207).
- [Benoît et al., 2002] Benoît, A. et al., 2002, Astropart. Phys. 17, 101-124 (astro-ph/0106152).
- [Benoît et al., 2003a] Benoît, A. et al., 2003a, A&A., 399, L19 (astro-ph/0210305).
- [Benoît et al., 2003b] Benoît, A. et al., 2003b, A&A., 399, L25, (astro-ph/0210306).
- [Benoît et al., 2003c] Benoît, A. et al., in prep.
- [Benoît et al., 2003d] Benoît, A. et al., astro-ph/0306222, A&A., submitted.
- [Chattopadhyay et al. 1999] Chattopadhyay. G. et al., 1999, IEEE microwave and guided wave lett., 9, 339.
- [Couchot et al. 1999] Couchot, F., Delabrouille, J., Kaplan, J., Revenu, B. et al., 1999, A&A SS, 135.
- [de Bernardis et al., 2000] de Bernardis, P. et al., 2000, Nature, 404, 995.
- [Douspis et al., 2003] Douspis, M. et al., A&A, 2003, 405, 409 (astro-ph/0212097).
- [Freedman et al., 2001] Freedman, W. L. et al., 2002, ApJ., 553, 47.
- [Fosalba et al. 2002] Fosalba, P. et al., 2002, ApJ, 564, 762
- [Gorski et al., 1998] Gorski, K. M. et al., 1998 astro-ph/9812350, http://www.eso.org/science/healpix.
- [Halverson et al., 2002] Halverson, N. W. et al., 2002, MNRAS, 568, 38.
- [Hanany et al., 2000] Hanany, S. et al., 2000, ApJ., 545, L5.
- [Hildebrand & Dragovan 1995] Hildebrand, R. H., Dragovan, M., 1995, ApJ, 450, 663.
- [Hivon et al., 2002] Hivon, E. et al., 2002, ApJ., 567, 2.
- [Lee et al., 2001] Lee, A. T. et al., 2001, ApJ., 561, L1-L6.
- [Macías–Pérez 2003] Macías–Pérez, J. F., 2003, in prep.
- [Netterfield et al., 2002] Netterfield, C. B. et al., 2002, ApJ., 571, 604.
- [O’Meara et al., 2001] O’Meara et al.., et al., 2001, ApJ., 552, 718.
- [Pearson et al., 2002] Pearson, T. J. et al., ApJ., submitted, astro-ph/0205388.
- [Perlmutter et al., 2001] Perlmutter, S. et al., 2001, ApJ., 517, 565.
- [Prunet et al. 1998] Prunet, S. et al., 1998, A. A,339, 187.
- [Prycke et al., 2002] Pryke, C. et al., 2002, ApJ., 568, 46.
- [Rubiño-Martin et al., 2002] Rubiño-Martin , J. A. et al., MNRAS, submitted, astro-ph/0205367.
- [Schlegel et al., 1998] Schlegel, D. J., Finkbeiner, D. P., & Davis, M., 1998, ApJ., 500, 525.
- [Scott et al., 2002] Scott, P. F. et al., astro-ph/0205380.
- [Sievers et al., 2002] Sievers, J. L. et al., ApJ., submitted, astro-ph/0205387.
- [Smoot et al., 1992] Smoot, G. et al., 1992, ApJ. Lett., 395, L1.
- [Tegmark et al., 1996] Tegmark, M., et al., 1996, ApJ. Lett., 464, L35.