An X-ray absorption analysis of the high-velocity system in NGC 1275
Abstract
We present an X-ray absorption analysis of the high-velocity system (HVS) in NGC 1275 using results from a deep 200 ks Chandra observation. We are able to describe the morphology of the HVS in more detail than ever before. We present an HST image for comparison, and note close correspondence between the deepest X-ray absorption and the optical absorption. A column density map of the HVS shows an average column density of with a range from to . From the map we calculate a total mass for the absorbing gas in the HVS of at solar abundance. 75 per cent of the absorbing mass is contained in the four regions of deepest absorption. We examine temperature maps produced by spectral fitting and find no direct evidence for shocked gas in the HVS. Using deprojection methods and the depth of the observed absorption, we are able to put a lower limit on the distance of the HVS from the nucleus of 57 kpc, showing that the HVS is quite separate from the body of NGC 1275.
keywords:
galaxies: clusters: individual: Abell 426 — galaxies: individual: NGC 1275 — galaxies: interactions — X-rays: galaxies1 Introduction
Optical imaging and spectroscopy first established the existence of two distinct emission line systems toward NGC 1275, the central cD galaxy of the Perseus cluster: a low-velocity component associated with the cD galaxy itself at 5200 and a high-velocity component at 8200 projected nearby on the sky (Minkowski 1955,1957). Since then, observations in H, radio, optical, and X-ray bands have revealed a web of H filaments surrounding and comoving with the cD galaxy (Lynds 1970; Heckman et al 1989) as well as absorption by the high-velocity system placing it in front of the cluster core (De Young, Roberts, Saslaw 1973; Rubin et al 1977; Kent Sargent 1979; Boroson 1990; Fabian et al 2000). The high-velocity system (HVS) is likely a galaxy falling into the Perseus cluster at 3000 ; however, the complexity of the NGC 1275 system has left many unanswered questions. In particular, the nature of the interaction between the infalling galaxy, the cD galaxy, and the H filaments is not well understood.
Early models of NGC 1275 describe two galaxies in the process of merging (Minkowski 1955, 1957). Support for this theory includes possible spatial correspondence between the low and high-velocity systems (Hu et al 1983; Unger et al 1990), gas at intermediate velocities between 5200 and 8200 (Ferruit et al 1997), and possible disruption and associated star formation in both the HVS and cD galaxy (Hu et al 1983; Unger et al 1990; Boroson 1990; Shields Filippenko 1990). However, all of these phenomena could potentially be explained by a previous interaction of the low and/or high-velocity system with a third gas-rich galaxy or system of galaxies (Holtzman et al 1992; Conselice, Gallagher, Wyse 2001), or by influences from the surrounding dense intracluster medium (ICM) (Fabian Nulsen 1977; Sarazin 1988; Boroson 1990; Caulet et al 1992).
The mass of the HVS is an important parameter that could help classify the galaxy as well as determine its history. Van Gorkom Ekers (1983) find an upper limit of on the HI mass of the galaxy that classifies it as type sC or earlier; but it has also been suggested that low mass content could be evidence of ram pressure stripping or a past interaction with another galaxy (Conselice et al 2001). Also, evidence of shocked gas would support the theory that the HVS is undergoing current interaction.
In addition to the mass of the HVS, its position relative to the cluster core still needs to be determined. Although it is accepted that the HVS lies in front of the cluster core, attempts to quantify the distance have resulted in various inconclusive estimates (van Gorkom Ekers 1983; Pedlar et al 1990; Fabian et al 2000). Because the NGC 1275 system consists of multiple, possibly interrelated components, a more accurate determination of the mass and position of the HVS would aid characterization of the entire system.
The hot ICM provides a background of X-rays for viewing the HVS in X-ray absorption. A previous 25 ks Chandra observation (Fabian et al 2000) yielded estimates for the average column density and total mass of the HVS. We now present results from a deep 200 ks Chandra observation which provides a more lucid picture of the HVS morphology and allows both column density and total mass to be more accurately determined. In addition, we use temperature mapping to search for shocked gas, and deprojection methods to place a lower limit on the distance of the HVS from the cluster core.
The Perseus cluster is at a redshift of 0.0183. We assume that , which gives a luminosity distance to the cluster of 80 Mpc and a scale of 1 kpc corresponds to about 2.7 arcsec.
2 Morphology
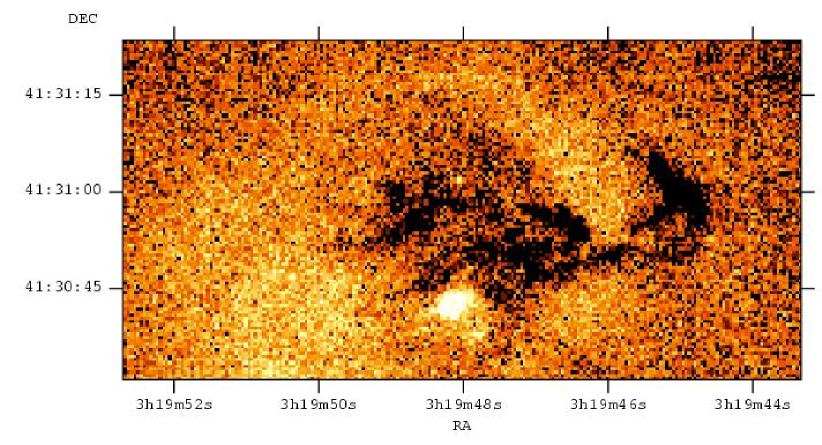
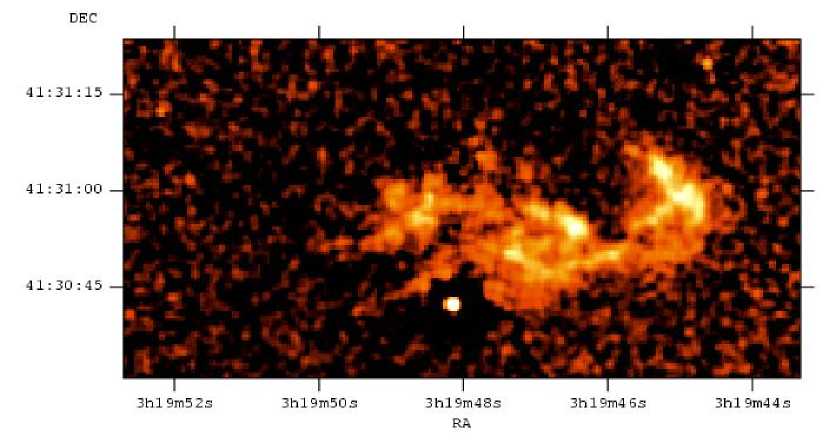
Fig. 1 shows a 1.77 by 0.89 arcmin section of the 200 ks X-ray image covering the energy range 0.5-1 keV. The high-velocity system can clearly be seen in absorption to the north of the bright NGC 1275 nucleus which is at RA 3 19 48, Dec +41 30 42 J2000. Projected behind the HVS are regions of low X-ray luminosity and surrounding bright rims associated with the radio lobes of the central source (Fabian et al 2000). At least 4 areas of deep absorption are clearly visible (one just to the east of the nucleus, two just to the west of the nucleus, and one further west at RA 45 sec).
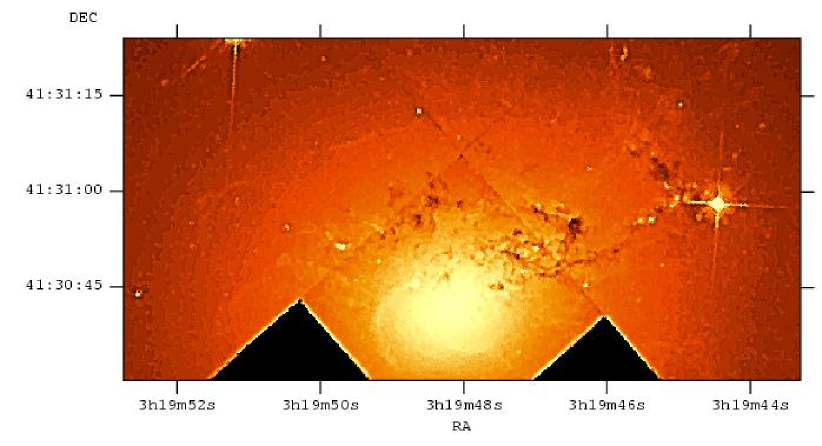
For comparison, an HST image of the same region (filter 702W, dataset u2pf0404b) is shown in Fig. 2 (the image has been unsharp masked in gimp111http://www.gimp.org/ to bring out the absorption features). We note close correspondence between the deep X-ray absorption features and the optical absorption features.
Also, the point source at RA 03 19 46.35 Dec +41 30 43.6 detected in the X-ray image (Fig. 1) is visible in the HST image, suggesting it may be associated with star clusters in the HVS. The point source at RA 03 19 48.06 Dec +41 31 01.9 detected in the X-ray image (Fig. 1) is not visible in the HST image.
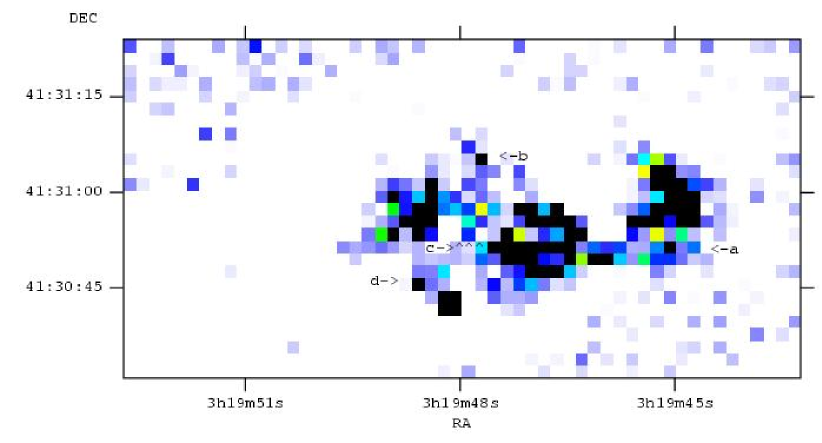
In addition to the regions of deep absorption, it is likely that weaker, more diffuse absorption is occurring between and around the deep absorption. However, it is difficult to discern this diffuse absorption in Fig. 1 due to the change in background brightness over the HVS. Fig. 3 shows the ratio of a soft (0.5-1 keV) and a hard (2-5 keV) X-ray image binned to a resolution of 1.96 arcsec (4 pixels). The regions of likely diffuse absorption are indicated a-d. These regions are marked by intermediate ratios between the lowest ratios, occurring at the positions of deep absorption, (dark) and the characteristic ratios everywhere else (light). Since it appears unlikely that variations of the ICM temperature, abundance, or galactic absorption could cause these features, we are confident that (a-d) are in fact regions of absorber in the HVS.
3 X-ray Spectral Analysis
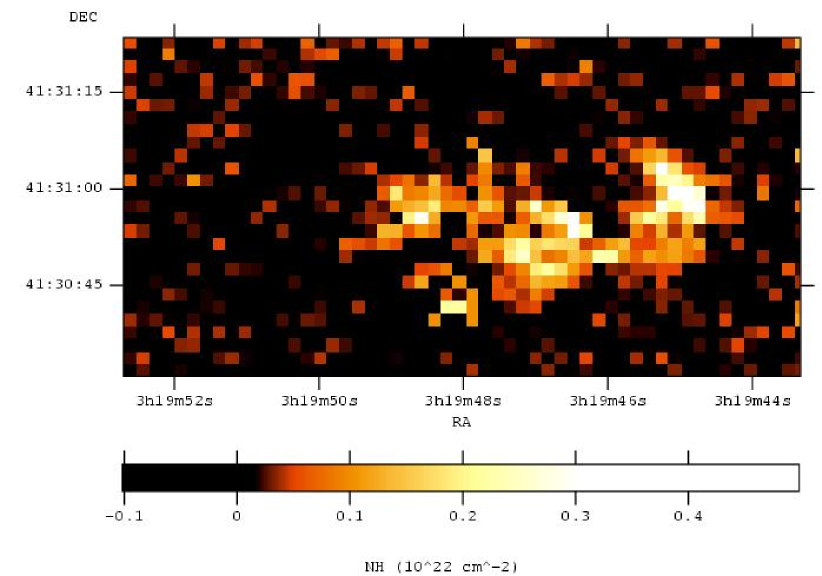
In order to quantify the absorption column density structure of the HVS, we fit spectra extracted from bins of several different spatial resolutions. First, the region seen in all previous figures was divided into a grid of 7.84 arcsec (16 pixel) square bins. Spectra were extracted from each of these bins and fit from 0.6-8 keV (this energy range assumed from hereon for all spectral fits) with a single temperature mekal spectral model (Mewe, Gronenschild van den Oord 1985; Liedahl, Osterheld Goldstein 1995) absorbed by a phabs model (Balucinska-Church McCammon 1992). Since the HVS lies at relatively low , the galactic and HVS absorption were both modelled by the single phabs component. The absorption column, temperature, and mekal abundance (assuming solar ratios of Anders Grevesse 1989) were left free for these fits. The mean reduced- of the fits was 1.1 and no significant residuals were seen at low energy. The image was then divided into a higher resolution grid of 1.96 arcsec (4 pixel) square bins. Spectra were again extracted and fit with a single temperature mekal model and phabs absorber, but this time the temperature and mekal abundance were fixed at the appropriate value obtained by fitting the low-resolution grid, thus leaving only the absorption column density and normalization as free parameters. The mean reduced- of the fits was 1.0. The rational behind this two-scale approach is that we expect the background temperature and abundance to vary on smaller scales than the absorber. The result of these fits yielded a map of the combined galactic and HVS . In order to isolate the HVS , we took the mean of a 30 by 50 arcsec region to the left of the HVS to be an indication of the galactic contributing to each bin, and subtracted this value from every bin over the entire region. The final results of the 1.96 arcsec resolution fits, with galactic subtracted, are seen as an HVS column density map in Fig. 4. The average of the HVS is about with a range from to . The 1 uncertainty in is for the lowest values, and for the highest values. Our previous conclusion that diffuse absorption is occurring between and around the regions of deep absorption is supported by the correspondence between Fig. 3 and Fig. 4. Summing the columns of gas leads to a total absorbing mass of at solar abundance. 75 per cent of the absorbing mass is contained in the four regions of deepest absorption.
We also fit spectra from a 0.49 arcsec square grid, minimizing statistics (Cash 1979) rather than due to the low number of counts per spectral bin. Fig. 5 shows the resulting column density map (including galactic and HVS), smoothed with a Gaussian of 1 pixel. Though the errors on these column densities are large, the smoothed image provides a qualitative illustration of the HVS column density structure.
The Chandra datasets used here are those presented in Fabian et al (2003), corrected for time-dependent gain shift using the corr_tgain utility (Vikhlinin 2003) and the corrgain2002-05-01.fits correction file. In all cases, a background spectrum generated from blank-sky observation was used, however the contribution of this background was insignificant. Response matrices and auxiliary responses based on the centre of the cluster were applied over the entire 1.77 by 0.89 arcmin region, and the auxiliary response files were corrected for low energy QE degradation222http://cxc.harvard.edu/cal/Links/Acis/acis/Cal_prods/qeDeg/ using the corrarf routine (Vikhlinin 2002) to apply the acisabs absorption correction (Chartas & Getman 2002). We found that using a contamarf correction333http://space.mit.edu/CXC/analysis/ACIS_Contam/script.html instead of a corrarf correction caused the values across the entire region to increase by . However, this difference can be incorporated into the subtraction of the galactic , thus the choice of correction does not affect the HVS . In the 7.84 arcsec and 1.96 arcsec fits, the spectra were binned to include a minimum of 20 counts per spectral bin. The spectra from the 0.49 arcsec grid were not binned due to low numbers of counts. On all column density maps, the circular region of radius about 5 arcsec centred on the NGC 1275 nucleus should be ignored.
By examining column density maps at several different spatial resolutions, we suspect that the of the HVS is likely varying on scales smaller than that resolved by the map at 1.96 arcsec resolution. If the bin from which the spectrum is extracted contains multiple absorption column density components, then the contribution to the spectrum from the less absorbed areas will dominate, causing the column density obtained from spectral fitting to be lower than the mean column density weighted by the covering fraction of each component. To quantify this effect we faked a spectrum with 2 mekal components of equal normalization, both with a temperature of 3 keV and an abundance of 0.6 solar. One of the components was phabs absorbed by a hydrogen column density of and the other by a hydrogen column density of . We fit the faked spectrum with a single temperature mekal spectral model and phabs absorber. The best fit column density was within uncertainties, independent of S/N, rather than the mean of . As a result of this effect, the absorbing mass calculated from the 1.96 arcsec column density map is likely to be a lower limit on the true value. A further systematic uncertainty derives from the abundance of the gas. The main absorber in the HVS is likely to be oxygen and and the total absorbing mass both depend on the HVS metal abundance. The phabs model assumes solar abundance to calculate , and we assumed solar abundance to calculate the total absorbing mass. Therefore, if the metal abundance is less than solar, the and total absorbing mass will be greater than that found above, and vice versa if greater than solar.
In order to search for high temperature shocked gas, we also fit the 7.84 arcsec resolution grid with 2 mekal temperature components. The mekal abundances were left free and tied, and a single phabs absorber was applied. A comparison of the two temperature maps obtained from these fits shows no indication of high temperature gas associated spatially with the HVS. Based on this fairly simple approach, we see no direct evidence for shocked gas in the HVS. For a more quantitative approach we have set the upper temperature in these two-temperature spectral fits to the likely shock temperature of 11 keV. We then find the emission integral of hot gas where is the length of the shock region along the line of sight, to be less than about cm-5. If is comparable to the size of the HVS of about 10 kpc and the density jump is the strong shock value of 4, then the preshock intracluster medium must then have a density less than about 0.025 cm-3. From the density profile given in Fabian et al (2003), this corresponds to a radius greater than 25 kpc from the nucleus of NGC 1275.
4 Distance of HVS from the nucleus of NGC 1275
We have above given an estimate of the minimum distance of the HVS from NGC 1275 based on the lack of high temperature emission from shocked gas. We now obtain a tighter constraint from the depth of the absorption seen. The closer that the HVS is to the nucleus the more the absorption will be filled in by emission from intervening cluster gas.
We measured an average count rate of 0.25 counts/pixel (each pixel 0.49 arcsec square) in the 0.4-0.7 keV band over the 5 by 5 pixel region of deepest absorption. We also note that there are regions of 3 by 3 pixels with zero counts. Since some or all of these counts may be transmitted from behind the HVS, we use the rate of 0.25 counts/pixel to place a lower limit on the distance of the HVS from the cluster core, assumed here to be the point source 3C 84.
Using a region from 120 deg to 60 deg measured clockwise from the east-west line through the cluster core, we created a surface brightness profile, (), of the ICM emission where is the projected radial distance from the cluster core in the plane of the sky. We then fit the profile, for arcsec, with a power law. Assuming the emissivity, () where is the radial distance from the cluster core, is also a power law and that the surface brightness and emissivity are related by
| (1) |
where is the position along the line of sight and , we determined () from (1)
| (2) |
Let the distance from the HVS to the cluster core be L. Assuming L, then () . We know that the integral of with respect to from L to infinity cannot exceed 0.25 counts/pixel. Solving the inequality for L yields a lower limit on the distance of the HVS from the cluster core of 153 arcsec or 57 kpc.
This limit would be complicated if the HVS is falling exactly along our line of sight so we are viewing it along a wake of shocked gas. A detailed numerical computation is required to model this situation but we doubt that it would make a large difference to the above result.
The column density in the hot gas lying from 60 to 10 kpc is about cm-21. This is similar to the highest column densities in the HVS, so most of the gas will be stripped before reaching NGC 1275.
5 Summary and Conclusions
We note close correspondence between the morphology of the HVS depicted in X-ray absorption, optical absorption, and column density maps. The most dominant features of the HVS are 4 high column density regions of deep absorption surrounded by patches of more diffuse material. By fitting spectra extracted from bins of several different spatial resolutions, we were able to obtain a 1.96 arcsec resolution map of the HVS column density. From this map we calculate a total absorbing mass for the gas in the HVS of at least at solar abundance. This is below the HI upper limit of van Gorkom and Ekers (1983). We have analyzed temperature maps also produced from spectral fitting and found no direct evidence for shocked gas in the HVS. Finally, using the average count rate in the regions of deepest absorption, we were able to put a lower limit on the distance of the HVS from the cluster core of 57 kpc. The mass in combination with the lack of obvious shocked gas and the distance of the HVS from the cluster core support the theory that the low and high-velocity systems are not interacting. Since the HVS appears to be falling into the Perseus cluster at 3000 , any merger or collision with NGC 1275 is still in its future.
Acknowledgements
KG thanks the Boettcher Foundation for their support, and Adrian Turner, Lisa Voigt, and Matthew Worsley for all of their help. ACF thanks the Royal Society for their support.
The HST data presented in this paper were obtained from the Multimission Archive at the Space Telescope Science Institute (MAST). STScI is operated by the Association of Universities for Research in Astronomy, Inc., under NASA contract NAS5-26555.
References
- [1] Anders E., Grevesse N., 1989, Geochimica et Cosmochimica Acta, 53, 197
- [2] Balucinska-Church M., McCammon D., 1992, ApJ, 400, 699
- [3] Boroson T.A., 1990, ApJ, 360, 465
- [4] Cash W., 1979, ApJ, 228, 939
- [5] Caulet A., Woodgate B.E., Brown L.W., Gull T.R., Hintzen P., Lowenthal J.D., Oliversen R.J., Ziegler M.M., 1992, ApJ, 388, 301
- [6] Chartas G., Getman K., 2002, http://www.astro.psu.edu/users/chartas/xcontdir/xcont.html
- [7] Conselice C.J., Gallagher J.S., Wyse R.F.G., 2001, AJ, 122, 2281
- [8] De Young D.S., Roberts M.S., Saslaw W.C., 1973, ApJ, 185, 809
- [9] Fabian A.C., Nulsen P.E.J., 1977, MNRAS, 180, 479
- [10] Fabian A.C. et al., 2000, MNRAS, 318, L65
- [11] Fabian A.C., Sanders J.S., Allen S.W., Crawford C.S., Iwasawa K., Johnstone R.M., Schmidt R.W., Taylor G.B., 2003, MNRAS, in press
- [12] Ferruit P., Adam G., Binette L., Pecontal E., 1997, NewA, 2, 345
- [13] Heckman T.M., Baum S.A., van Breugel W.J.M., McCarthy P., 1989, ApJ, 338, 48
- [14] Holtzman J.A. et al., 1992, AJ, 103, 691
- [15] Hu E.M., Cowie L.I., Kaaret P., Jenkins E.B., York D.G., Roesler F.L., 1983, ApJ, 275, L27
- [16] Kent, S.M., Sargent W.L.W., 1979, 230, 667
- [17] Liedahl D.A., Osterheld A.L., Goldstein W.H., 1995, ApJ, 438, L115
- [18] Lynds C.R., 1970, ApJ, 159, L151
- [19] Mewe R., Gronenschild E.H.B.M., van den Oord G.H.J., 1985, A&AS, 62, 197
- [20] Minkowski R., 1955, Carnegie Yearbook, 54, 25
- [21] Minkowski R., 1957, IAU Sympn 4, p107
- [22] Pedlar A., Ghataure H.S., Davies R.D., Harrison B.A., Perley R., Crane P.C., Unger S.W., 1990, MNRAS, 246, 477
- [23] Rubin V.C., Ford K., Peterson C.J., Oort J.H., 1977, ApJ, 211, 693
- [24] Sarazin C.L., 1988, X-Ray Emissions from Clusters of Galaxies (Cambridge: Cambridge Univ. Press)
- [25] Shields J.C., Filippenko A.V., 1990, ApJ, 353, L7
- [26] Unger S.W., Taylor K., Pedlar A., Ghataure H.S., Penston M.V., Robinson A., 1990, MNRAS, 242, 33P
- [27] van Gorkom J.H., Ekers R.D., 1983, ApJ, 267, 528
- [28] Vikhlinin A., 2002, http://hea-www.harvard.edu/alexey/corrarf/
- [29] Vikhlinin A., 2003, http://asc.harvard.edu/cont-soft/software/corr_tgain.1.0.html