Properties of galaxy dark matter halos from weak lensing
Abstract
We present the results of a study of the average mass profile around galaxies using weak gravitational lensing. We use 45.5 deg2 of band imaging data from the Red-Sequence Cluster Survey (RCS) and define a sample of lenses with , and a sample of background galaxies with .
We constrain the power law scaling relations between the -band luminosity and the mass and size of the halo, and find that the results are in excellent agreement with observed luminosity-line-width relations. Under the assumption that the luminosity does not evolve with redshift, the best fit NFW model yields a mass and a scale radius kpc for a galaxy with a fiducial luminosity of . The latter result is in excellent agreement with predictions from numerical simulations for a halo of this mass. We also observe a signficant anisotropy of the lensing signal around the lenses, implying that the halos are flattened and aligned with the light distribution. We find an average (projected) halo ellipticity of , in fair agreement with results from numerical simulations of CDM. Alternative theories of gravity (without dark matter) predict an isotropic lensing signal, which is excluded with 99.5% confidence. Hence, our results provide strong support for the existence of dark matter.
Canadian Institute for Theoretical Astrophysics, University of Toronto, 60 St. George Street, M5S 3H8, Toronto, Canada
Department of Astronomy and Astrophysics, University of Toronto, 60 St. George Street, M5S 3H8, Toronto, Canada
Observatories of the Carnegie Institution of Washington, 813 Santa Barbara Street, Pasadena, CA 91101
1. Introduction
The existence of massive dark matter halos around galaxies is widely accepted, based on different lines of evidence, such as flat rotation curves of spiral galaxies and strong lensing systems. However, relatively little is known about the properties of dark matter halos, such as their extent and shapes.
A promising approach to study the galaxy dark matter halos is weak gravitational lensing. The tidal gravitational field of the dark matter halo introduces small coherent distortions in the images of distant background galaxies. The weak lensing signal can be measured out to large projected distances from the lens, and hence provides a unique probe of the gravitational potential on large scales. The applications of this approach are numerous: one can infer masses of galaxies and compare the results to their luminosities (e.g., McKay et al. 2001), or one can attempt to constrain the halo mass profile (e.g., Fischer et al. 2000; McKay et al. 2001). Also, weak lensing can be used to constrain the shapes of halos by measuring the azimuthal variation of the lensing signal.
Unfortunately, one can only study ensemble averaged properties, because the weak lensing signal induced by an individual galaxy is too low to be detected. Nevertheless, as we will show here, weak lensing is a useful probe of the matter distribution in galaxies, and we expect it to make significant contributions to our understanding of galaxy formation in the coming years.
In these proceedings we highlight the main results from our weak lensing analysis. A detailed description of our results can be found in Hoekstra, Yee, & Gladders (2003).
2. Data & Analysis
We use 45.5 deg2 of -band imaging data from the Red-Sequence Cluster Survey (e.g., Yee & Gladders 2001), which were taken with the CFH12k camera on the CFHT. A detailed description of the data reduction and object analysis can be found in Hoekstra et al. (2002), to which we refer for technical details.
For the analysis presented here, we select a sample of “lenses” and “sources” on the basis of their apparent magnitude. We define galaxies with as lenses, and galaxies with as sources which are used to measure the lensing signal. This selection yields a sample of lenses and sources.
The interpretation of the weak lensing signal (e.g., inferring sizes and masses for the galaxy halos), requires knowledge of the redshift distributions of both lenses and sources. The redshift distribution of the sample of lenses has been determined spectroscopically by the CNOC2 Field Galaxy Redshift Survey (e.g., Yee et al. 2000). The derived redshift distribution gives a median redshift for the lens sample. We use the redshifts and the colors of the galaxies observed in the CNOC2 survey to compute their rest-frame luminosity. For the source galaxies the situation is more complicated. These galaxies are generally too faint for spectroscopic surveys. Instead we use the photometric redshift distributions derived from both Hubble Deep Fields, which yields a median redshift of for the source galaxies.
Weak lensing measures the convolution of the galaxy distribution and the galaxy dark matter profiles. To examine the ensemble average properties of the dark matter halos properly, we need to account for the clustering of the lenses. This is done naturally in a maximum likelihood analysis, where a model for the mass distribution of individual galaxies is compared to the observations. We use the profile predicted by cold dark matter simulations (e.g., Navarro, Frenk, & White 1995, NFW hereafter). The NFW density profile is characterized by two parameters, a density contrast and a scale
| (1) |
where is the critical surface density at the redshift of the halo. The “virial” radius is defined as the radius where the mass density of the halo is equal to . The virial mass is defined as the mass enclosed within , with a corresponding rotation velocity .
In these proceedings we compare the NFW profile to the observations, with (or equivalently ) and as free parameters. Hoekstra et al. (2003) also consider a truncated isothermal sphere (TIS) model.
To infer the best estimates for the model parameters, one formally has to perform a maximum likelihood analysis in which the redshift of each individual galaxy is a free parameter, which has to be chosen such that it maximizes the likelihood. This approach is computationally not feasible, and instead we create mock redshift catalogs, using the observed redshift distributions from the CNOC2 survey (see Hoekstra et al. 2003 for details), which allows us to find estimates for the model parameters, close to the true maximum likelihood values.

3. Scaling relations
We first examine how the model parameters and scale with luminosity. We assume that the scaling relations have a power law dependence on the restframe -band luminosity:
| (2) |
Currently we use the apparent -band magnitude as a crude measure of the luminosity. With upcoming multi-color data, we expect to significantly improve on our measurements. To derive joint constraints on and , we marginalise over the values for and . It is more convenient to constrain and , and the results are presented in Figure 1.
Figure 1 shows that the sum is fairly well constrained. We obtain a best fit value of (68% confidence). For we find . Also the relation between the maximum rotation velocity and the luminosity is well described by a power law, with an exponent (68% confidence) in good agreement with the observed slope of the Tully-Fisher relation (e.g., Verheijen 2001).
4. Mass and extent of halos
Many different lines of evidence suggest that galaxies are surrounded by massive dark matter halos, but observationally it is difficult to place constraints on the mass and extent of these halos, because of the lack of visible tracers that can be used to infer the gravitational potential. Weak gravitational lensing does not suffer from the latter requirement and consequently provides one of the most powerful measures of the mass distribution at large radii. With the current data it is not possible to distinguish between different mass profiles (as mentioned above we use the NFW profile), but for a given model, we can examine the masses and sizes of the halos.
Figure 2 shows the joint constraints on (the corresponding values for are indicated on the right) and for a galaxy with a luminosity of (under the assumption that the luminosity does not evolve with redshift). The mass is well constrained and we find a best fit value of km/s or (68% confidence). For the scale we find kpc (68% confidence).
In our maximum likelihood analysis we considered and free parameters. Numerical simulations, however, show that the parameters in the NFW model are correlated, albeit with some scatter. As a result, the NFW model can be considered as a one-parameter model. The dotted line in Figure 2 indicates this prediction. If the simulations provide a good description of dark matter halos, the dotted line should intersect our confidence region, which it does.
This result provides important support for the CDM paradigm, as the latter predicts a “size” of dark matter halos which is in excellent agreement with our observations. It is important to note that this analysis is a direct test of CDM (albeit not conclusive), because the weak lensing results are inferred from the gravitational potential at large distances from the galaxy center, where dark matter dominates. Most other attempts to test CDM are confined to the inner regions, where baryons are, or might be, important.

5. Shapes of halos
The average shape of dark matter halos can provide important information about the nature of dark matter. Numerical simulations of cold dark matter yield triaxial halos, with a typical ellipticity of (e.g., Dubinski & Carlberg 1991). Hence, in the context of collisionless cold dark matter, the theoretical evidence for flattened halos is quite strong. If the dark matter is interacting, it tends to produce halos that are more spherical (compared to cold dark matter). This difference is more pronounced in the central parts of the halo, where the density is high. On the large scales probed by weak lensing, the different types of dark matter (for reasonable interaction cross-sections) produce halos with similar shapes.
Weak gravitational lensing is potentially the most powerful way to derive constraints on the shapes of dark matter halos. The amount of data required for such a measurement, however, is large: the galaxy-galaxy lensing signal is small, and now one needs to measure an even smaller azimuthal variation. We also have to assume that halo is aligned with the galaxy. An imperfect alignment between light and halo will reduce the amplitude of the azimuthal variation detectable in the weak lensing analysis. Hence, weak lensing formally provides a lower limit to the average halo ellipticity.
To maximize the signal-to-noise ratio of the measurement one has to assign proper weights to the lenses: edge-on galaxies have maximal weight, whereas the lensing signal around face-on galaxies contains no information about the shape of the halo. We adopt a simple approach, and assume that the (projected) ellipticity of the dark matter halo is proportional to the shape of the galaxy: .
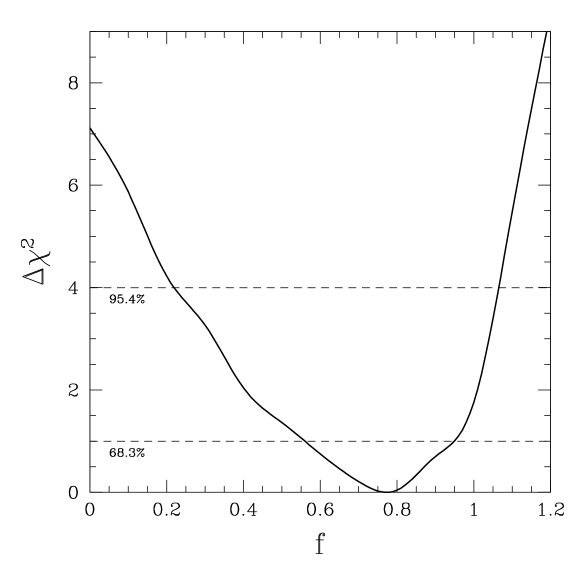
As before, we compute the model shear field, and compare this to the data. Figure 3 shows the resulting as a function of . We find a best fit value of (68% confidence). This suggests that, on average, the dark matter distribution is rounder than the light distribution. As discussed above, our analysis formally provides only a lower limit on the halo ellipticity, and the true ellipticity might be higher if some of the halos are misaligned with the light. Nevertheless, the fact that we detect a significant flattening implies that the halos are well aligned with the light distribution. Also note that the lensing signal is caused by a range of different galaxy types, for which our simple relation between the halo ellipticity and light distribution might not be valid.
A simple interpretation of the results is difficult, but a simple approach actually yields sensible results. For instance, the average ellipticity of the lens galaxies is . Hence, the measured value of implies an average projected halo ellipticity of (68% confidence), which corresponds to an projected axis ratio of (68% confidence). Although the weak lensing yields a projected axis ratio, the result is in fair agreement with the results from numerical simulations.
A robust outcome of our analysis is that spherical halos () are excluded with 99.5% confidence. This result poses a serious problem for alternative theories of gravity, which attempt to explain the observations without the need of dark matter. In such theories the lensing signal we measure is effectively caused by point masses (the visible matter is confined to much smaller scales). As a result, in such theories one would expect an almost isotropic lensing signal around the galaxies (even if the quadrupole decreases as slow as , e.g., Binney this proceedings), which is not observed. Note that this test does not require knowledge of the actual deflection angles, which typically are unknown for these theories. Hence, our results provide strong support for the existence of dark matter.
References
Dubinski, J. & Carlberg, R.G. 1991, ApJ, 378, 496
Fischer, P., et al. 2000, AJ, 120, 1198
Hoekstra, H., Yee, H.K.C., Gladders, M.D., Barrientos, L.F., Hall, P.B., & Infante, L. 2002, ApJ, 572, 55
Hoekstra, H., Yee, H.K.C, & Gladders 2003, ApJ, submitted, astro-ph/0306515
McKay, T.A., et al. 2001, ApJ, submitted, astro-ph/0108013
Navarro, J.F., Frenk, C.S., & White, S.D.M. 1995, MNRAS, 275, 56
Verheijen, M.A.W. 2001, ApJ, 563, 694
Yee, H.K.C., et al. 2000, ApJS, 129, 475
Yee, H.K.C., & Gladders, M.D. 2001, in “AMiBA 2001: High-z Clusters, Missing Baryons, and CMB Polarization”, ASP Conference Series, Eds. L.-W. Chen et al., astro-ph/0111431