Radio Identification of the X-ray Jet in the z=4.3 Quasar GB 1508+5714
Abstract
The recent discovery of an X-ray jet in the z=4.3 quasar GB 1508+5714 by Yuan et al. (astro-ph/0309318) and Siemiginowska et al. (astro-ph/0310241) prompted a search for its radio counterpart. Here, we report the successful discovery of faint radio emission from the jet at 1.4 GHz using archival VLA data. The X-ray emission is best interpreted as inverse Compton (IC) emission off the CMB as discussed by the previous investigators. In this scenario, its high X-ray to radio monochromatic luminosity ratio, compared to previously detected IC/CMB X-ray jets at lower redshift, is a natural consequence of its high redshift.
ApJL, accepted
1 Background
Since its launch in 1999, the Chandra X-ray Observatory has been used to detect a large number of X-ray jets in Active Galactic Nuclei (AGN), where prominent radio jets were previously known to exist (see e.g., Harris & Krawczynski, 2002, and associated website111http://hea-www.harvard.edu/XJET/). The recent report (Yuan et al., 2003; Siemiginowska et al., 2003b) of an extended X-ray jet originating from the z=4.3 quasar GB 1508+5714, where previous observations showed no obvious sign of extended radio emission, presents an interesting case. The X-ray feature is strong – well over 100 counts were detected from it in the 90 ksec Chandra exposure. An archival HST image helps rule out the possibility that it is due to a foreground galaxy or a gravitationally lensed image of the quasar (Siemiginowska et al., 2003b). Based on deep X-ray source counts, it has a low probability of being a random unassociated X-ray field source.
As discussed by the previous authors, such detections of X-ray jets at large redshifts are actually to be expected as a natural consequence of the inverse Compton (IC) off the CMB model (e.g., Tavecchio et al., 2000; Celotti, Ghisellini, & Chiaberge, 2001). This is because the (1+z)4 dependence of the CMB energy density compensates for cosmological dimming of radiation, so that IC/CMB X-ray jets should remain detectable out to large cosmological distances (Schwartz, 2002a). The model has been successfully applied to account for X-ray jets in many other powerful quasars at more modest redshifts (e.g., Sambruna et al., 2002), requiring that the jets are still highly relativistic on kilo-parsec scales, in order that the electrons in the jet frame see an adequately boosted photon source. However, the lack of a detection of the GB 1508+5714 jet at lower frequencies, along with only a rough constraint on the X-ray spectrum, could not rule out a synchrotron origin for the X-rays (Siemiginowska et al., 2003b). A previous search in the radio for a proposed X-ray jet in another high redshift (z=5.99) quasar, SDSS 1306+0356 (Schwartz, 2002b), yielded only an upper limit of 0.1 mJy at 1.4 GHz (Petric et al., 2003; Schwartz, Cheung, & Wardle, 2003).
Distinguishing between the two possible emission processes is important, as they probe different energetic phenomena. In the case of synchrotron X-ray emission, the X-rays mark sites of particle acceleration with electrons accelerated up to with very short lifetimes (e.g. M87; Harris et al., 2003). When considered together with minimum energy/equipartition conditions, the IC/CMB model offers important constraints on the beaming, magnetic field, and jet power (Tavecchio et al., 2000; Celotti, Ghisellini, & Chiaberge, 2001).
Both the IC and synchrotron interpretations of X-ray jet emission usually require a population of relativistic electrons emitting synchrotron radiation at lower (radio) frequencies. Based on the X-ray flux and spectrum, the two models give different predictions of the radio component flux and spectrum. Here, we report the detection of such a radio component coincident with the X-ray feature extending from GB 1508+5714 from an analysis of archival VLA data. This supports its interpretation as an X-ray jet and we discuss the X-ray emission in the context of the new 1.4 GHz detection, along with the previously set optical, and a new 8.4 GHz limit. Following Yuan et al. (2003) and Siemiginowska et al. (2003b), Hkm s-1 Mpc-1, and (Spergel et al., 2003) are assumed throughout, so 1″ = 6.871 kpc.
2 Archival Radio Observations
Two datasets which utilized the VLA in its highest resolution A-configuration were obtained from the NRAO222The National Radio Astronomy Observatory is a facility of the National Science Foundation operated under cooperative agreement by Associated Universities, Inc. archive. The data were calibrated in the NRAO AIPS package (Bridle & Greisen, 1994) and brought into DIFMAP (Shepherd, Pearson, & Taylor, 1994) for editing, self-calibration, and imaging. The flux density scale was set on the VLA 1999.2 scale using scans of 3C 286 as outlined in the VLA Calibrator Manual (Perley & Taylor, 2003).
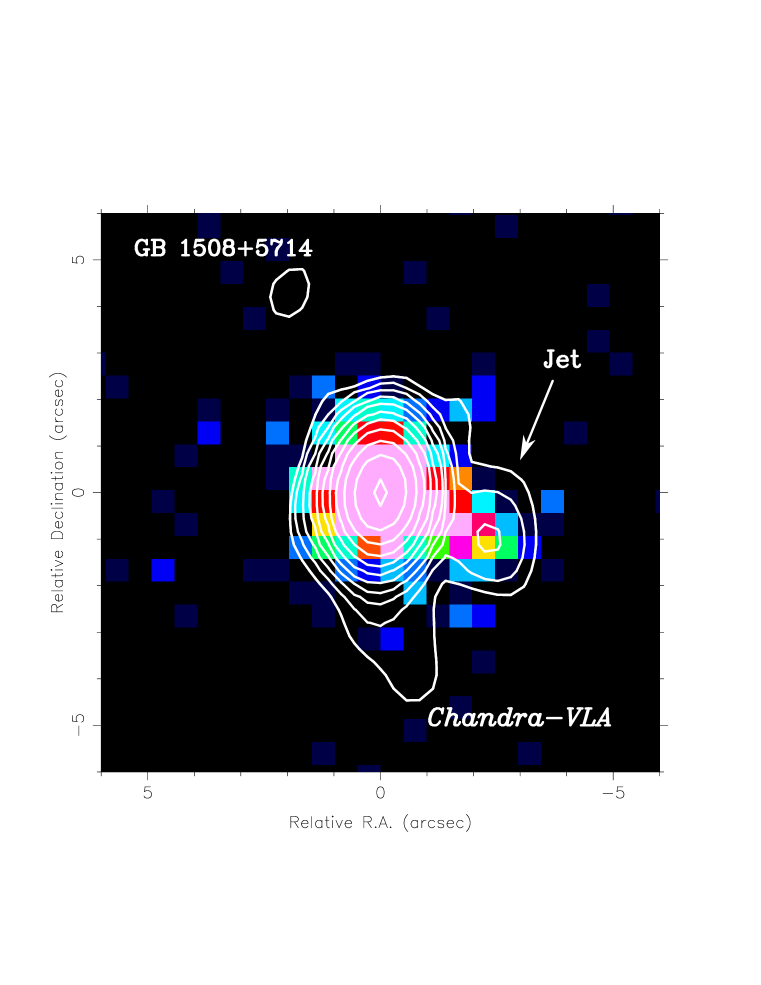
The 1.4 GHz dataset – a single five minute snapshot observation – yielded a 10 detection of a 1.2 mJy feature extended from the quasar (Figure 1). This feature is only about of the core flux ( mJy), so it is no surprise that the original investigators (Moran & Helfand, 1997) simply concluded that the quasar was an unresolved point source from these data. The measured off-source RMS of 0.12 mJy in the image is within 50 of the thermal noise limit expected from the integration time. The resultant image has a dynamic range of almost 2,000:1.
The jet knot was modeled with an elliptical gaussian profile in both the
(u,v) plane with DIFMAP’s MODELFIT utility, and in the map plane
with the JMFIT task in AIPS. The fits gave consistent measures of the
deconvolved size: , elongated along the jet
direction. We note that this is comparable to the beamsize for this
observation so the source is consistent with being unresolved, and the
size should be considered an upper limit. The separation from the core is
2.5″ at a position angle of , and is comparable to
that measured from the X-ray data. Interestingly however, the peak in the
X-ray jet appears somewhat closer to the nucleus than the radio centroid
in the image overlay (Figure 2), by about one Chandra ACIS pixel
(0.492″ per pixel), or equivalently 3 kpc projected distance.
The images were aligned by the cores to better than half of a pixel.
Siemiginowska et al. (2003b) found the peak in the X-ray jet to be 2″ away
(see also their subpixel re-binned radial profile published in their
Figure 2), consistent with our qualitative assessment. Yuan et al. (2003)
stated the same peak to be 3″ distant from the nucleus,
although we measured a smaller value off their Figure 1. Much more
apparent X-ray/radio offsets are seen in other powerful quasars
(e.g. up to 2″ in PKS 1127–145; Siemiginowska et al., 2002). Most, if
not all of the X-ray counts from the GB 1508+5714 jet lie within the
outermost radio contour in the VLA image (Figure 2).
A 10-minute 8.4 GHz observation obtained on Nov 3, 1996 (Program AD388) yielded no detection of the radio jet. The measured off-source RMS in the naturally weighted image (0.35″ beam) is at about the expected thermal noise limit of 0.045 mJy. In order to judge if the non-detection was a result of the greater resolution in this image compared to the 1.4 GHz map, the 8.4 GHz dataset were tapered by different amounts. No outstanding feature appeared above the residual artifacts from the dirty beam. The measured RMS at the expected position of the jet in a tapered image restored with a 0.75″ beam is 0.3 mJy (3). This, along with the 1.4 GHz detection, is consistent with an 0.8 radio spectrum (), which agrees with the measured X-ray spectral index: 0.90.36 (Siemiginowska et al., 2003b) and 0.92 (Yuan et al., 2003).
3 Constraints from the Radio Data
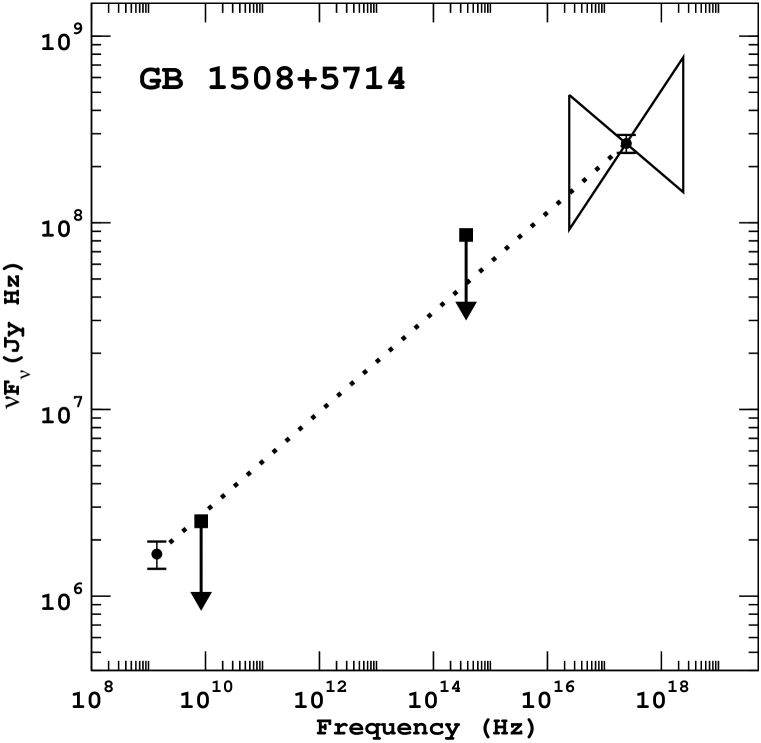
The spectral energy distribution of the jet knot in GB 1508+5714 is shown in Figure 3. If the X-ray and radio emission are drawn from the same population of relativistic electrons emitting synchrotron radiation, the spectral index will be about what is measured between the 1.4 GHz and X-ray (using 1.6810-6 ph/cm2/s/keV at 1 keV, reported by Siemiginowska et al. (2003b)) detections: = 0.73. This is a typical value for the spectrum seen in radio jets (Bridle & Perley, 1984), and is consistent with the measured X-ray spectrum of (Yuan et al., 2003; Siemiginowska et al., 2003b), and our constraint on the radio spectrum of 0.8 (the modest 8.4 GHz dataset does not preclude that the higher frequency radio emission, 40 GHz in the source frame, was actually resolved out). The optical HST limit (3) from Siemiginowska et al. (2003b) is not useful in this case, as it hovers over the radio-to-X-ray spectrum, and only weaker constraints are available at other optical bands (Yuan et al., 2003).
We can estimate an equipartition magnetic field of G, by adopting the observed value as the optically thin spectral index, and that the particles and field fill a fraction of a 2.91067 cm3 sphere, corresponding to the size upper limit derived from the radio detection. The factor is the ratio of magnetic field and electron energy densities, and is the lower energy cutoff of a power law distribution of relativistic particles. If we further assume =1, =1, and =10, then G, where is the unknown jet Doppler beaming factor. In this field, electrons emitting the highest energy X-rays detected (5 keV; Siemiginowska et al., 2003b) will have and short lifetimes (50 years) – this would require continuous in-situ reacceleration of high energy particles in order that the X-ray jet not be a transient feature. At this high redshift, the energy density of the CMB already exceeds that of the equipartition field, even without bulk motion (see below), so inverse Compton losses will already be dominant. The lifetime of the electrons calculated above is then a strict upper limit. Taking this evidence together, it is unlikely that the jet X-ray emission is dominated by synchrotron losses.
An IC/CMB origin for this high redshift X-ray jet is preferred (Yuan et al., 2003; Siemiginowska et al., 2003b), and give us an additional constraint on the allowed range of magnetic field and jet Doppler factor to the equipartition condition. The following expression is taken from Tavecchio (2002):
| (1) |
where, is a dimensionless function of (e.g., Ghisellini, Maraschi, & Treves, 1985), is the Thomson cross section, and ergs cm-3 for the CMB (e.g., Schwartz, 2002a), whose spectrum is peaked near (1+z) Hz (Harris & Krawczynski, 2002). Assuming , the observed ratio of the Compton (X-ray) and synchrotron (radio) fluxes ( and , observed at and , respectively), allow us to estimate G. The corresponding equipartition calculation gives G, making the assumptions as above about , , and . Both estimates of -field are reasonably insensitive to the assumed spectral index: up to 25 smaller for , the measured X-ray spectral index. In order to reconcile the differences between the two equations (opposite dependencies of on ), a Doppler factor greater than one is required. These two constraints bracket a plausible range of solutions around a 30G field and 4. Siemiginowska et al. (2003b) arrived at similar conditions using slightly different assumptions. The unresolved nucleus is a variable X-ray and (flat spectrum) radio source with a very high X-ray to optical luminosity (see, Moran & Helfand, 1997, and references therein). These observations have been taken as evidence of beaming on smaller scales, in the nucleus.
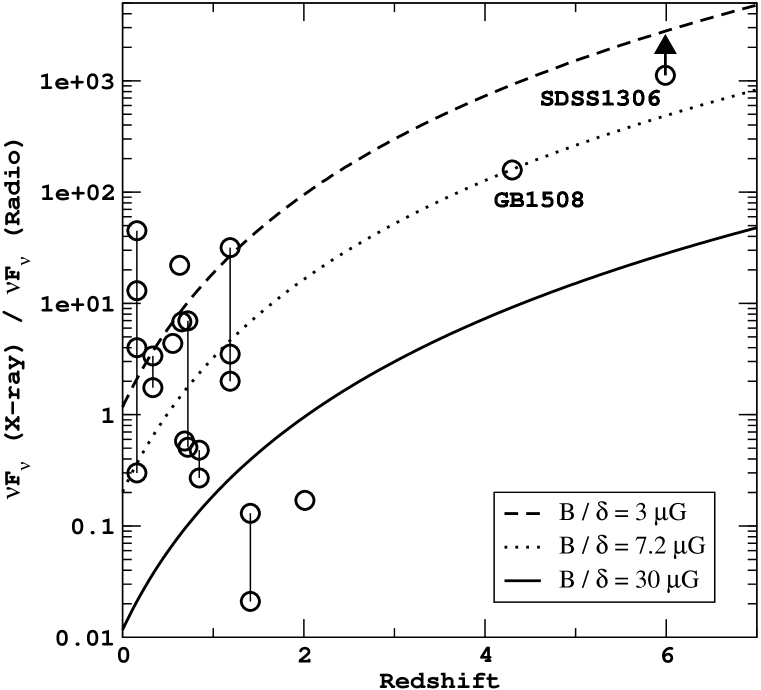
The ratio of the monochromatic X-ray to radio luminosities (i.e., in Fν) of the GB 1508+5714 jet is 158. This is one of the highest amongst the known X-ray jets which can be attributed to IC/CMB emission so far. In Figure 4, this ratio is plotted vs. redshift along with IC/CMB X-ray jets taken from the literature. The values seem to vary widely over 4 orders of magnitude, but predominantly show X-ray to radio ratios greater than 1. The jet in GB 1508+5714 sees 1–2 orders of magnitude times greater energy density from the CMB than other jets at lower redshift, so it is tempting to speculate that its extreme redshift may account, to first order, for its large X-ray to radio luminosity ratio. This could similarly, account for the large X-ray to radio ratio limit obtained for the proposed X-ray jet in the z=5.99 quasar SDSS 1306+0356 (Schwartz, 2002b; Schwartz, Cheung, & Wardle, 2003, Fig. 4).
The observed monochromatic X-ray to radio luminosity ratios can be compared to what is expected in the IC/CMB model. We can obtain an expression for the expected ratio by rearranging equation 1 (and setting ):
| (2) |
The flux ratio is simply proportional to the ratio of the energy densities in the CMB and magnetic field, with a Doppler factor term. This expression is plotted in Figure 4 for several different combinations of and , one of which, best suits the observations of GB 1508+5714. It appears that varying and can account for the large spread of observed X-ray to radio luminosity ratios within a given redshift range. Larger -field, or more likely, smaller may account for the low values observed in Q0957+561 (z=1.41, Chartas et al., 2002) and 3C 9 (z=2.012, Fabian, Celotti, & Johnstone, 2003), as they are known to have low radio core dominance, and weak VLBI structures (Campbell et al., 1995; Hough et al., 2002) compared to the other sources studied here. In all but 3C 179 (z=0.846, Sambruna et al., 2002) where multiple knot regions along the jet can be distinguished, the X-ray to radio flux ratio decreases with increasing distance from the nucleus, and can similarly be accounted for by varying . As discussed specifically in the case of 3C 273 (z=0.158, Sambruna et al., 2001), the variations along the jet may indicate deceleration, or increasing along the jet, possibly by compression in strong shocks. Future detections in the redshift range 2–4 or higher with large X-ray/radio flux ratios can lend further support to the currently preferred IC/CMB model used to explain the X-ray emission in quasar jets.
References
- Bridle & Perley (1984) Bridle, A. H. & Perley, R. A. 1984, ARA&A, 22, 319
- Bridle & Greisen (1994) Bridle, A. H. & Greisen, E. W. 1994, AIPS Memo 87 (NRAO: Charlottesville)
- Bridle et al. (1994) Bridle, A. H., Hough, D. H., Lonsdale, C. J., Burns, J. O., & Laing, R. A. 1994, AJ, 108, 766
- Brunetti et al. (2002) Brunetti, G., Bondi, M., Comastri, A., & Setti, G. 2002, A&A, 381, 795
- Campbell et al. (1995) Campbell, R. M., Lehar, J., Corey, B. E., Shapiro, I. I., & Falco, E. E. 1995, AJ, 110, 2566
- Celotti, Ghisellini, & Chiaberge (2001) Celotti, A., Ghisellini, G., & Chiaberge, M. 2001, MNRAS, 321, L1
- Chartas et al. (2000) Chartas, G. et al. 2000, ApJ, 542, 655
- Chartas et al. (2002) Chartas, G., Gupta, V., Garmire, G., Jones, C., Falco, E. E., Shapiro, I. I., & Tavecchio, F. 2002, ApJ, 565, 96
- Fabian, Celotti, & Johnstone (2003) Fabian, A. C., Celotti, A., & Johnstone, R. M. 2003, MNRAS, 338, L7
- Ghisellini, Maraschi, & Treves (1985) Ghisellini, G., Maraschi, L., & Treves, A. 1985, A&A, 146, 204
- Harris & Krawczynski (2002) Harris, D. E. & Krawczynski, H. 2002, ApJ, 565, 244
- Harris et al. (2003) Harris, D. E., Biretta, J. A., Junor, W., Perlman, E. S., Sparks, W. B., & Wilson, A. S. 2003, ApJ, 586, L41
- Hough et al. (2002) Hough, D. H., Vermeulen, R. C., Readhead, A. C. S., Cross, L. L., Barth, E. L., Yu, L. H., Beyer, P. J., & Phifer, E. M. 2002, AJ, 123, 1258
- Moran & Helfand (1997) Moran, E. C. & Helfand, D. J. 1997, ApJ, 484, L95
- Perley & Taylor (2003) Perley, R. A., & Taylor, G. B. 2003, VLA Calibrator Manual, NRAO
- Petric et al. (2003) Petric, A. O., Carilli, C. L., Bertoldi, F., Fan, X., Cox, P., Strauss, M. A., Omont, A., & Schneider, D. P. 2003, AJ, 126, 15
- Sambruna et al. (2001) Sambruna, R. M., Urry, C. M., Tavecchio, F., Maraschi, L., Scarpa, R., Chartas, G., & Muxlow, T. 2001, ApJ, 549, L161
- Sambruna et al. (2002) Sambruna, R. M., Maraschi, L., Tavecchio, F., Urry, C. M., Cheung, C. C., Chartas, G., Scarpa, R., & Gambill, J. K. 2002, ApJ, 571, 206
- Schwartz (2002a) Schwartz, D. A. 2002a, ApJ, 569, L23
- Schwartz (2002b) Schwartz, D. A. 2002b, ApJ, 571, L71
- Schwartz, Cheung, & Wardle (2003) Schwartz, D. A., Cheung, C. C., & Wardle, J. F. C. 2003, in Active Galactic Nuclei: from Central Engine to Host Galaxy, eds. S. Collin, F. Combes, & I. Shlosman, ASP Conf. Series 290, 619
- Shepherd, Pearson, & Taylor (1994) Shepherd, M. C., Pearson, T. J., & Taylor, G. B. 1994, BAAS, 26, 987
- Siemiginowska et al. (2002) Siemiginowska, A., Bechtold, J., Aldcroft, T. L., Elvis, M., Harris, D. E., & Dobrzycki, A. 2002, ApJ, 570, 543
- Siemiginowska et al. (2003a) Siemiginowska, A., Stanghellini, C., Brunetti, G., Fiore, F., Aldcroft, T. L., Bechtold, J., Elvis, M., Murray, S. S., Antonelli, L. A., & Colafrancesco, S. 2003a, ApJ, 595, 643
- Siemiginowska et al. (2003b) Siemiginowska, A., Smith, R. K., Aldcroft, T. L., Schwartz, D. A., Paerels, F., and Petric, A. O. 2003b, ApJL, accepted (astro-ph/0310241)
- Spergel et al. (2003) Spergel, D. N. et al. 2003, ApJS, 148, 175
- Tavecchio et al. (2000) Tavecchio, F., Maraschi, L., Sambruna, R. M., & Urry, C. M. 2000, ApJ, 544, L23
- Tavecchio (2002) Tavecchio, F. 2002, Ph.D. Thesis, University of Milan
- Yuan et al. (2003) Yuan, W., Fabian, A. C., Celotti, A., Jonker, P. G. 2003, MNRAS, accepted (astro-ph/0309318)