Structuring the HD 141569 A circumstellar dust disk
Scattered light images of the optically thin dust disk around the 5 Myr old star HD 141569 A have revealed its complex asymmetric structure. We show in this paper that the surface density inferred from the observations presents similarities with that expected from a circumprimary disk within a highly eccentric binary system. We assume that either the two M stars in the close vicinity of HD 141569 A are bound companions or at least one of them is an isolated binary companion. We discuss the resulting interaction with an initially axisymmetric disk. This scenario accounts for the formation of a spiral structure, a wide gap in the disk and a broad faint extension outside the truncation radius of the disk after 10–15 orbital periods with no need for massive companion(s) in the midst of the disk resolved in scattered light. The simulations match the observations and the star age if the perturber is on an elliptic orbit with a periastron distance of 930 AU and an eccentricity from 0.7 to 0.9. We find that the numerical results can be reasonably well reproduced using an analytical approach proposed to explain the formation of a spiral structure by secular perturbation of a circumprimary disk by an external bound companion. We also interpret the redness of the disk in the visible reported by Clampin et al. (2003) and show that short-lived grains one order of magnitude smaller than the blow-out size limit are abundant in the disk. The most probable reason for this is that the disk sustains high collisional activity. Finally we conclude that additional processes are required to clear out the disk inside 150 AU and that interactions with planetary companions possibly coupled with the remnant gas disk are likely candidates.
Key Words.:
stars: planetary systems – stars: HD 141569 – planetary systems: formation –1 Introduction
Asymmetries and annular structures are common observational features regardless of the emission process (scattered light or thermal emission) for the handful of gas-free and optically thin disks currently resolved around Main-Sequence stars. Surface brightness maxima peak far from the star from dozens up to about one hundred AU. Attempts to explain radial and azimuthal structures involve massive un-resolved planet(s), trapping dust particles into resonances due to either radial migration of particles sensitive to Poynting-Robertson drag and/or to radiation pressure (e.g. $ϵ$ Eri: Ozernoy et al., 2000; Quillen & Thorndike, 2002) or to outward migration of the planet (e.g. Fomalhaut and Vega: Wyatt & Dent, 2002; Wyatt, 2003). Other attempts involve external stellar companion(s) either bound and observed (e.g. HR 4796: Wyatt et al., 1999) or unbound and currently unobserved but having recently approached the close vicinity of the disk (flyby scenario, e.g. $β$ Pictoris: Larwood & Kalas, 2001). In the edge-on disk of $β$ Pictoris, the vertical asymmetries are explained by the precession of planetesimal orbits induced by an inner planetary companion on an orbit that is inclined to the dust disk (Mouillet et al., 1997) and the effect of radiation pressure acting on the smallest grains (Augereau et al., 2001). But note that the inner planet in this model can be replaced by any inner misaligned mass distribution with the appropriate quadrupole moment components and is not dependent on any particular planet postulate. An alternative scenario involving dusty clump formation through stochastic collisions between large planetesimals has been proposed by Wyatt & Dent (2002) to explain the asymmetries noticed in the Fomalhaut disk.
We explore in this paper a source of asymmetry for the optically thin dust disk surrounding HD 141569 A, a B9.5V–A0V star located at about 100 pc according to Hipparcos measurements. Coronagraphic images from the visible to the near-infrared have revealed the complex morphology of the dusty circumstellar environment of this old Herbig star (Augereau et al., 1999; Weinberger et al., 1999; Mouillet et al., 2001; Boccaletti et al., 2003; Clampin et al., 2003).
[Figure available in JPEG format or download the paper at http://www.strw.leidenuniv.nl/augereau/newresults.html]
One can construct the following sketch of the shape of the dust disk beyond 100–120 AU (the edge of the coronagraph) as it appears in scattered light (see also Figure 1) :
-
•
the disk is composed of two annuli peaked at 200 AU and 325 AU from the star with centers shifted by 20–30 AU almost along the minor axis of the disk (East-West direction). The outer ring actually shows a tightly-wound spiral structure,
-
•
the two bright predominant annuli at 200 AU and 325 AU have between them a darker ring or “gap”. This gap is radially wide compared to the two annuli,
-
•
the two bright rings show out of phase brightness asymmetries of up to factors of 2.5–3 for the outer ring in the visible. These asymmetries cannot be explained by invoking scattering properties of the dust grains,
-
•
an extended diffuse emission is present in the North-East of the disk and is detected up to more than 600 AU,
-
•
the disk brightness sharply decreases between 200 and 150 AU rapidly reaching the background level of scattered light images interior to 150 AU. This behavior is suggestive of a strong, but likely not complete, depletion of dust inside 150 AU,
-
•
structures with smaller spatial scales are also present such as a radially thin arc superimposed on the dark lane/gap at a distance of 250 AU from the star,
-
•
the maximal vertical optical thickness of the outer ring is in the visible and the near-infrared.
The dust content inside 100–120 AU remains almost totally unconstrained despite marginally resolved images in the mid-infrared (Fisher et al., 2000; Marsh et al., 2002) which indicate a confirmation of dust depletion inside 100 AU (Fig. 4 from Marsh et al., 2002). A total midplane optical depth in the visible of 0.1 has been estimated by Li & Lunine (2003) indicating that the disk is optically thin in all directions.
HD 141569 A is not isolated but has two low-mass stellar companions HD 141569 B and HD 141569 C located at 7.54” and 8.93”. Their position angles (PA) are 311.3 and 310.0 respectively (Augereau et al., 1999). We show in this paper that the gravitational perturbation of the HD 141569 A disk by the detected stellar companions gives a natural explanation for some of the broadest features observed in scattered light as long as one of the companions, or both if bound, is on an orbit with high enough eccentricity.
We detail in section 2 our motivations for exploring the impact of the observed companions on the shape of disk and we give a description of the dynamical model we used to address this issue. The numerical results shown in section 3 are compared with an analytic solution to the problem in section 4. A surface density consistent with the resolved images of HD 141569 A is obtained in section 5 and we discuss the implications for the dynamics of the companions. In section 6, we interpret the redness of the disk in the visible measured by Clampin et al. (2003) in terms of minimal grain size in the disk and we discuss the consequences of these results. We finally point out the limitations of our dynamical approach in section 7 and indicate directions for future work.
2 Dynamical modeling
2.1 Motivations
We discuss in this paper the possible gravitational influence on the dust disk of the stars HD 141569 B and C observed in the close vicinity of HD 141569 A. Motivations for exploring the potential gravitational influence of the detected stellar companions are threefold:
-
1.
Based on astrometric and radial velocity measurements, Weinberger et al. (2000) argue that B and C, identified as M2 and M4 pre-Main Sequence stars respectively, have a high probability of forming with HD 141569 A a bound triple system. The three stars have similar ages : 53 Myr for the two M companions (Weinberger et al., 2000) and 5 Myr for HD 141569 A (Merín et al., 2003). If HD 141569 A, B and C are indeed gravitationally linked, B and/or C are likely to perturb the disk surrounding the primary and are natural candidates for structuring the disk. In any case the possible effects of these observed probable companions has to be explored before invoking other sources of asymmetries in the disk. Moreover the very latest images of the disk with HST/ACS strongly support our approach (Clampin et al., 2003).
-
2.
Could undetected companion(s) in the midst of the disk explain the gap at 250 AU? Weinberger et al. (1999) show that a companion with a mass larger than 3 times that of Jupiter would have been detected by the HST/NICMOS instrument but on the other hand an object with a mass 1.3 times that of Jupiter would be sufficient to form and clear the 250 AU region. While the presence of such companion(s) can not be ruled out, current planet formation models do not readily account for the in situ formation of Jupiter-like objects at a distance of a few hundred AU around a 5 Myr old star.
-
3.
Previous modeling attempts to explain the structures in the disk fail, as noticed by the authors themselves, to reproduce them (Takeuchi & Artymowicz, 2001). The differential migration of dust grains in a gas disk with an outer sharp edge leads to the formation of a gap and an outer dust over-density of small particles but this approach, which apparently requires the presence of an unaccounted for sharp outer edge to the gas disk, results in a very axisymmetrical structure which does not match the more recent observations.
2.2 Model and assumptions
We consider in this paper the evolution of a collisionless circumstellar disk of solid particles gravitationally perturbed by an external bound perturber on an eccentric orbit.
We assume that at least one of HD 141569 B and C and possibly both are bound to HD 141569 A. Because the orbital parameters of the two companions with respect to HD 141569 A are unknown and because of their close projected positions we will adopt the simplest assumption that there is a single perturber assumed to be coplanar with the disk that can interact strongly with it. In principle this could be either one of the companions or a composite of them if they are bound together. We set the mass of the single perturber to the total mass of HD 141569 B and C assumed to be respectively M2 and M4 stars. But note self-similar properties of the simulations enable a scaling to different companion masses. This leads to a secondary to primary mass ratio of 0.2. The pericenter distance of the perturber is constant in the model and we vary the eccentricity of its orbit (Figure 2). Thus, unless explicitly stated, distances will be expressed in units of pericentre distance between the perturber and the primary. Four perturber eccentricities are explored in this paper : 0.1, 0.3, 0.5 and 0.7. The perturber starts the simulation at its pericentre position.
[Figure available in JPEG format or download the paper at http://www.strw.leidenuniv.nl/augereau/newresults.html]
The initial circumprimary disk consists of “massless” test particles distributed in a 2D axisymmetrical disk from to model units with a radial power-law surface density . The disk is splited up into nine concentric annuli of particles each with radius following the relation ensuring the continuity of the surface density from one annulus to another. A constant surface density () is assumed but different initial surface densities were explored by an a posteriori processing. This actually does not impact the general behavior described in this paper. Particles are initially on circular orbits around HD 141569 A.
The orbits of the particles are numerically integrated using a fifth-order Cash-Karp Runge-Kutta method. Effects on the motion arising from radiation are neglected. The simulations start with a time-step of a tenth of the orbital period of the closest particle to HD 141569 A. Then it is adjusted within the code in order to ensure accuracy. The dynamical response of the disk is numerically followed over a total span of 169, 116, 70 and 32.5 perturber orbital periods for the 0.1, 0.3, 0.5 and 0.7 perturber eccentricities respectively. Every fiftieth of the total span, positions and velocities of the particles are stored. As an example, a pericentre distance of 1200 AU and an eccentricity =0.5 correspond to a total span of 5 Myr with a storage process time-scale of years.
3 Numerical results
[Figures available in JPEG format. Animations and paper can be downloaded at http://www.strw.leidenuniv.nl/augereau/newresults.html]
Figures 3a to 3d show snapshots of the temporal evolution of an initially axisymmetrical circumprimary disk of test particles in an eccentric binary system with a mass ratio of 0.2 for different perturber eccentricities. Several features characterize the dynamical response of the disk to the perturber among which the clearing out of the outer disk and the formation of spiral structures are the most prominent ones.


Particles initially at radii larger than model units reach highly eccentric orbits after about ten perturber periods resulting in a gravitational truncation of the disk consistent with theoretical calculations (e.g. Papaloizou & Pringle, 1977). The truncation occurs regardless of the assumed perturber eccentricity (Figure 4) but low perturber eccentricities increase the efficiency of particle ejection after a fixed number of orbital periods since the pericentre distance of the perturber is constant in the model. For instance 90% of the particles initially outside the critical radial distance of model units have been placed on unbound orbits for after 10 perturber revolutions whereas 45% of them were still bound to the central star for after the same number of orbits (Figure 4). Together with the low eccentricities induced by the perturber on the particles interior to model units, this effect results in sharp outer disk edges for low values. Conversely the disk truncation is less marked for the largest values. This is contributed to by the increase of the mean eccentricity of the bound particles which have the ability to perform excursions significantly beyond the truncation distance (Figure 4b and c). Actually the disk truncation for large values is not homogeneous in azimuth as can be noticed in Figure 3 for and . This is manifest by the formation of a marked azimuthal asymmetry of the surface density for distances larger than model units for the largest values after similar numbers of perturber orbital periods.
Inside the truncation distance, an over-density of particles develops in conjunction with the truncation process which breaks the axisymmetry of the initial disk. This spatially coherent over-density appears close the outer edge of the truncated disk at a distance model units. As shown below, the secular perturbation of the disk by the perturber is essentially responsible for the formation of this spiral-shaped structure which is well marked for It progressively winds around the central star becoming radially thinner with time. The formation of the spiral-shaped over-density of particles leads in turn to the formation of lower surface density regions and ultimately results in the opening of a spiral gap. The gap always appears to be radially wider than the adjacent over-density spiral. The contrast between the high and low density regions begins to increase with time as the spiral propagates inwards. The particle eccentricity induced by the perturber depends on its eccentricity (Figure 4). This prevents the spiral structure from having exact self-similar properties as the perturber eccentricity varies. Nevertheless we notice that the large scale features evolve in a similar way as a function of the perturber orbital period (Figures 3b to 3d). The latter characteristic is used in section 5 in order to derive orbital parameters for the perturber matching the observations of the HD 141569 system.
4 Spiral structure by secular perturbation of the inner disk
We here show that the transient spiral structure in the inner disk seen in the simulations can be understood as being due to the action of the time averaged potential due to the perturber. This accounts for some of the self-similar scaling properties seen in the simulations.
We adopt a simple model based on calculating the linear response of a cold collisionless disk to an orbiting companion in the continuum limit. In this scheme differential precession would cause the induced spiral structure to wind up indefinitely generating arbitrarily small scales and large surface densities. In a more realistic situation, the fact that the disk is not a continuum and has a non zero velocity dispersion will cause the spiral structure to eventually wash out. To model such effects we introduce an ad hoc decay rate for the spiral form that increases as its radial scale decreases. Further we impose a cut off on the magnitude of the surface density calculated using the linear response. In this way the temporal morphology of the spiral form apparent in the linear response remains while unphysical effects arising through the simplicity of the model are suppressed.
[Figures available in JPEG format or download the paper at http://www.strw.leidenuniv.nl/augereau/newresults.html]
We suppose that define a cylindrical coordinate system based on the primary star of mass which exerts a potential We take the perturber with mass to be in an eccentric orbit with semi-major axis and eccentricity The apsidal line is taken to lie along the axis (). The perturbing potential it produces can be expanded in terms of a Fourier cosine series in and time averaged (eg. Terquem & Papaloizou, 2002). It is necessary to retain only the first two terms in the Fourier series to lowest order in so that we may write
| (1) |
The first axisymmetric term contributes to the unperturbed motion in the disk. In particular it leads to a precession of orbits with small eccentricity at a rate with and being the angular and epicyclic frequencies associated with a circular orbit containing the conserved orbital angular momentum respectively (see eg. Binney & Tremaine, 1987, for the basic definitions and disk dynamics required). For the time averaged potential assuming, as is the case, that one obtains
| (2) |
In general this is a function of the radius, of the circular orbit. The presence of the second nonaxisymmetric term, in (1) perturbs these to become eccentric. One may write
| (3) |
where denote the components of the Lagrangian displacement vector in the radial and azimuthal directions respectively. Note too that where is a fixed phase associated with and identifying a particular orbit.
Assuming with being a small disk eccentricity, in the linear approximation the governing equation is that of a forced harmonic oscilator taking the form
| (4) |
Note that the time derivative is taken along a given unperturbed orbit and so evaluation of the perturbing potential at introduces a time dependence on such an orbit.
[Figures available in JPEG format. Higher resolution PNG images and paper can be downloaded at http://www.strw.leidenuniv.nl/augereau/newresults.html]
Equation (4) is easily solved for provided appropriate boundary conditions are applied. Here we assume that prior to some time when the companion is introduced the disk is unperturbed. It is important to emphasize that the formation of transient spiral structure requires such a ’sudden’ introduction of the perturber. Here ’sudden’ means fast compared to the inverse precession frequency at the disk location of interest. A possibility would be a distant scattering into an orbit of high eccentricity near apocentre. A very ’slow’ introduction of the perturber through build up of its mass on a long timescale would not lead to transient spiral structure. A solution of (4) corresponding to ’sudden’ introduction in the limit of small can be expressed in the form
| (5) |
The first thing we point out about (5) is that it has a self-similar scaling property for Noting that in that limit being twice the pericentre distance and using equation (2), we see that equation(5) gives the same displacement for a given pericentre distance and perturber mass ratio after a given number of orbital periods independent of This scaling, which is only appropriate for secular perturbations, occurs in our simulations.
Note too that in the expression (5) the perturber mass only occurs as linear multiple in as given by equation(2). Thus different perturber masses produce the same spiral planform, but on longer timescales for lower mass perturbers. We have also verified that the simulations show this. Adjusting either one of the companion masses or their combination can then be accommodated by scaling the time.
Another aspect indicated above is that because depends on we have differential precession and an unlimited winding up and shortening of the scale of the disk perturbation. This occurs through an increase of the wavenumber that is implied in the second term in (5) which is there because of the ’sudden’ initial condition. Such large values of can in theory lead to unrealistically large or even singular values for the surface density.
In fact an arbitrary increase of does not manifest itself in the simulations or the physical problem of interest. It does so in the simplified analysis given above because the disk was assumed to be a continuum initially with exact circular orbits only. The introduction of some velocity dispersion would result in a particle sampling a range of radii and thus a limit to the size of the value and the disk surface density that may occur in any visible perturbation. Very short scales, if initiated, would be washed out and decay. Here we represent the decay of very short scale disturbances in a simple ad hoc manner. We simply reduce the amplitude of the term in equation (5) by a factor that depends only on time by replacing it by where is a fiducial radius. This reduction causes the second term in (5) and hence the spiral structure to decay with time. It is clear that the first and remaining term at large times in (5) does not produce a spiral form.
We now compare the form of the surface density perturbation resulting from the above analysis with that found in the simulation. To do this we use mass conservation expressed in Lagrangian form, namely
| (6) |
where is the magnitude Jacobian determinant of the transformation Here is the surface density of the disk under perturbation, while is the surface density for the unperturbed disk. We adopt the relation between and that applies to Keplerian orbits with small eccentricity, namely To prevent unphysically large surface densities we employ a cut off through providing a floor for which limits the surface density at
We plot the surface density obtained from the above analysis in Figure 5 for a binary with and pericentre distance model units. The disk is considered for model units and that corresponds to the section of the disk illustrated in Figure 3. The number associated with each plot is the time in orbital periods. Comparison with Figure 3d for the simulations indicates a similar morphology regarding the spiral pattern at corresponding times. Note that we have verified that this morphology is insensitive to the mode of the cut off at high surface densities or of large radial gradients. Furthermore because the morphology is generated by the time averaged secular potential, it does not depend on the precise location of the perturber on its orbit at any time but only on the direction to pericentre, here being along the axis.
5 Application to the HD 141569 A disk
We discuss in this section the morphological similarities between the disk features described in the two previous sections and those observed in the HD 141569 A disk. We base our semi-qualitative comparison between simulations and observations on the dust surface density maps obtained by Clampin et al. (2003, hereafter C03). These maps have been derived from HST/ACS deprojected images of the disk seen in scattered light in B, V and I bands. They take into account the stellar flux dilution effect assuming the disk is optically thin in all directions at visible wavelengths (Figure 7c from C03). They take also into account the anisotropic scattering properties of the grains assuming forward scattering with an asymmetry factor in the range 0.25–0.35 consistent with the upper limit assessed by Mouillet et al. (2001) (Figure 7d from C03). Given the relative uncertainties in grain properties in the HD 141569 A disk (see nevertheless section 6), and thus the uncertainties on grain scattering properties, we may safely assume in the following that Figures 7c and 7d in C03 bracket a representation of the true surface density of the dust disk by noting that they respectively correspond to the isotropic and maximum anisotropic assumptions for scattering.
We interpret the following observational evidences :
-
•
the lack of obvious link between the resolved inner and outer annulus in the HD 141569 A system,
-
•
the low surface density of the inner ring compared to the outer one,
-
•
the azimuthal asymmetry of the outer ring,
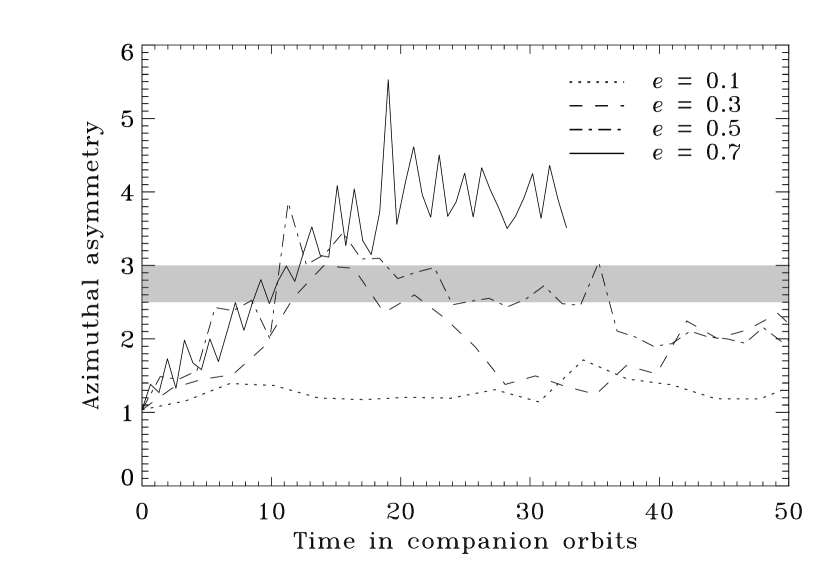
as three constraints on the number of perturber orbital periods the system has evolved for and on the eccentricity of the perturber’s orbit. According to these criteria, well wound structures are ruled out such as those formed after 20 perturber orbits. The “isotropic” surface density is better recovered after 15 perturber orbits as against 10 perturber orbits for the “anisotropic” case (Figures 3b to 3d). The measured azimuthal asymmetry within the structure is reproduced for (Figure 7). For , the disk is too poorly contrasted both azimuthally (Figure 7) and radially (Figure 3).
We then conclude that the surface densities of HD 141569 A inferred from the HST/ACS observations show large scale features consistent with a circumprimary disk within an eccentric binary system provided that the perturber eccentricity is at least larger than 0.3 (most probably 0.5) and second that the system has been perturbed for a total duration of 10–15 orbital periods (Figure 6). Under such conditions the spiral-shaped structure newly-formed close to the truncation distance qualitatively matches the predominant structure observed at a distance of 325 AU (also highlighted in red color on Figure 8a from C03). The position of the over-density which appears close to model units after 10–15 perturber orbits (sections 3 and 4) matches the observations if the pericentre distance is set to 930 AU. An argument of pericentre of 50 (anti-clockwise direction on the Figures) with an uncertainty of at least qualitatively matches the observations. Such orbital parameters for the perturber are consistent with current deprojected positions of the two companions assumed to lie in the disk plane and assimilated into a single perturber in our approach (Figure 6).
In a direction opposite to that of the over-density of particles, the simulated disk shows a broad faint extension. A first consequence is that the outer edge of the disk looks shifted in the direction of this extension while the central disk hole (artificially introduced in the simulations) remains centered onto the star. Therefore, the formation of a spiral structure in the outer regions of the disk as well as the shift of the center of the outer disk edge provide explanations of the shifts reported by several authors between the inner and outer “rings” (Mouillet et al., 2001; Boccaletti et al., 2003; Clampin et al., 2003). A second consequence is that the broad extension opposite to the over-density may account for the “diffuse emission” reported by Mouillet et al. (2001) in that direction (see Figure 1). An alternative explanation for the “diffuse emission” could be a local enhancement of the collision frequency at the location of the over-density resulting in the production of a larger number of small particles with large eccentricities.
Matching the estimated star age of Myr (Weinberger et al., 2000; Merín et al., 2003) critically reduces the range of companion eccentricities : a 2 Myr age implies while 8 Myr leads to . We made use of the rough self-similar properties applying inside the truncation distance as noted in sections 3 and 4 in order to derive these values. Lower eccentricities are theoretically possible but less probable in the framework of a gas-free disk of solid material unless the perturbation is very recent (see the discussion in section 4).
6 Minimum grain size
Clampin et al. (2003) also report the redness of the disk in the visible. The disk scatters % more stellar flux in the I band than in the B band and % more in the I band than in the V band. Interestingly no color gradient within the disk is measured which indicates that similar scatterers dominate the scattered light images at every distance from the star. One can anticipate that the grains responsible for the color effect are close in size to the wavelengths discussed here. In this section we further constrain the size distribution in the disk and discuss some implications.
6.1 Interpretation of the disk color in the visible
For simplicity we assume that the differential dust size distribution follows a single power law: between a minimum size and a maximum size . We in addition restrict the discussion to compact grains111The impact of the porosity is discussed in section A.3. The HD 141569 A dust disk shares some similarities with typical debris disks: it is optically thin and grains are short-lived (Boccaletti et al., 2003; Li & Lunine, 2003). A reservoir of mass, presumably an unseen population of colliding large bodies such as planetesimals, feeds the disk in observable dust grains. The dust size distribution therefore extends to large particles that behave as grey scatterers in the visible and near-IR. The color effect measured in the visible is very likely produced by the smallest particles of the size distribution which implies (mean scattering cross section dominated by the smallest grains).
In the small range of wavelengths considered here, a noticeable color index is inconsistent with dominant scatterers in the regime of geometric optics. Grains larger than about ten times the size at which the scattering efficiency reaches its maximum induce fluctuations of of the same order of or smaller than the uncertainty on the color index reported by C03. This remark leads to very conservative upper limits on . On the other hand a strict lower limit on consistent with the observations can be derived by considering the grain scattering behavior in the Rayleigh regime. This approach is detailed in Appendix A (Eq. 17). Table 1 gives the results for spherical silicate and graphite compact grains.
| lower limit | upper limit | |||
| on ( | on (10 ) | |||
| B-I | V-I | |||
| Silicate : | 0.077 | 0.095 | 3.1 | |
| Graphite : | 0.041 | 0.051 | 1.6 | |
The upper limit on the minimum grain size in the disk must be compared to the blow-out size in the radiative environment of HD 141569 A. Boccaletti et al. (2003) show that compact spherical grains smaller than m are blown away by radiation pressure. We conclude from our interpretation of the redness of the disk reported by C03 that the disk contains a large fraction of grains smaller than the blow-out size limit (so-called -meteoroids in the Solar System). A similar result was derived from the interpretation of a marginal color effect in the near-infrared (Boccaletti et al., 2003).
According to the results summarized in Table 1, the size of the smallest grains in the HD 141569 A compares to the largest interstellar grains (e.g. Li & Greenberg, 1997; Weingartner & Draine, 2001; Clayton et al., 2003), to the monomers of cometary dust particles (e.g. Greenberg & Hage, 1990; Kimura, Kolokolova, & Mann, 2003) or to the constituent monomers of interplanetary dust particles, thought to be of cometary origin, and which exhibit porous aggregate structures (e.g. Brownlee, 1985). The interpretation of the scattered light observations leads to minimum grain sizes consistent with that proposed by Li & Lunine (2003) from their analysis of the thermal emission of the disk. They show that the spectral energy distribution of the disk is well reproduced if m.
6.2 Consequences
The presence of a large amount of small grains, as small as a tenth of the blow-out size limit, points out on the need for an efficient mechanism able to continuously replenish the dust disk in fresh particles, theoretically expelled from the disk after a few orbital periods, and responsible for the observed color effect. Mean collision time-scales two or three orders of magnitude smaller than the star age have been estimated from the vertical optical thickness of the HD 141569 A disk (Boccaletti et al., 2003). Therefore collisional evolution can happen. Given the grain sizes and the large distances from the star considered here, Poynting-Robertson drag is not efficient compared to collisions. The large number of -meteoroids in the disk, large enough to produce a noticeable color effect, probably results from the large collisional activity of the disk compared to more evolved debris disks around older stars. According to Krivov, Mann, & Krivova (2000) and Augereau et al. (2001), the outer disk of $β$ Pictoris could also hold a population of -meteoroids. But the shape of the size distribution departs from a single power law in Krivov, Mann, & Krivova (2000)’s model222Using a different approach, Thébault, Augereau, & Beust (2003) also show that dust production by collisions results in size distributions that significantly depart from single power laws and a major consequence is that the cross-section is dominated by bound particles that have a grey scattering behavior consistent with the neutral color of the outer $β$ Pictoris disk in the visible (e.g. Lecavelier Des Etangs et al., 1993).
Alternatively, we can further consider the optical behavior of the grains. The scattering properties of an aggregate might be similar to that of the constituent particles if the aggregate is porous enough. Could the dominant scatterers responsible for the images of the HD 141569 A disk be monomers packed into porous bound grains? We let the porosity of an aggregate and the corresponding blow-out size limit. For large values, the number of monomers required to form a grain of size can be approximated by
where is the mean size of the monomers. For HD 141569 A, the ratio is of the order of 10. If the scattered light images are indeed tracing monomers in very porous bound aggregates, then the smallest grains in the HD 141569 A system are made of at least a few thousands of monomers similar in size to the constituents of the interplanetary dust particles. The major problem with this alternative scenario is that collisional time-scales are very likely short enough to efficiently split up such large aggregates into their constituent monomers producing an unavoidable population of particles small compared to the blow-out limit.
7 Conclusion
We have explored in this paper the possible impact of the two M companions of HD 141569 A on the dynamics of its circumprimary dust disk. Provided that at least one of the two companions is bound to HD 141569 A and on an orbit of high eccentricity, the tightly wound and asymmetric spiral structure at AU can be reproduced. By contrast, the disk interior to the spiral structure looks depleted as observed. The inner ring which has a low surface density compared to the outer structure is not reproduced in this approach. From the redness of the disk in the visible we deduce that the disk contains a large fraction of short-lived grains small compared to the blow-out size limit and implying high collisional activity.
How the contrasting structures of the HD 141569 A disk are affected by collisional activity and the effects of radiation pressure are key issues that will need to be explored. The dynamics of the disk is made even more complex by the fact that gas drag may also play a role. The system indeed contains a remnant amount of gas that was detected for the first time by Zuckerman et al. (1995). Whether the gas disk is extended and massive enough to impact the dynamics and the shape of the dust disk especially at very large distances (around 300-350 AU) is an issue that will be addressed in a near future thanks to recently resolved images of the CO disk (Augereau et al., 2003).
Our model does not provide an explanation of the observed depletion of solid material inside 150 AU. An additional process is required to clear out the inner disk and to produce the sharp edge observed around 150 AU. Together with the surprising detection of H in the HD 141569 A disk by Brittain & Rettig (2002), previously observed in atmospheres of the giant Solar planets, these observations are suggestive clues for speculating on the presence of planetary companions in the inner disk. The coupling of putative newly-formed massive companions in the inner disk with the gas disk resolved by Augereau et al. (2003) is an exciting prospect. The disk-planet coupling has been theoretically addressed by several authors and the orbital parameters of some of the detected extra-solar planets are understood as the final result of this interaction. The HD 141569 A system is young enough (only a few Myr) with a still reasonably large amount of remnant gas so that disk-planet coupling might still act. Future observations of the HD 141569 A system should judiciously focus on the inner regions to better assess how empty and perhaps structured the inner gas and dust disk is, and on opportunities for detecting possible sub-stellar objects inside 150 AU.
Acknowledgements.
We thank A.M. Lagrange and D. Mouillet for helpful discussions on the interpretation of the high resolution images of the HD 141569 A disk. We also thank M. Wyatt for carefully refereeing the paper, P. Thébault for useful comments and the ACS Science Team for kindly providing HST/ACS images. J.C.A. is deeply grateful to E.F. van Dishoeck for her permanent support in the course of this work at Leiden Observatory and to C. Eiroa for the discussions on the distance of HD 141569 A. J.C.A. was supported by a fellowship from the European Research Training Network “The Origin of Planetary Systems” (PLANETS, contract number HPRN-CT-2002-00308) at Leiden Observatory.Appendix A Interpretation of a scattering color effect in terms of minimum grain size
The Mie scattering efficiency of spherical and homogeneous dust particles only depends on the real part of the complex refraction index of the grain and on the so-called size-parameter where is the grain radius and the wavelength. follows three basic well-known regimes (Bohren & Huffman, 1983) :
-
1.
for small values (, Rayleigh regime), .
-
2.
for large values () (grey scattering).
-
3.
otherwise incident rays and rays passing through the grain produce interferences resulting in extinction maxima (then scattering maxima) peaking at where is a positive integer or zero. For a given wavelength, the first peak appears for grains of size
(7) We note
(8)
We propose an approach allowing the interpretation of a measured scattering color effect in the context of an optically thin circumstellar disk. The color effect is expressed by
where and are the measured circumstellar flux at wavelengths and ; and are the stellar flux at and . We assume in the following that the grains have similar complex optical indices in the range of wavelengths considered. We note and . Anisotropic scattering properties are then similar and the scattering efficiency only depends on the size parameter for spheres of radius . In the optically thin regime the color effect can be then written
where and are the scattering cross-sections averaged over the grain size distribution . is the minimum grain size and is the maximum grain size. For the sake of simplicity we assume . We also assume that at both wavelengths and . Thus, the color effect does not depend on and this allows us to replace by in the following. The color effect can be rewritten
where
Since we rewrite in the form
| (9) |
A.1 Upper limit on in the Rayleigh regime
We now consider minimum grain sizes such that the scattering efficiencies and fall into the Rayleigh regime. The basic idea is to compute an upper limit of the minimum grain size in the circumstellar disk consistent with the observed color effect in the regime of grains small compared to the wavelength. This gives
| (10) |
We compute the integral between and in equation 9 in two steps. Between and (given by equation 8) the Rayleigh regime is accurately obeyed except for values close to where the Rayleigh law over-estimates . Therefore
| (11) |
The scattering efficiency reaches its maximum value for . Assuming that is a constant for larger than leads to an upper limit of the integral between and
| (12) |
with
| (13) |
By combining equations 9 and 10 and inequalities 11 to 13 we finally obtain
This leads to where
| (14) |
Minimum grain sizes obeying to the Rayleigh approximation and consistent with the color measurement must then be smaller than . We recall that the former equation does ensure that such grains do exist in the disk. Larger grains, also consistent with the color index but that do not follow the Rayleigh approximation are not excluded.
A.2 Lower limit on in the Rayleigh regime
A lower limit on the minimum grain size in the Rayleigh regime and consistent with the observations can similarly be derived provided that a real fulfilling the following criteria can be found :
-
1.
,
-
2.
, i.e. obeys the Rayleigh approximation for from to ,
-
3.
, i.e. the scattering efficiency for is smaller than the value of in the geometric optics regime.
Then
| (15) |
and
or
| (16) |
Inequality 16 together with equations 9, 15, 8 and 14 give
| (17) |
We add a few useful remarks about the criteria defining . The first criterion must be used to check the self-consistency of the result. The second criterion can consider the fact that size parameters a few times smaller than already ensures that the scattering efficiency follows the Rayleigh law with a good approximation. In order to fulfill the third criterion one should use the precise Rayleigh approximation (e.g. Bohren & Huffman, 1983)
Solving the previous equation for and gives an upper limit an . If grains are very porous and made of inclusions small compared to the wavelength, then should be replaced by where is given by equation 18 and is given by equation 20.
A.3 Grain porosity
Equations 14 and 17 which depend on (or ) have been obtained by assuming that grains are spherical and compact. In the following, we assess the impact of the grain porosity on (or ). A way to go towards the solution is to use an effective medium theory as described in details in Bohren & Huffman (1983). Here we consider the Maxwell-Garnett theory. In that framework, a porous grain made of a single material is likened to a two component grain made of a matrix of vacuum and inclusions of solid material. It is important to note that this theory is only valid for inclusions (considered as inhomogeneities into the matrix) small compared to the wavelength. If these conditions are fulfilled then the effective dielectric permettivity of the porous grain is then given by
| (18) |
where is the complex dielectric permettivity of the solid material (inclusions in the Maxwell-Garnett approach).
The real part of can be approximated by provided that . If the latter condition is fulfilled, then the Taylor expansion of with respect to the porosity gives
with and
Therefore, the grain size for which reaches a first maximum is
| (19) |
The corresponding size parameter is
| (20) |
References
- Augereau et al. (1999) Augereau, J. C., Lagrange, A. M., Mouillet, D., & Ménard, F. 1999, A&A, 350, L51
- Augereau et al. (2001) Augereau, J. C., Nelson, R. P., Lagrange, A. M., Papaloizou, J. C. B., Mouillet, D., 2001, A&A 370, 447
- Augereau et al. (2003) Augereau, J. C., Dutrey, A., Lagrange, A. M., Forveille, T., 2003, to be submitted
- Binney & Tremaine (1987) Binney, J. & Tremaine, S. 1987, “Galactic dynamics”, Princeton University Press
- Boccaletti et al. (2003) Boccaletti, A., Augereau, J. C., Marchis, F., & Hahn, J. 2003, ApJ, 585, 494
- Bohren & Huffman (1983) Bohren, C. F. & Huffman, D. R. 1983, New York: Wiley, 1983,
- Bouwman, de Koter, Dominik, & Waters (2003) Bouwman, J., de Koter, A., Dominik, C., & Waters, L. B. F. M. 2003, A&A, 401, 577
- Brittain & Rettig (2002) Brittain, S. D. & Rettig, T. W. 2002, Nature, 418, 57
- Brownlee (1985) Brownlee, D. E. 1985, Annual Review of Earth and Planetary Sciences, 13, 147
- Calvet et al. (2002) Calvet, N., D’Alessio, P., Hartmann, L., Wilner, D., Walsh, A., & Sitko, M. 2002, ApJ, 568, 1008
- Clampin et al. (2003) Clampin, M. et al. 2003, AJ, 126, 385
- Clayton et al. (2003) Clayton, G. C., Wolff, M. J., Sofia, U. J., Gordon, K. D., & Misselt, K. A. 2003, ApJ, 588, 871
- Fisher et al. (2000) Fisher, R. S., Telesco, C. M., Piña, R. K., Knacke, R. F., & Wyatt, M. C. 2000, ApJ, 532, L141
- Greenberg & Hage (1990) Greenberg, J. M. & Hage, J. I. 1990, ApJ, 361, 260
- Kimura, Kolokolova, & Mann (2003) Kimura, H., Kolokolova, L., & Mann, I. 2003, A&A, 407, L5
- Krivov, Mann, & Krivova (2000) Krivov, A. V., Mann, I., & Krivova, N. A. 2000, A&A, 362, 1127
- Laor & Draine (1993) Laor, A., & Draine, B.T. 1993, ApJ402,441
- Larwood & Kalas (2001) Larwood, J. D. & Kalas, P. G. 2001, MNRAS, 323, 402
- Lecavelier Des Etangs et al. (1993) Lecavelier Des Etangs, A. et al. 1993, A&A, 274, 877
- Li & Greenberg (1997) Li, A. & Greenberg, J. M. 1997, A&A, 323, 566
- Li & Lunine (2003) Li, A. & Lunine, J. I. 2003, ApJ, 594
- Marsh et al. (2002) Marsh, K. A., Silverstone, M. D., Becklin, E. E., Koerner, D. W., Werner, M. W., Weinberger, A. J., & Ressler, M. E. 2002, ApJ, 573, 425
- Merín et al. (2003) Merín, B., Montesinos, B., Eiroa, C., Solano, E., Mora, A., et al. 2003, A&A, submitted
- Mouillet et al. (1997) Mouillet, D., Larwood, J. D., Papaloizou, J. C. B., & Lagrange, A. M. 1997, MNRAS, 292, 896
- Mouillet et al. (2001) Mouillet, D., Lagrange, A. M., Augereau, J. C., & Ménard, F. 2001, A&A, 372, L61
- Ozernoy et al. (2000) Ozernoy, L. M., Gorkavyi, N. N., Mather, J. C., & Taidakova, T. A. 2000, ApJ, 537, L147
- Papaloizou & Pringle (1977) Papaloizou, J. & Pringle, J.E. 1977 MNRAS, 181, 441
- Quillen & Thorndike (2002) Quillen, A. C. & Thorndike, S. 2002, ApJ, 578, L149
- Takeuchi & Artymowicz (2001) Takeuchi, T. & Artymowicz, P. 2001, ApJ, 557, 990
- Terquem & Papaloizou (2002) Terquem, C. & Papaloizou, J. C. B. 2002, MNRAS, 332, L39
- Thébault, Augereau, & Beust (2003) Thébault, P., Augereau, J. C., & Beust, H. 2003, A&A, 408, 775
- Weinberger et al. (1999) Weinberger, A. J., Becklin, E. E., Schneider, G., Smith, B. A., Lowrance, P. J., Silverstone, M. D., Zuckerman, B., & Terrile, R. J. 1999, ApJ, 525, L53
- Weinberger et al. (2000) Weinberger, A. J., Rich, R. M., Becklin, E. E., Zuckerman, B., & Matthews, K. 2000, ApJ, 544, 937
- Weingartner & Draine (2001) Weingartner, J. C. & Draine, B. T. 2001, ApJ, 548, 296
- Wyatt et al. (1999) Wyatt, M. C., Dermott, S. F., Telesco, C. M., Fisher, R. S., Grogan, K., Holmes, E. K., & Piña, R. K. 1999, ApJ, 527, 918
- Wyatt & Dent (2002) Wyatt, M. C. & Dent, W. R. F. 2002, MNRAS, 334, 589
- Wyatt (2003) Wyatt, M. C. 2003, ApJ, 598
- Zuckerman et al. (1995) Zuckerman, B., Forveille, T., & Kastner, J. H. 1995, Nature, 373, 494