Thermal and Non-thermal X-Rays from the LMC Super Bubble 30 Dor C
Abstract
We report on the discovery of thermal and non-thermal X-rays from the shells of the super bubble (SB) 30 Dor C in the Large Magellanic Cloud (LMC). The X-ray morphology is a nearly circular shell with a radius of 40 pc, which is bright on the northern and western sides. The spectra of the shells are different from region to region. The southern shell shows clear emission lines, and is well fitted with a model of a thin-thermal plasma ( keV) in non-equilibrium ionization (NEI) plus a power-law component. This thermal plasma is located inside of the H emission, which is the outer edge of the shell of the SB. The northern and western sides of the SB are dim in H emission, but are bright in non-thermal (power-law) X-rays with a photon index of 2.1–2.9. The non-thermal X-ray shell traces the outer boundary of the radio shell. These features of thin-thermal and non-thermal X-rays are similar to those of SN 1006, a prototype of synchrotron X-ray shell, but the non-thermal component of 30 Dor C is about ten-times brighter than that of SN 1006. 30 Dor C is the first candidate of an extragalactic SB, in which energetic electrons are accelerating in the shell. The age is much older than that of SN 1006, and hence the particle acceleration time in this SB may be longer than those in normal shell-like SNRs. We found point-like sources associated with some of tight star clusters. The X-ray luminosity and spectrum are consistent with those of young clusters of massive stars. Point-like sources with non-thermal spectra are also found in the SB. These may be background objects (AGNs) or stellar remnants (neutron stars or black holes).
1 Introduction
Since the discovery of cosmic rays (Hess, 1912), the sites and mechanisms of cosmic ray acceleration up to the knee energy, which is a spectral kink of cosmic rays at eV, have been key problems. The most plausible scenario is diffusive shock acceleration (DSA) in the shock fronts of supernova remnants (SNRs) (Bell, 1978; Blandford & Ostriker, 1978); in this scenario, particles receive energy whenever they cross the shock from downstream to upstream.
Koyama et al. (1995) discovered synchrotron X-rays from the shock front of SN 1006, and confirmed that the SNR accelerates cosmic rays up to TeV, together with the discovery of inverse Compton TeV -rays (Tanimori et al., 1998), which helps us to estimate the magnetic field and the maximum energy of electrons. Non-thermal X-rays are the best tracer of cosmic ray acceleration sites. In fact, several Galactic SNRs have already been confirmed as cosmic ray accelerators using hard X-rays (SN 1006; Koyama et al. 1995, Long et al. 2003, Bamba et al. 2003b, G347.30.5; Koyama et al. 1997, Slane et al. 1999, RCW 86; Bamba et al. 2000, Borkowski et al. 2001b, Rho et al. 2002, G266.21.2; Slane et al. 2001, Cas A; Vink & Laming 2003, and Tycho; Hwang et al. 2002). The ASCA Galactic plane survey has also found some candidates (Bamba et al., 2001; Ueno et al., 2003; Bamba et al., 2003a). Although several Galactic SNRs have been confirmed to be sites of cosmic ray acceleration, some problems remain. For example, no SNR has been found in which cosmic rays are accelerated up to the knee energy. In fact, Reynolds & Keohane (1999) have suggested that the maximum energy of cosmic rays accelerated in SNRs is at most eV, an order of magnitude below the knee energy.
Super bubbles (SBs) are large hot cavities created by the combined actions of fast stellar winds and successive supernova (SN) explosions of massive stars in OB star associations. Thus, SBs are strong candidates for being sites where cosmic rays are accelerated to higher energies (c.f., Bykov & Fleishman 1992, Klepach, Ptuskin, & Zirakashvili 2000). However, it is difficult to study SBs in detail. Their distances, and thus their sizes and energies, remain uncertain in our Galaxy. Furthermore, interstellar absorption often prevents observations at optical, UV, and X-ray wavelengths. The Large Magellanic Cloud (LMC) provides an ideal location to examine the acceleration of cosmic rays in SBs because of its proximity (50 kpc; Feast 1999), low inclination angle (30°–40°; Westerlund 1997), and low foreground absorption ( mag; Bessel 1991).
The LMC provides a sample of numerous SBs at a common distance that is resolvable by modern X-ray detectors. For this study, we singled out 30 Dor C as being the best target for our search. A radio source was discovered by Le Marne (1968) south-west of 30 Dor, and was named 30 Dor C, which is now categorized as a SB. Mills et al. (1984) found a shell-like structure in the 843 MHz band observation with a radius of about 3′(40 pc on 50 kpc distance). Along the radio shell, complex H, H, and [SII] emissions were found, which are bright in the south-east, but dim in the other side (Mathewson et al., 1985). In the X-ray band, Einstein detected the eastern shell of the 30 Dor region for the first time (Long, Helfand, & Grabelsky, 1981; Chu & Mac Low, 1990). Dunne, Points, & Chu (2001) (hereafter, DPC) reported that the ROSAT spectrum required a thermal model with a rather high temperature (1 keV). Itoh et al. (2001) found non-thermal X-rays in the ASCA data, but could not spatially resolve the thermal and non-thermal components in the SB. Recently, Dennerl et al. (2000) found a complete ring in soft and hard X-rays with a diameter of 6′with XMM Newton. The hard X-rays from the shell resemble the synchrotron X-rays in the shock front of SNRs, which is a site of cosmic ray acceleration. Therefore, 30 Dor C would be the first and good candidate of cosmic ray accelerating SBs.
In this paper, we report on the first results of spatially resolved hard X-ray spectral analyses of 30 Dor C using Chandra and XMM-Newton data. In §2, we describe the data and their reduction. We analyze the data in §3, followed by a discussion in §4, and a summary in §5. The distance to the LMC is assumed to be 50 kpc (Feast, 1999).
2 Observations and Data Reduction
Chandra observed SN 1987A several times with the Advanced CCD Imaging Spectrometer (ACIS) S array; the satellite has an excellent spatial resolution (0.5″ on the aim-point), and one CCD has a field of view (FOV) of ′8.5′, an energy range of 0.3–10.0 keV, and an energy resolution of 130 eV at 5.9 keV. The details for the satellite and the instruments are described by Garmire et al. (2000) and Weisskopf et al. (2002), respectively. Some of the SN 1987A observations covered the 30 Dor C region by chance, which is located at about 5′ northeast from SN 1987A. In order to study the diffuse structure of 30 Dor C, we selected two observations in which the grating instrument is removed from the X-ray mirror axis (Observation ID = 1044 and 1967; hereafter Obs.1 and 2). The observed dates and targeted positions are given in Table 1. Data acquisition from the ACIS was made in the Timed-Exposure Faint mode with a readout time of 3.24 s in both observations. The data reductions and analyses were made using the Chandra Interactive Analysis of Observations (CIAO) software version 2.3. For a Level-1 processed events provided by a pipeline processing at the Chandra X-ray Center, we made a Charge Transfer Inefficiency (CTI) correction, and selected ASCA grades 0, 2, 3, 4, and 6, as the X-ray events. High-energy events due to charged particles and hot and flickering pixels were removed. There are some “streaks” in the CCD chip S4, which are caused by a random deposition of a significant amount of charges in pixels along the row during the serial read-out process. These “streak” events were removed by using the program destreak111See http://asc.harvard.edu/ciao2.3/ahelp/destreak.html. in CIAO. The total available times for each observation, after the screening, are listed in Table 1.
XMM-Newton (Jansen et al., 2001) also observed SN 1987A and the 30 Dor region several times; the satellite has a spatial resolution of 14″ and a relatively wide FOV with the radius of 15′. We selected two observations (Observation ID = 0104660301 and 0113020201; hereafter Obs.3 and 4), which cover 30 Dor C and are relatively free from high background flares due to low-energy protons. The observed dates and targeted positions are shown in Table 1. In both observations, only the metal oxide semiconductors (MOS) CCDs, which have an energy range of 0.1–10.0 keV and a similar energy resolution to Chandra, (Turner et al., 2001) were operated in the full-frame mode with the medium filter (Stephan et al., 1996; Villa et al., 1998) for blocking ultra-violet photons. The data reductions and analyses were made using the XMM-Newton Standard Analysis System (SAS; Watson et al 2001) version 5.4.1; we performed the basic pipeline process following the SAS guide. The background level was largely changed, particularly in Obs. 4, hence we removed the data with a high background level (0.6 cnts s-1 in the 10.0–15.0 keV band). The exposure times in each observation after the screenings are listed in Table 1.
3 Analyses and Results
3.1 Diffuse Emission and Point-like Sources
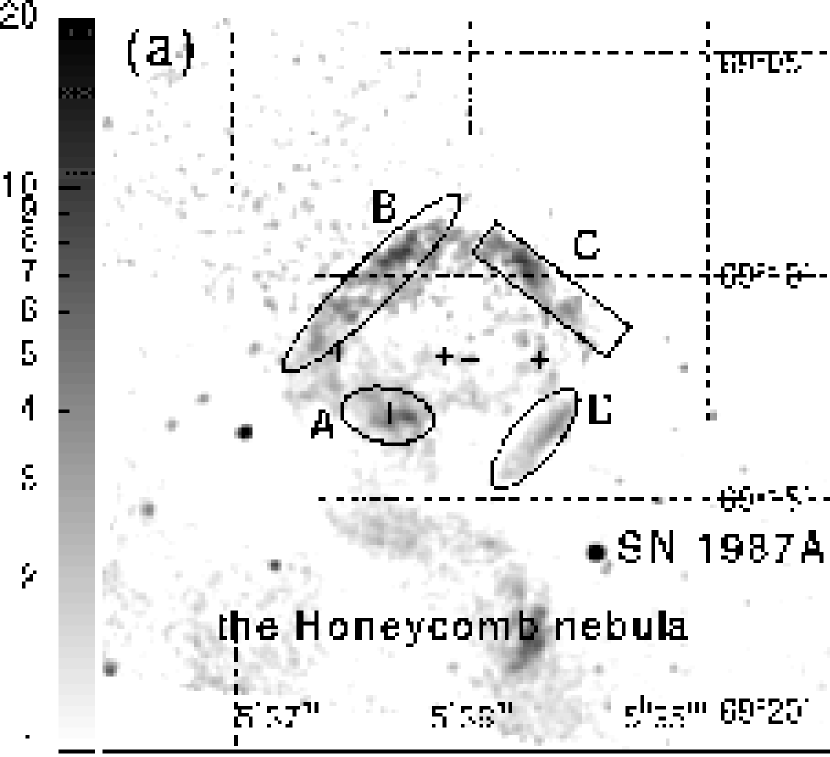
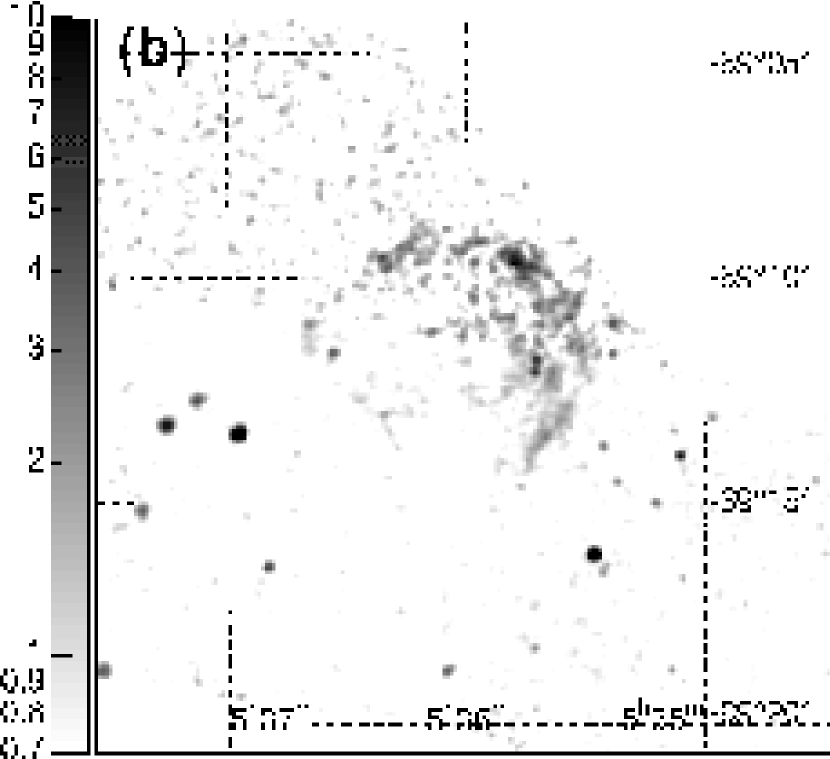
Figure 1 shows the soft (0.7–2.0 keV) and hard (2.0–7.0 keV) band Chandra images around 30 Dor C, in which the two observations (Obs.1 and 2) are combined with a correction of the exposure times. A clear shell-like structure with a radius of 170″ ( pc-radius at the 50 kpc distance) is seen in both bands. In detail, however, the morphologies are different from each other; the entire shell is seen in the soft band, whereas the hard X-rays are visible only at the western part. Catalogued SNRs, the Honeycomb nebula (SNR 053669.3) and SN 1987A are also seen mainly in the soft band (see Figure 1). The X-ray features of these objects have been reported with XMM-Newton (Dennerl et al., 2000) and Chandra (Burrows et al., 2000; Park et al., 2002; Michael et al., 2002) monitoring observations.
In addition to the diffuse structure, some point-like sources are found inside 30 Dor C. The exposure time of the XMM-Newton observations are short, most of the data suffer from a high background, and the spatial resolution is not sufficient. Hence, we concentrated on the Chandra data for the point-source search and analysis. At first, point sources were searched for with the wavdetect softwarein the 0.5–8.0 keV band images, then manually inspected for any spurious point-like structure due mainly to a part of the diffuse emission. We thus found six point sources with a significance level of 7.0, as shown in Figure 1 and Table 2. For these six point sources, we searched for optical, infrared, and radio counterparts, and found that three (No.1, 3, and 4) coincide at the positions of the brightest star clusters: , , and (Lortet & Testor, 1984). We therefore checked further for any X-ray emission from the other clusters (, , and ), which are also members of the OB association LH 90 (Lucke & Hodge, 1970) encompassed by the 30 Dor C shell. However, we found no excess X-rays from these clusters at the 3 limit. We also searched for X-ray counterparts from ROSAT PSPC and HRI catalogues (Haberl & Pietsch, 1999; Sasaki, Haberl, & Pietsch, 2000), but found no candidate.
3.2 Spectra
In the Chandra observations, we can see that the diffuse structure consists of several shell fragments (see Figure 1), and the whole structure is widely spread over the two observed regions with different configurations of the CCD types (back-illuminated and front-illuminated). Therefore, a spectral analysis on all of the diffuse structure is technically and scientifically complicated. For this reason, we divided the diffuse structure into four regions (hereafter shells A–D), as shown in Figure 1, and performed the spectral analysis separately for each shell. We excluded all of the detected point sources (see §3.1) from each shell. The background regions were also selected separately for each shell from the source-free regions in the same CCD and observations as those of the shells.
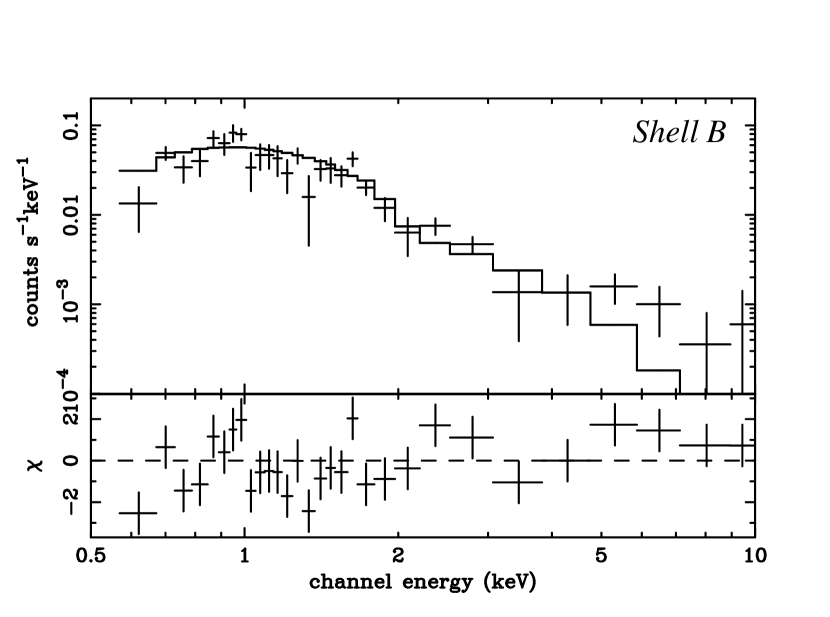
The XMM-Newton fields covered the whole diffuse structure. However, for consistency with the Chandra analysis, we divided the diffuse structure into shells A–D, the same as in the Chandra case. The background regions were selected from the source-free regions in the same observation. The spectra of each shell taken from all the available observations with Chandra and XMM-Newton were analyzed simultaneously. However, for brevity, we show only the Chandra spectra (background-subtracted) and the fitting results in Figure 2.
For spectral analyses, we used XSPEC v11.00 (Arnaud, 1996) The spectrum of shell A shows many line-like structures with the center energies at 0.58, 0.68, 0.92, and 1.35 keV, which correspond to the emission lines of He-like O K and K, He-like Ne, and He-like Mg, respectively. We therefore fit the spectrum with a thin-thermal plasma model in non-equilibrium ionization (NEI) (NEI; Borkowski et al. 2001a) with the mean LMC abundances (Russel & Dopita, 1992; Hughes, Hayashi, & Koyama, 1998). The interstellar absorption in our Galaxy and LMC were treated separately. The Galactic absorption column was estimated using the HI data by Dickey & Lockman (1990) as cm-2. Arabadjis & Bregman (1999) reported that the value of , measured in the X-ray band, is twice that of in the case of and cm-2. Therefore, we fixed the galactic absorption column to be cm-2; we used the cross sections by Morrison & McCammon (1983) and the solar abundances (Anders & Grevesse, 1989). The absorption column in the LMC was, on the other hand, treated as a free parameter with the mean LMC abundance (Russel & Dopita, 1992; Hughes, Hayashi, & Koyama, 1998).
This thin-thermal plasma model was rejected with a /degree of freedom (d.o.f.) = 331.8/211, even if we allow the abundances to be free, leaving a systematic data residual at the high-energy band. We hence added a power-law component on the thin-thermal model. Since the two-component model still leaves large residuals at about 0.8 keV and 1.3 keV, we allowed the abundance of Fe and Mg in the thermal plasma (“NEI” component) to be free. The fitting was then greatly improved with a /d.o.f = 264.6/209. Although this two-component model is still rejected in a statistical point of view, further fine tuning on the model is beyond the scope of this paper. Figure 2 and Table 3 show the best-fit models and parameters, respectively.
Unlike shell A, the X-ray spectra of shells B–D are hard and featureless, suggesting non-thermal origin. In fact, a thin thermal model fitting requires an unrealistically high temperature ( 2 keV) and low abundances (). We therefore fitted the spectra with a power-law model with absorption, which was calculated in the same way as that for shell A, and found acceptable fits for all of the spectra. The best-fit models and parameters are shown in Figure 2 and Table 4, respectively.
It is conceivable that the spectra of shells B–D may include a small fraction of the thin-thermal component found in shell A. We therefore added the same thin-thermal spectrum as that for shell A, and fitted with this composite model (thin-thermal plus power-law). The free parameters are normalizations of the two components: power-law index and value. However, no significant fraction of the thin thermal component is found from shells B–D.
For all of the point sources, the X-ray photons are collected from an ellipse with the radii of the point spread function (PSF), as listed in Table 2. We note that all of the sources are located far from the on-axis position of the X-ray mirror, and hence the PSFs are larger than the best value of Chandra PSF ( 0.5″on the aim point). The background regions were selected from source-free regions in the same way as the diffuse emissions. We first fitted the spectra with a thin-thermal plasma model in collisional equilibrium (MEKAL; Mewe, Gronenschild, & van den Oord 1985; Kaastra 1992) with an absorption calculated in the same way as diffuse emission. The abundances are fixed to be 0.3 solar, the average value of interstellar medium in the LMC. The fittings are acceptable for two sources (No. 1 and 4) with reasonable temperature (2.1 and 1.0 keV), but for the spectra of the other 4 sources, the models are either rejected or require an unreasonably high temperature. We therefore fitted the spectra of these sources with a power-law model. The best-fit parameters and the reduced s are listed in Table 2.
4 Discussion
4.1 The absorption
The absorption columns of the north-eastern shells (shells A and B) are similar to those of most sources in the LMC ( cm-2), whereas those of the other shells (C and D) are significantly larger ( cm-2) than the typical LMC absorption. A similar trend was found for the point sources; those in the western half, No.1 and 2, have a larger ( cm-2) than those in the eastern sources, No.3–6 ( cm-2). Since DPC (2001) has already reported this tendency, we have thus confirmed the results with the better spatial and spectral capability of Chandra. This systematic increase of absorption toward the western region of 30 Dor C may be due to extra absorption of a molecular cloud located in front of the western half of 30 Dor C. To verify our conjecture, we searched for the molecular cloud in the CO map (Figure 2(a) in Yamaguchi et al. 2001) and found the candidate with the intensity of (CO) K km s-1. With a conversion factor of cm-2(K km s-1)-1 (Fukui et al., 1999), the estimated absorption column due to the molecular cloud is cm-2, which is consistent with our result.
4.2 The Thermal Emission
30 Dor C is a SB made by a strong stellar wind and/or successive supernova explosions of massive stars located in the OB star association LH 90. The age of this star association, or that of 30 Dor C, is on the order of a few to 10 Myr (Lucke & Hodge, 1970). The thermal emissions are enhanced in the south-eastern side of 30 Dor C (around shell A). The position of this component coincides with that of the H emission (DPC, 2001). The plasma temperature of 30 Dor C is rather high compared to those of other LMC SBs (DPC, 2001), although it becomes significantly lower than previous results (DPC, 2001). Perhaps due to the poor spectral resolution of ROSAT, previous observations could not resolve the power-law component (hard spectrum) from the thermal emission.
The X-ray luminosity of 30 Dor C is significantly lower than that of the other SBs (DPC, 2001). With the assumption that the plasma in shell A distributes uniformly in the ellipsoid with radii of (total volume cm3), the mean density (), thermal energy () and the age of the plasma () were calculated as follows using the emission measure and ionization time scale (see Table 3):
| (1) | |||||
| (2) | |||||
| (3) |
Together with the H emission around shell A (DPC, 2001), we infer that the shell of 30 Dor C collides with dense matter and temporally emits thermal X-rays with a relatively high temperature. The overabundance of a light element (Mg) relative to heavier element (Fe) may indicate that a type II SN occurred (Tsujimoto et al., 1995). Thus, the progenitor is a massive star which is a member of cluster LH 90 (Lucke & Hodge, 1970) near the center of 30 Dor C (see section §4.4).
4.3 The Non-Thermal Emission
In the 843 MHz band, Mills et al. (1984) found a clear radio shell, which is brightest on the south-western side (around shells C and D) and dim on the eastern side. The non-thermal X-ray emissions are enhanced at the radio bright shell. This fact implies that the non-thermal X-rays are emitted by the same mechanism as the radio band. Therefore, the non-thermal X-rays are likely to be synchrotron radiation from the accelerated electrons, like SN 1006 (Koyama et al., 1995) and other SNRs, which accelerate particles up to TeV. The X-ray photon index of 2.1–2.9 (see Table 4) is, in fact, typical to synchrotron emissions.
To verify the synchrotron origin, we fitted the X-ray spectra with a SRCUT model, which represents the synchrotron emission from electrons with an energy distribution of a power-law plus exponential cut-off (Reynolds, 1998; Reynolds & Keohane, 1999). Since the radio index data is not accurate due to the large background and contamination of thermal emission (Mathewson et al., 1985), we fixed the spectral index () at 1 GHz to be 0.5, which is expected from the first-order Fermi acceleration and similar to that of SN 1006 (; Allen, Petre, Gotthelf 2001).
The fittings were statistically acceptable, and the best-fit parameters are listed in Table 4. The best-fit cut-off frequency is also similar to that of SN 1006, although the age of 30 Dor C may be on the same order as that of LH 90 (10 Myr; Lucke & Hodge 1970), which is far larger than SN 1006. This implies that, depending on the environment, the acceleration of high-energy electrons up to the knee energy can continue for a far longer time than the previous consensus for the SNR case ( yrs; Reynolds and Keohane 1999). The electron acceleration time may have been extended, because successive supernova explosions in 30 Dor C, possibly over the course of a few Myr, may more-or-less continuously produce high-energy electrons. The total luminosity of the non-thermal component ( ergs s-1) is about 10-times larger than that of SN 1006 (Koyama et al., 1995). This large non-thermal flux in 30 Dor C would be due to the large energy supply by multiple successive supernova explosions.
The expected flux density at 1 GHz is 3.0 (2.4–4.6) Jy with , which is significantly smaller than the observed value (1.0 Jy; Mills et al. 1984). This “inconsistency” is not relaxed, even if we assume a larger radio index of (1.8 (1.4–2.5)Jy, as shown in Table 4). We infer that the larger observed radio flux than that expected from X-rays would be due to either the contamination of thermal radio flux or a large uncertainty of the background level (see Mills et al. 1984).
The H emission (DPC, 2001) is anti-correlated with the non-thermal components. Similar features have been observed in some of other SNRs with synchrotron X-rays: SN 1006 (Winkler & Long, 1997) and RCW 86 (Smith, 1997). Because the H region has higher density, it may have a higher magnetic field. Therefore, the maximum electron energy is limited by the quick synchrotron energy loss, leading to reduced non-thermal X-rays.
4.4 Point Sources
We have identified three point-like X-ray sources (No. 1, 3, and 4) to the tight clusters of massive stars , , and , respectively. The spectrum of No.1 () is fitted with a thin thermal plasma model of 2.1 keV, which is consistent with stellar X-rays from massive stars. The cluster is the brightest of the three, with X-ray luminosity of ergs s-1. Optical spectroscopy of this cluster revealed that it includes one red giant and one Wolf-Rayet (WR) star (MG 41 and Brey 58; Lortet & Testor 1984). Hence, the latter is a possible counterpart of the 2 keV source. The X-ray luminosity is near to the upper end of a massive star, or its binary (Maeda et al., 1999). Although the X-ray luminosity of No.3, a counterpart of the star cluster , is also consistent with a massive young star, the best-fit photon index, 2 (see Table 2), is rather typical to a rotation powered neutron star, probably a stellar remnant of an SN explosion in the active star cluster. The spectrum of No.3 () is soft and well-fitted with a keV thermal plasma model, similar to a cluster . The star cluster also includes one OB star (Sk ; Sanduleak 1970), and the X-ray luminosity is consistent with that of a young massive star.
The other three sources (No,2, 5, 6) have no counterpart in optical, in the infrared band (Breysacher, 1981; Lortet & Testor, 1984) nor in the SIMBAD data base. Their spectra are relatively hard, and are consistent with being background active galactic nuclei (AGNs), or stellar remnants (black hole or neutron star) by successive SN explosions.
In order to constrain the nature of the point-like X-ray sources with a power-law spectrum, we further examined the time variability with the Kolmogorov-Smirnov test (Press et al., 1992). However, no significant time variability was found even between the two observations. For high resolution timing, we examined the Chandra High Resolution Camera (HRC) data (ObsID = 738), but no pulsation was found from any of these point sources.
5 Summary
(1) In the shell of the super bubble 30 Dor C, we resolved non-thermal and thermal X-rays using Chandra and XMM-Newton data.
(2) The thermal emission concentrates on the south-eastern shell of 30 Dor C. The spectrum is well represented by a thin thermal plasma model with 0.21 (0.19–0.23) keV and 0.47 (0.42–0.48) cm-3.
(3) The non-thermal X-rays are located at northern and western parts of the SB. The power-law model is well-fitted to the spectra with 2.1–2.9, similar to that of the cosmic ray accelerating SNR, SN 1006. This is the first discovery of non-thermal X-rays from the shells of SBs. The total luminosity is ten-times larger than that of SN 1006.
(4) We found six point-like sources in 30 Dor C. Three sources are located in tight clusters of massive stars, and therefore they may be active Wolf-Rayet stars or compact stars. The other three have power-law spectra with no optical counterpart, implying that they are background AGNs or compact remnants of SNe.
References
- Allen, Petre, & Gotthelf (2001) Allen, G.E., Petre, R., & Gotthelf, E.V. 2001, ApJ, 558, 739
- Anders & Grevesse (1989) Anders, E., & Grevesse, N. 1989, Geochim. Cosmochim. Acta, 53, 197
- Arabadjis & Bregman (1999) Arabadjis, J. S. & Bregman, J. N. 1999, ApJ, 510, 806
- Arnaud (1996) Arnaud, K. A. 1996, ASP Conf. Ser. 101: Astronomical Data Analysis Software and Systems V, 5, 17
- Bamba et al. (2000) Bamba, A., Tomida, H., & Koyama, K. 2000, PASJ, 52, 1157
- Bamba et al. (2001) Bamba, A., Ueno, M., Koyama, K., & Yamauchi, S. 2001, PASJ, 53, L21
- Bamba et al. (2003a) Bamba, A., Ueno, M., Koyama, K., & Yamauchi, S. 2003, ApJ, 589, 253
- Bamba et al. (2003b) Bamba, A., Yamazaki, R., Ueno, M., & Koyama, K. 2003, ApJ, 589, 827
- Bell (1978) Bell, A.R. 1978, MNRAS, 182, 443
- Bessell (1991) Bessell, M. S. 1991, A&A, 242, L17
- Blandford & Ostriker (1978) Blandford, R.D., & Ostriker, J.P. 1978, ApJ, 221, L29
- Borkowski et al. (2001a) Borkowski, K.J., Lyerly, W.J., & Reynolds, S.P. 2001a, ApJ, 548, 820
- Borkowski et al. (2001b) Borkowski, K.J., Rho, J., Reynolds, S.P. & Dyer, K.K. 2001b, ApJ, 550, 334
- Breysacher (1981) Breysacher, J. 1981, A&AS, 43, 203
- Burrows et al. (2000) Burrows, D. N. et al. 2000, ApJ, 543, L149
- Bykov & Fleishman (1992) Bykov, A. M. & Fleishman, G. D. 1992, MNRAS, 255, 269
- Chu & Mac Low (1990) Chu, Y. & Mac Low, M. 1990, ApJ, 365, 510
- Dennerl et al. (2000) Dennerl, K., Haberl, F., Aschenbach, B., Briel, U.G., Balasini, M., Bruninger, H., Burkert, W., Hartmann, R., et al. 2001, A&A, 365, L202
- Dickey & Lockman (1990) Dickey, J. M. & Lockman, F. J. 1990, ARA&A, 28, 215
- DPC (2001) Dunne, B.C., Points, S.D., & Chu, Y-H. 2001, ApJS, 136, 119
- Feast (1999) Feast, M. 1999, PASP, 111, 775
- Fukui et al. (1999) Fukui, Y. et al. 1999, PASJ, 51, 745
- Garmire et al. (2000) Garmire, G., Feigelson, E.D., Broos, P., Hillenbrand, L.A., Pravdo, S.H., Townsley, L.,& Tsuboi, Y. 2000, AJ, 120, 1426
- Haberl & Pietsch (1999) Haberl, F. & Pietsch, W. 1999, A&AS, 139, 277
- Hess (1912) Hess, V.F. 1912, Phys. Zeits., 13, 1084
- Hughes, Hayashi, & Koyama (1998) Hughes, J.P., Hayashi, I., & Koyama, K. 1998, ApJ, 505, 732
- Hwang et al. (2002) Hwang, U., Decourchelle, A., Holt, S. S., & Petre, R. 2002, ApJ, 581, 1101
- Itoh et al. (2001) Itoh, M., Tanaka, R., & Komatsu, H. 2001, PASPConf. Seri., 251, 250
- Jansen et al. (2001) Jansen, F., et al. 2001, A&A, 365, L1
- Kaastra (1992) Kaastra, J.S. 1992, An X-Ray Spectral Code for Optically Thin Plasmas (Internal SRON-Leiden Report, updated version 2.0)
- Kim et al. (1998) Kim, S., Staveley-Smith, L., Dopita, M. A., Freeman, K. C., Sault, R. J., Kesteven, M. J., & McConnell, D. 1998, ApJ, 503, 674
- Klepach, Ptuskin, & Zirakashvili (2000) Klepach, E. G., Ptuskin, V. S., & Zirakashvili, V. N. 2000, Astroparticle Physics, 13, 161
- Koyama et al. (1997) Koyama, K., Kinugasa, K., Matsuzaki, K., Nishiuchi, M., Sugizaki, M., Torii, K., Yamauchi, S., & Aschenbach, B. 1997, PASJ, 49, L7
- Koyama et al. (1995) Koyama, K., Petre, R., Gotthelf, E.V., Hwang, U., Matsura, M., Ozaki, M., & Holt S.S. 1995, Nature, 378, 255
- Le Marne (1968) Le Marne, A.E. 1968, MNRAS, 139, 461
- Long, Helfand, & Grabelsky (1981) Long, K.S., Helfand, D.J., & Grabelsky, D.A. 1981, ApJ, 248, 925
- Long et al. (2003) Long, K. S., Reynolds, S. P., Raymond, J. C., Winkler, P. F., Dyer, K. K., & Petre, R. 2003, ApJ, 586, 1162
- Lortet & Testor (1984) Lortet, M.C., & Testor, G. 1984, A&A, 139, 330
- Lucke & Hodge (1970) Lucke, P.B., & Hodge, P.W. 1970, AJ, 75, 171
- Maeda et al. (1999) Maeda, Y., Koyama, K., Yokogawa, J., & Skinner, S. 1999, ApJ, 510, 967
- Mathewson et al. (1985) Mathewson, D. S., Ford, V. L., Tuohy, I. R., Mills, B. Y., Turtle, A. J., & Helfand, D. J. 1985, ApJS, 58, 197
- Mewe, Gronenschild, & van den Oord (1985) Mewe, R., Gronenschild, E.H.B.M., & van den Oord, G.H.J. 1985, A&AS, 62, 197
- Michael et al. (2002) Michael, E. et al. 2002, ApJ, 574, 166
- Mills et al. (1984) Mills, B.Y., Turtle, A.J., Little, A.G., & Durdin, J.M. 1984, Australian Journal of Physics, 37, 321
- Morrison & McCammon (1983) Morrison, R., & McCammon, D. 1983, ApJ, 270, 119
- Park et al. (2002) Park, S., Burrows, D. N., Garmire, G. P., Nousek, J. A., McCray, R., Michael, E., & Zhekov, S. 2002, ApJ, 567, 314
- Press et al. (1992) Press, W.H., Teukolsky, S.A., Vetterling, W.T., & Flannery, B. P. 1992, Numerical Recipes in C (2d ed.; Cambridge: Cambridge Univ. Press)
- Reynolds (1998) Reynolds, S.P. 1998, ApJ, 493, 375
- Reynolds & Keohane (1999) Reynolds, S.P., & Keohane, J.W. 1999, ApJ, 525, 368
- Rho et al. (2002) Rho, J., Dyer, K. K., Borkowski, K. J., & Reynolds, S. P. 2002, ApJ, 581, 1116
- Russel & Dopita (1992) Russel, S.C., & Dopita, M.A. 1992, ApJ, 384, 508
- Sanduleak (1970) Sanduleak, N. 1970, Contributions from the Cerro Tololo Inter-American Observatory, 89
- Sasaki, Haberl, & Pietsch (2000) Sasaki, M., Haberl, F., & Pietsch, W. 2000, A&AS, 143, 391
- Slane et al. (1999) Slane, P., Gaensler, B. M., Dame, T. M., Hughes, J. P., Plucinsky, P. P., & Green, A. 1999, ApJ, 525, 357
- Slane et al. (2001) Slane, P., Hughes, J. P., Edgar, R. J., Plucinsky, P. P., Miyata, E., Tsunemi, H., Aschenbach, B. 2001, 548, 814
- Smith (1997) Smith R.C. 1997, AJ, 114, 2664
- Stephan et al. (1996) Stephan, K., Reppin, C., Hirschinger, M., Maier, H.J., Frischke, D. Fuchs, D., Mueller, P., Guertler, P. 1996, Proc. SPIE, 2808, 421
- Tanimori et al. (1998) Tanimori, T. et al. 1998, ApJ, 497, L25
- Tsujimoto et al. (1995) Tsujimoto, T., Nomoto, K., Yoshii, Y., Hashimoto, M., Yanagida, S., & Thielemann, F.-K. 1995, MNRAS, 277, 945
- Turner et al. (2001) Turner, M.J.L. et al. 2001, A&A, 365, L27
- Ueno et al. (2003) Ueno, M., Bamba, A., Koyama, K., & Ebisawa, K. 2003, ApJ, 588, 338
- Villa et al. (1998) Villa, G.E. et al. 1998, IEEE Trans. Nucl. Sci., 45, 921
- Vink & Laming (2003) Vink, J. & Laming, J. M. 2003, ApJ, 584, 758
- Watson et al. (2001) Watson, M.G. et al. 2001, A&A, 365, L27
- Weisskopf et al. (2002) Weisskopf, M. C., Brinkman, B., Canizares, C., Garmire, G., Murray, S., & Van Speybroeck, L. P. 2002, PASP, 114, 1
- Westerlund (1997) Westerlund, B. E. 1997, The Magellanic Clouds (Cambridge: Cambridge Univ. Press)
- Winkler & Long (1997) Winkler, P.F. & Long, K.S. 1997, ApJ, 491, 829
- Yamaguchi et al. (2001) Yamaguchi, R., Mizuno, N., Onishi, T., Mizuno, A., & Fukui, Y. 2001, PASJ, 53, 959


| Satellite | Obs ID | Position (J2000) | Date | Exposure | |
|---|---|---|---|---|---|
| (RA, DEC) | (yyyy/mm/dd) | (ks) | |||
| Obs.1 | Chandra | 1044 | (, ) | 2001/04/25 | 18 |
| Obs.2 | Chandra | 1967 | (, ) | 2000/12/07 | 99 |
| Obs.3 | XMM-Newton | 0104660301 | (, ) | 2000/11/25 | 21 |
| Obs.4 | XMM-Newton | 0113020201 | (, ) | 2001/11/19 | 16 |
| No. | Name | PSFbbThe elliptic PSF size. | SMccSpectral model; PL: power-law, MK: thin thermal plasma in collisional equilibrium (Mewe, Gronenschild, & van den Oord, 1985; Kaastra, 1992) with the abundance of 0.3 solar. | ddAbsorption column in the LMC. The abundance is assumed to the average LMC values (Russel & Dopita, 1992; Hughes, Hayashi, & Koyama, 1998). | FluxeeAbsorbed flux in the 0.5–9.0 keV band. | LuminosityffIntrinsic luminosity (absorptions are removed) in the 0.5–9.0 keV band, at the LMC distance of 50 kpc (Feast, 1999). | /d.o.f. | |
|---|---|---|---|---|---|---|---|---|
| CXO J05… | arcsecarcsec | /[keV] | [ergs cm-2s-1] | [ergs s-1] | ||||
| 1 | 3542.4691152 | MK | 2.1 (1.4–3.6) | 3.5 (2.5–5.1) | 1.2 | 9.53/12 | ||
| 2 | 3542.9691206 | PL | 2.1 (1.4–3.2) | 7.7 (4.4–13) | 1.5 | 8.25/13 | ||
| 3 | 3559.9691150 | PL | 1.7 (1.3–2.6) | 0.13 ( 1.3) | 2.2 | 4.03/7 | ||
| 4 | 3606.6691147 | MK | 1.0 (0.19–1.3) | 0 ( 1.9) | 1.1 | 8.64/9 | ||
| 5 | 3620.7691303 | PL | 1.9 (1.5–2.4) | 0 () | 8.9 | 3.1 | 19.8/20 | |
| 6 | 3633.3691140 | PL | 1.8 (1.5–2.3) | 0.5 (0.08–1.1) | 7.8 | 21.4/18 |
Note. — No.1, 3 and 4 have the optical counterparts, the stellar clusters , , and respectively (Lortet & Testor, 1984).
| Parameters | NEI | Power-law |
|---|---|---|
| / [keV/—] | 0.21 (0.19–0.23) | 2.9 (2.7–3.1) |
| bbIonization time-scale, where and are the electron density and age of the plasma. [cm-3s] | 9.9 (1.4) | |
| ccEmission measure , where and are the proton density and the plasma volume, respectively. The distance to LMC is assumed to be 50 kpc. [1058 cm-3] | 2.6 (2.1–2.8) | |
| ddAbundance ratio relative to the solar value (Anders & Grevesse, 1989). | 3.3 (2.5–4.0) | |
| ddAbundance ratio relative to the solar value (Anders & Grevesse, 1989). | 0.10 (0.06–0.14) | |
| FluxeeAbsorbed flux in the 0.5–9.0 keV band. [ergs cm-2s-1] | ||
| ffAbsorption column in the LMC. The abundances are assumed to be the average LMC values (Russel & Dopita, 1992; Hughes, Hayashi, & Koyama, 1998). [ cm-2] | 0.24 (0.21–0.28) | ggFixed to the same value as that for the NEI component. |
| B | C | D | |
|---|---|---|---|
| Power-law | |||
| Photon Index | 2.7 (2.5–2.9) | 2.3 (2.1–2.4) | 2.5 (2.3–2.7) |
| FluxbbFlux in the 0.5–9.0 keV band. [ergs s-1cm-2] | |||
| [1022 cm-2]ccAbsorption column in the LMC. The abundances are assumed to be the average LMC values (Russel & Dopita, 1992; Hughes, Hayashi, & Koyama, 1998). | 0.10 (0.06–0.19) | 1.1 (0.94–1.4) | 1.0 (0.85–1.3) |
| /d.o.f. | 193.0/138 | 68.3/84 | 121.5/110 |
| SRCUT | |||
| [ Hz] | 6.2 (4.1–7.9) | 24 (15–47) | 12 (6.4–23) |
| Flux density at 1 GHz [Jy] | 1.9 (1.5–3.0) | 0.71 (0.67–0.75) | 0.42 (0.25–0.83) |
| [1022 cm-2]ccAbsorption column in the LMC. The abundances are assumed to be the average LMC values (Russel & Dopita, 1992; Hughes, Hayashi, & Koyama, 1998). | (0.04) | 1.0 (0.90–1.1) | 0.89 (0.75–1.0) |
| /d.o.f. | 195.5/138 | 67.0/84 | 120.2/110 |
| SRCUT | |||
| [ Hz] | 8.0 (5.3–11) | 36 (20–75) | 16 (8.3–35) |
| Flux density at 1 GHz [Jy] | 11 (8.2–16) | 4.1 (3.9–4.3) | 2.5 (1.6–4.6) |
| [1022 cm-2]ccAbsorption column in the LMC. The abundances are assumed to be the average LMC values (Russel & Dopita, 1992; Hughes, Hayashi, & Koyama, 1998). | (0.01) | 1.0 (0.91–1.2) | 1.1 (1.0–1.3) |
| /d.o.f. | 195.2/138 | 67.1/84 | 121.8/110 |