CO emission associated with a cooling flow
1 Abstract
The existence of cooling flows in the center of galaxy clusters has always been a puzzle, and in particular the fate of the cooling gas, since the presence of cold gas has never been proven directly. X-ray data from the satellites Chandra and XMM-Newton have constrained the amount of cooling, and it was realized that feedback and heating from a central AGN and its jets could reduce the amount of cold gas. Recently, a few central galaxies of cooling flow clusters have been detected in the CO lines. For the first time, we show IRAM interferometer maps of CO(1-0) and CO(2-1) emission in a cooling flow, showing a clear association of the cold gas (at about 20K) with the cooling flow. This shows that although the AGN provides a feedback heating, the cooling phenomenon does occur, with about the expected rate.
2 Recent results on cooling flows
Cooling flows are suspected to occur in the center of rich galaxy clusters, since the cooling time of the hot gas is shorter than Hubble time. Until recently, large flow rates were expected, of the order of 100 to 1000 M⊙/yr. But the fate of the cooled gas has always been a mystery, the gas or the stars formed out of it could not be seen. Attempts to observe this cold gas either in HI (Shostak et al 1983, Dwarakanath et al 1995) or CO (McNamara et al 1994, Braine & Dupraz 1994, O’Dea et al 1994), have always obtained upper limits. Only in NGC1275 (Perseus A) has molecular gas been detected (Lazareff et al 1989), but being associated to merging galaxies, its origin was ambiguous. Recently, CO emission has been detected in 3C31 (RXJ0107+32) and 3C264 (A1367) at the center of cooling flows (Lim et al 2001), and towards 16 central galaxies of clusters (Edge 2001).
One of the main results of the X-ray satellites Chandra and XMM-Newton was to change considerably our view on cooling flows: the deduced cooling rates have been reduced by at least one order of magnitude; the old view of quiet and regular, quasi-spherical cooling has given place to partial and intermittent cooling, perturbed by re-heating processes, feedback due to the central AGN, and associated shocks, jets, sound waves, bubbles… A recent spectacular illustration of this perturbed cooling is the Chandra image of the cooling flow in Perseus, with bubbles, gas streaming up and down from the center, and ripples looking like emitted sound waves (Fabian et al. 2003).
3 Detection of CO emission
We have undertaken a survey of CO emission in central galaxies of cooling flow clusters (Salomé & Combes 2003a), with the IRAM-30m telescope. The clusters were selected from their previously derived cooling rates, and their observed H luminosities. It is indeed expected that the H emission is also related to the cooling, either diretly or because gas is photoionised by stars formed in the cooling. Out of 32 galaxies observed, between 6 and 10 detections were obtained (according to whether both CO(1-0) and CO(2-1) detected, or a tentative single one). Masses between 3 108 and 4 1010M⊙ are found. The excitation derived from the ratio of the two first rotational lines of the CO molecule is compatible with optically thick cold gas (beam corrected ratio close to 1, within the uncertainties).
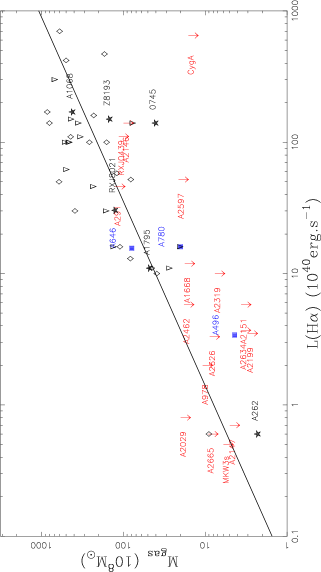
Figure 1 reveals a correlation between the H2 mass detected toward cooling flows, and their H luminosity. This may be interpreted in terms of common excitation mechanisms, H is either shocked gas from cooling flows or gas photo-ionized by the young stars formed out of the cooled gas.
It is also interesting to compare the amount of gas detected to what is expected from the cooling flow. With respect to the cooling rates deduced from Einstein (White et al 1997), the CO gas reaches about 10% of the expected value. We have to note that the region observed with the IRAM beam is only the center of the cooling flow. The cooling region extends up to 10 times its radius, and the cooling mass inside a given radius grows linearly with radius. The H2 gas detected corresponds to cooling rates during 1 Gyr about 10 times less than the previously computed value.
Our results do not show any clear correlation with the radio flux at 1.4 GHz. However, it is clear that cooling flows help to fuel the central black hole, when there is one. About 71% of cD galaxies with cooling flow have an AGN, while only 23% of cD without cooling flow have one. It is important to try to derive the gas-to-dust ratio in the cooled gas, since dust is expected to be destroyed in the hot gas by sputtering. The cooled gas should be dust depleted. We have derived the dust mass from IRAS data (assuming a dust temperature of the order of 35K), and indeed, the dust-to-gas ratio was small. Cold dust observed at 1mm would yield clearer results, due to the lower temperature sensitivity, in the Rayleigh-Jeans domain.
4 Abell 1795 cooling flow
The Abell 1795 cluster (z=0.063) has a conspicuous cooling wake at its center in the form of a long (80kpc) North-South filament (Fabian et al 2001). The cooling time is about 300 Myr, and the cooling rate 100 M⊙/yr within 200kpc (Ettori et al 2002). The filament presents also H line emission (Cowie et al 1985), at the velocity of the cluster. The central cD galaxy is moving at V=374km/s with respect to the cluster, and this central oscillation is probably the origin of the wake.
We have mapped CO(1-0) and CO(2-1) emission with the IRAM interferometer with 3.2” and 1.8” beams respectively. The cold gas is clearly coincident with the cooling gas, both in X-ray and H, but not with any galaxy (Salomé & Combes 2003b). 3mm continuum emission is detected at the position of the AGN, with a flux of 7mJy corresponding to a synchrotron spectrum with slope -0.98. Figure 2 shows the very good coincidence between CO(2-1) and H line emission, and its avoidance of the radio jets. Cold gas may have deflected the expanding radio lobes, alternatively the jet creates a hole (bubble) in the hot gas, which is compressed at the boundaries, cools down and condenses in molecular gas.
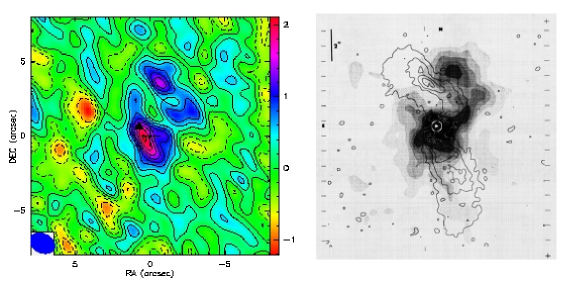
The interferometer retrieves only 20% of the 30m flux, which means that there exists an important extended CO emission, in addition to the mapped features. The total H2 mass is 4.8 109 M⊙. The CO kinematics confirm the association of the molecular gas with the cooling flow. The CO velocity is not associated to the central galaxy, but to the cluster (-350km/s), as is the H.
5 Conclusions
Out of 32 cooling flow galaxies observed, 6-10 were detected, with H2 masses up to 1010M⊙, increasing the total number to 23 (Edge 2001). The interferometer map of Abell 1795 shows CO clearly associated to the cooling wake, and not in rotation around the cD galaxy. The CO emission is closely associated to H, confirming the global CO-H correlation found with the single dish. The H2 mass found corresponds to what is expected from the cooling rate, 100 M⊙/yr within 200kpc. There is tight coupling between the AGN and the cold gas. The AGN creates cavities in the hot gas. Cooling occurs along the edges of cavities, where CO and H are observed.
References
- (1) Braine J., Dupraz C.: 1994, A&A 283, 407
- (2) Cowie, L. L., Hu, E. M., Jenkins, E. B., York, D G.: 1983 ApJ, 272, 29C
- (3) Dwarakanath K.S., Owen F.N., van Gorkom J.H.: 1995, ApJ 442, L1
- (4) Edge A.C.: 2001, MNRAS 328, 762
- (5) Ettori, S., Fabian, A. C., Allen, S. W. et al.: 2002 MNRAS 331, 635E
- (6) Fabian A.C., Sanders J.S., Ettori S. et al: 2001, MNRAS 321, L33
- (7) Fabian A.C., Sanders J.S., Allen, S. W. et al.: 2003, MNRAS 344, L43
- (8) Lazareff B., Castets, A., Kim, D.-W., Jura, M.: 1989, ApJ 336, L13
- (9) Lim J., Leon, S., Combes, F., Dinh-V-Trung: 2001, ApJ 545, L93
- (10) McNamara B.R., Jaffe W.: 1994, A&A 281, 673
- (11) O’Dea C.P., Baum S.A., Maloney P.M., et al.: 1994a, ApJ 422, 467
- (12) Salomé P., Combes F.: 2003a, A&A in press, 2003b, A&A, sub
- (13) Shostak G.S., van Gorkom J.H., Ekers R.D. et al.: 1983, A&A 119, L3
- (14) Van Breugel W., Heckman, T., Miley, G.: 1984, ApJ 276, 79
- (15) White D. A., Jones, C., Forman, W.: 1997, MNRAS 292, 419
Index
- Perseus §2