A Search for 6Li in Lithium-Poor Stars with Planets
Abstract
Using high-resolution, high quality spectra we investigate the presence of 6Li in two lithium-poor stars that host extrasolar planetary systems. We present improved atomic and molecular line lists for the region in the vicinity of the lithium line at 6707.8 Å, and we produce an excellent fit to the solar spectrum. From line profile fitting, we find results consistent with no 6Li in either of the lithium-poor planet-bearing stars or in three comparison stars with and without planets, and 1- upper limits of 0.04 for the isotopic ratios of the two lithium-poor stars give an upper limit of 0.3 Jupiter masses of material with primordial abundances that could have been recently deposited in their outer layers. Our results suggest that post-main sequence accretion of planets or planetary material that is undepleted in lithium is uncommon.
1 Introduction
To explain the presence of massive extrasolar planets very close to their parent stars, current formation models often incorporate orbital migration (Lin et al., 1996; Murray et al., 1998) and/or planetary scattering (Weidenschilling & Marzari, 1996; Rasio & Ford, 1996). A possible consequence of these processes would be the ingestion of planets or protoplanetary material into the atmosphere of the star if migration is not halted. It is theorized that this deposition of planetary material could be detected as excesses of rare elements, most notably the 6Li isotope. Theoretical calculations (Forestini, 1994; Proffitt & Michaud, 1989) predict that 6Li is completely destroyed in the pre-main sequence phase of stellar evolution for solar-mass stars, and anomalously high ratios of 6Li to 7Li in normal main- sequence stars could be an important diagnostic of planet formation processes.
However, if stellar pollution does occur in some fraction of planetary systems, there are additional systematic characteristics which could influence the measured ratio of 6Li to 7Li in a star. According to stellar theory, the elimination of 6Li during formation of a star is due to exposure to high temperatures at depth from convective circulation. Once the convective zone retreats, any remaining lithium will be slowly depleted over the lifetime of the star. Therefore the current abundance ratio depends on the stellar age and the spectral type (which determines the size of the convection zone). Accordingly, the detection probability would increase for younger, more massive stars and decrease for older, less massive ones. Also, the preservation of polluting material from a planet relies on the accretion of the planet occurring after the convection zone has retreated from the core, which in turn depends on the planet formation timescale, the efficiency of migration mechanisms, and the size and density of the planet that is accreted. Therefore, in order to constrain models of migration and the efficiency of absorption of planetary material into the outer atmosphere of a star, it is important to analyze a large sample of both lithium-rich and lithium- poor planet-bearing stars with a range of different ages and atmospheric characteristics.
Israelian et al. (2001) was the first group to report measurements of the lithium isotopic abundance ratio in a planet-bearing star. They observed HD 82943, a star with several close-in giant planets, as well as the star HD 91889 for comparison. Analysis of the 6707 Å lithium resonance line yielded the predicted result for HD 91889 (6Li/7Li), but for HD 82943 the ratio was determined to be 6Li/7Li. This interesting result was challenged by Reddy et al. (2002, hereafter R02), who observed HD 82943 as well as seven other stars hosting extra-solar planets and six comparison stars with similar atmospheric parameters. After applying their analysis to the Sun as well as another planet-bearing star with very low lithium abundance (16 Cyg B), they decided that additional unidentified metal lines in the lithium region were necessary for accurate modeling, and subsequently concluded that no 6Li was necessary to accurately model their observations. They attributed the discrepancy with Israelian et al. (2001) to the additional metal lines incorporated in their line analysis.
Israelian et al. (2003, hereafter I03) performed a reanalysis of HD 82943, investigating the role of the unidentified lines by measuring several stars of different effective temperature to monitor the strength of the line. They concluded that the Ti lines used by R02 are only adequate at higher effective temperatures, and decided that the Si identification by Müller et al. (1975) was a better fit. Using Si instead of Ti, I03 derived a new isotope ratio of 6Li/7Li.
The extensive yet inconclusive line analysis of recent work suggests that the detection of 6Li abundance enhancements in planet-bearing stars is fraught with obstacles. Analysis of the 6707 Å lithium region is difficult to begin with, due to a plethora of contributing blends from both metal lines and molecular CN. There are over 40 weak atomic lines identified within 2 Å around the lithium line, and there is evidence of many unknown sources of opacity. The effect of these lines is minimal when simply measuring the overall lithium abundance in lithium-rich stars. However, accurate line identifications become critical when attempting to detect the minute contributions from the weak 6Li isotope.
Observing stars with moderate to high lithium abundances mitigates some of these factors: the overall lithium feature and therefore the 6Li asymmetry are stronger, and contributions from weak blending lines become less important. However, since the measurement of anomalies in 6Li can only be judged through a measurement of anomalies in the ratio of 6Li to 7Li, a larger abundance of 7Li in the star means that the effect of adding 6Li through planet engulfment is reduced. Therefore an overabundance of 6Li that would change the overall ratio significantly in lithium-poor stars may not appear in lithium-rich stars. Conversely, if the deposition of planetary material into the outer layers of a star is significant during planetary migration, there may be correlations with overall lithium abundance and the presence of close-in giant planets (Sandquist et al., 2002). In addition, analysis of weak stellar lines with good quality data helps to illuminate underlying blending features and decreases the ambiguity between a valid detection of 6Li and an inaccurate line list. This point is especially salient since there are several different line lists postulated for the weak blending lines around the lithium line.
To this end, we have decided to concentrate on observing several bright planet- bearing stars with lower lithium abundances at very high S/N, and we have analyzed them using the various different viable line lists in order to discern the resulting differences in the quality of the synthetic profile fit and the final limits on the isotopic ratios. We have observed 47 Ursa Majoris and Upsilon Andromedae, two very bright lithium-poor stars with established detections of close-in extrasolar planets. To check our analysis techniques we have also analyzed HD 209458, a lithium-rich planet-bearing star that has been observed by R02, as well as several stars without known planets. We have achieved S/N per pixel of for 47 UMa and And and lower S/N for HD 209458 and the two comparison stars. We have also created a more detailed line list than was previously used, especially with regard to the underlying CN band. By analyzing the solar spectrum and a carbon arc spectrum and applying accurate theoretical wavelengths, we have enhanced the CN line list dramatically, and we have added additional atomic lines as well.
A summary of observations and a description of the reduction procedure is given in §2. In §3.1 we give a summary of the sources for the stellar atmospheric parameters used for the construction of synthetic spectra, and the procedure used to find the broadening parameters for each of the stars. In §3.2 we discuss the adjustments made to correct for convective line shifts, and in §3.3 we describe the sources for the atomic and molecular line lists. The uncertainties underlying the critical blending lines in the lithium region are also discussed. In §4 and §5 we describe the profile-fitting procedure for the lithium line and the analysis used to find the best-fit lithium isotopic ratio for each star. Effects from uncertainties in the convective wavelength shift and abundances of blending elements are discussed, and upper limits for the isotopic ratio for each star are calculated. Implications for the possibility of pollution of the stars due to planetary migration are discussed in §6. We conclude with a summary of the observations and results in §7.
2 Observations
Observations were taken with the High Resolution Spectrograph at the Hobby-Eberly Telescope (Tull, 1998) over a period of two years. The HRS is a fiber-coupled echelle spectrograph, using an R-4 echelle mosaic with cross-dispersing gratings. The camera images onto a mosaic of two 2K x 4K CCDs, with a gap between them that spans pixels. The spectrograph was used in high-dispersion mode, with an average resolving power of measured from thorium-argon lines. In the high-dispersion mode of the HRS each resolution element is adequately sampled with 2 pixels per resolution element. The spectral coverage is between 4076 Å and 7838 Å.
Images typically had an integration time of 5 to 15 minutes depending on brightness, and a total integration time between 1 and 2 hours. A ThAr lamp was observed before and after each sequence of exposures. Due to lithium emission lines in the flatfield illumination lamp, it was necessary to use extremely high quality observations of rapidly rotating B stars as flat fields, with signal to noise at least twice that of the target star. These calibration stars were observed as near in time to the program stars as possible. Atmospheric absorption lines did not pose a problem in the lithium spectral region. The reduction process was repeated with the original flat fields and nearby continuum regions were used to check the quality of the final spectrum and to make sure no artifacts were introduced.
Reduction was performed using standard IRAF subroutines for one-dimensional spectra. Radial velocity variations due to changes in heliocentric position and the radial component of the Earth’s rotation between observations were corrected within IRAF, and the individual images were then corrected for additional minute shifts using the strong nearby Fe lines. Continuum normalization was performed by selecting continuum regions in each image without obvious absorption lines or bad pixels and fitting a high order polynomial to these sections. Images were then combined with appropriate rejection algorithms. The estimated S/N per pixel for each star is listed in Table 1.
3 Analysis
3.1 Stellar Parameters
Atmospheric parameters (,log g, and the microturbulence ) for both the stars with planets and the comparison stars were taken from the literature (see Table 1 for references). All of the stars with planets have been well studied, and the comparison stars are bright nearby stars that also have recent accurate measurements; uncertainties are on the order of 100K for , 0.1 for log g, and 0.1 for . Due to the detailed nature of earlier analyses of these stars, and the fact that lithium abundance is relatively insensitive to these parameters, previous values were considered to be adequate. Model atmospheres from Kurucz (1995) were used with an updated version of the stellar analysis code MOOG (Sneden, 1973) to produce synthetic spectra for each of the stars. Values for the standard broadening parameters, stellar rotation () and a radial-tangential macroturbulence parameter (), as well as radial velocity for each of the stars were derived using fits to four nearby Fe I lines at 6703 Å, 6705 Å, 6713 Å, and 6715 Å. For each line, nearby atomic lines were found from the VALD-2 database (Kupka et al., 1999) and adjusted to fit the solar spectrum by Hinkle et al. (2000). For each star the continuum was also adjusted to match the continuum for the solar spectrum. The spectra were initially adjusted to match the solar spectrum in 10 regions that appear to be devoid of lines. These adjustments were then checked against the synthesized spectrum on either side of the lithium region, since the list of weak lines in this region is relatively complete. The adjusted spectra for the program stars are shown in Figure 1.
A rough value for the radial velocity (within 0.03 km ) was found using estimated broadening parameters. A three-dimensional grid was then created by varying the Fe abundance in intervals of 0.02 dex and the and in intervals of 0.02 km , for which the minimum value was found. Best-fit values for the broadening parameters and the radial velocity were found within 0.01 km for each line. A mean value for each parameter was then computed using the three best lines for each star, with an average uncertainty of 0.2 km . Best fits to the individual Fe lines varied by as much as 0.5 km , most likely due to a combination of unknown line blends and differences in line shape due to atmospheric effects (i.e. granulation, convective motion, etc.; see Asplund et al. (2000) for a detailed discussion). However, varying the broadening parameters showed that the computed synthetic spectra are insensitive to variations in and within the error limits, as was noted in previous studies. Final broadening parameters can be found in Table 2.
3.2 Convective Line Shifts
In accordance with Allende Prieto & García López (1998); Allende Prieto et al. (2002) and R02, additional radial velocity shifts due to convective motion were also applied to each line depending on equivalent width. Both Allende Prieto et al. (2002) and R02 measured comparable correlations between blue shifts in line center measurements and equivalent width for a large number of Fe lines from Nave et al. (1994) for the Sun and other stars of similar spectral type, noting shifts between -0.2 km and 0.8 km . We have measured shifts for Fe lines in the solar spectrum of Hinkle et al. (2000) as well as our spectrum of 47 UMa, and we find the same overall correlations as previous studies (see Figure 2). However, the scatter around the mean is quite large, and individual line shifts often vary by up to 0.5 km from the linear relation. To compensate for convective shifts, we have applied an overall wavelength shift to each line correlated with the equivalent width, using the relations derived from the solar spectrum by Hinkle et al. (2000). In addition, wavelength shifts of important lines have been constrained through fits to the solar spectrum.
3.3 The Line List
The large number of weak blending lines in the 6707 Å region makes a detailed accurate line list critical to investigations of lithium abundance. Accurate laboratory wavelengths and oscillator strengths have been measured for the 6Li and 7Li lines themselves (Hobbs et al., 1999) but the identifications and properties of many nearby lines, both atomic and molecular, are quite uncertain. For this study we composed an initial line list from the Kurucz atomic database (Kurucz, 1995) and the Vienna Atomic Line Database (VALD-2, Kupka et al. (1999)), and additional lines were added from recent studies by Lambert et al. (1993) and King et al. (1997). However, line positions and oscillator strengths often differ between studies; King et al. (1997) highlighted several different possibilities for combinations of line strengths to fit both the solar spectrum and other lithium-poor stars, as did I03. An effort was made to include all identified atomic lines in the lithium region with significant opacity at solar temperatures. The contribution of molecular CN to the lithium region is also uncertain. An early analysis of the CN lines was performed by Grevesse (1968), who identified eight contributing lines. Except for updates in line strengths, this molecular line list has remained largely unchanged in later studies. Following work by Denn et al. (1991), we assembled an initial list of lines from work by Jorgensen & Larsson (1990), who calculated rough line positions and oscillator strengths, with modifications pointed out by de Laverny & Gustafsson (1998). Line positions were improved when possible using calculations by Kotler et al. (1980) that incorporate higher order perturbations, and accurate data from Davis (1987). Following Brault & Müller (1975), the theoretical data were then compared with a FTS spectrum of a carbon arc taken from the NSO digital database (Hill, 2003). The spectrum was scaled to match the depth of several unblended CN lines in the solar spectrum at 6702.531, 6703.942, 6704.016, and 6706.733 Å, and the rotational temperature estimated from the transition line ratios was found to be similar to that of the Sun. The line positions and strengths taken from the literature were then modified to fit the laboratory spectrum; the mean shift applied was 0.05 Å, and the mean change in log gf was 0.5 dex. The final CN line list is presented in Table 3. The line list fits the Li region in the solar spectrum well, recreating the line asymmetry in the nearby Fe I line and the blend with the dominant 7Li line.
The uncertainties in the immediate region of the Li doublet were treated using several different line list combinations in order to exhaust all viable possibilities. When the preliminary line list was compiled, it was readily apparent that additional opacity was needed in the region on the red side of the lithium lines. The salient region for lithium-poor stars is the section between 6707.75 and 6708.1 Å, where the red component of 7Li and the stronger blue 6Li component reside. The solar spectrum by Hinkle shows an obvious line at 6708.025 Å, with possible additional opacity sources at 6707.93, 6707.98, 6708.08 and 6708.1 Å. Including the opacity provided by these blending lines is critical in order to assess the strength of the 6Li lines. However, there is a notable paucity of lines listed in the literature for the region beyond 6707.75 Å. As noted by I03, the VALD-2 database contains a weak Ti I line at 6707.964 Å and a V I line at 6708.094 Å. There are also many ionized metal lines in that region, but most of these ionized transitions have very high excitation values that remove them from consideration. Since CN is now removed as a potential source of the unknown blending lines, we are left to postulate new unknown atomic lines in order to fit the solar spectrum.
Müller et al. (1975) first suggested a missing high-excitation Si I line at 6707.025 Å to account for the majority of opacity blueward of 6708.2 Å, and King et al. (1997) followed this example in their analysis of various Li-poor solar-type stars. R02 instead used two Ti I lines to account for the missing opacity, setting the excitation values at 1.88 eV in order to fit stars ranging in temperature from 5600 K to 6400 K (though the line is overestimated in hot stars). I03, after analyzing stars with temperatures from 4500 K to 6200 K, concluded that Ti I lines greatly overestimate the opacity in cool stars. They decided on the 6 eV Si line as the best possibility, but noted that a low- excitation Ti II line also appears to work well at all temperatures. They also noted that the V I lines at 6708.094 and 6708.28 Å used by R02 do not fit stars of non-solar temperature well.
Since we do not have a large sample of high-resolution spectra at a variety of temperatures with which to draw our own conclusions, we must utilize the best options presently available for our stars. After adjusting the log gf values of the basic line list to fit the solar spectrum, we concluded that additional lines were necessary at 6708.025 and 6708.29 Å. For the line at 6708.29 Å, it appears that a low-excitation V I line does not fit the width and shape of the line, and analysis of different stellar temperatures suggests a higher excitation line would be more appropriate. For lithium-poor stars the depth and shape of the line at 6708.29 Å is unaffected by changes in the lithium line itself, and therefore we can achieve the needed opacity with any line of the right shape whose abundance we can adjust with impunity. We chose to use a Mg I line with an excitation value similar to nearby neutral Mg lines. After adjusting the log gf to fit the solar spectrum, it appears the shape is adequate to fit all of our program stars well.
For the line at 6708.025 Å, a solution is less straight-forward. From analysis by I03 it appears that both neutral Ti lines and the Si I line can accurately fit the Sun, but all may overestimate the line strength in hotter stars and underestimate it in cooler stars (see Table 2 in I03 for a direct comparison of Si I and Ti I lines). In addition, I03 suggests that an ionized Ti line may also be possible; though they reject it due to the fact the line becomes extremely weak in hotter stars, the uncertainties in the data make it impossible to rule out this scenario, and we have decided to include it in our analyses. Since the true nature of these blends is still unclear, we have performed statistical analyses for all three possibilities after adjusting log gf values to fit the solar spectrum. The final line list, with the alternative line choices marked, is listed in Table 4.
4 6Li/7Li Measurements
The most probable 6Li/7Li ratio was determined by performing fits for a variety of 6Li/7Li ratios and wavelength shifts in the lithium lines. The overall Li abundance was also kept as a free parameter to allow the line depth to vary. In addition, similar fits were performed after varying the abundance for the element responsible for the unknown blend at 6708.025 Å, in order to examine the effects of errors in abundance, excitation energy, or log gf value.
The overall radial velocity was first set using the nearby Fe I lines. As stated earlier, a linear correction was made to the line wavelengths in relation to their equivalent widths, but even so variations between calculated radial velocity values for different lines ranged between 0.01 km and 0.1 km . This left a choice to be made between which lines to use for the final value. In cases where the full line shape of the Fe I line at 6707.45 Å could be recovered, the line was used to determine the overall radial velocity, due to the similarities in equivalent width with the target lines in the lithium region and the fact that this line was used to calibrate the solar spectrum. In cases where the Fe line was badly blended with the Li feature, an average value was calculated from the four strong nearby Fe I lines.
Abundances for the critical blending lines were taken from the extensive literature on planet-bearing stars, and then checked using reference lines near the lithium feature taken from the VALD-2 database (listed in Table 5). In all cases the average abundance calculated from the reference lines was in good agreement with the published values. However, due to inherent line list uncertainties and the fact that abundances calculated from different lines vary, separate analyses were performed after varying the abundance of the element used for the 6708.025 Å feature by 0.5 dex.
As noted in previous studies, in all cases it was necessary to shift the lithium lines towards higher wavelengths in order to fit the blue side of the 7Li line. The best fit for the Sun was achieved with a shift of 0.007 Å, or 0.31 km , and remained the same for each line list variation. Since the change in wavelength shift with equivalent width for lithium is unknown, the wavelengths of the lithium lines were kept as a free parameter in the fits.
5 Results
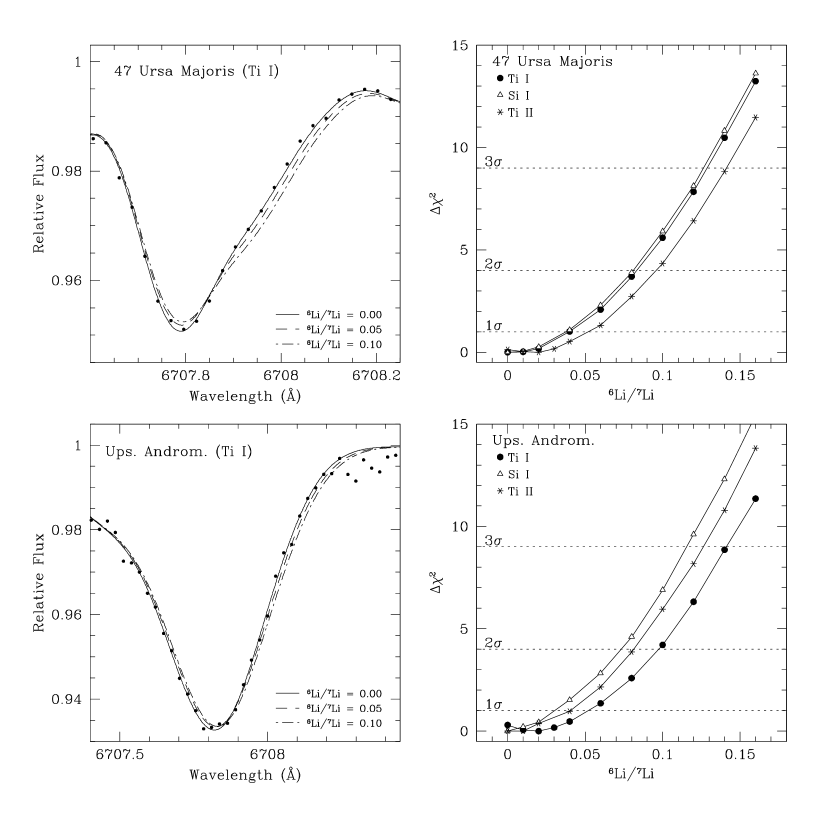
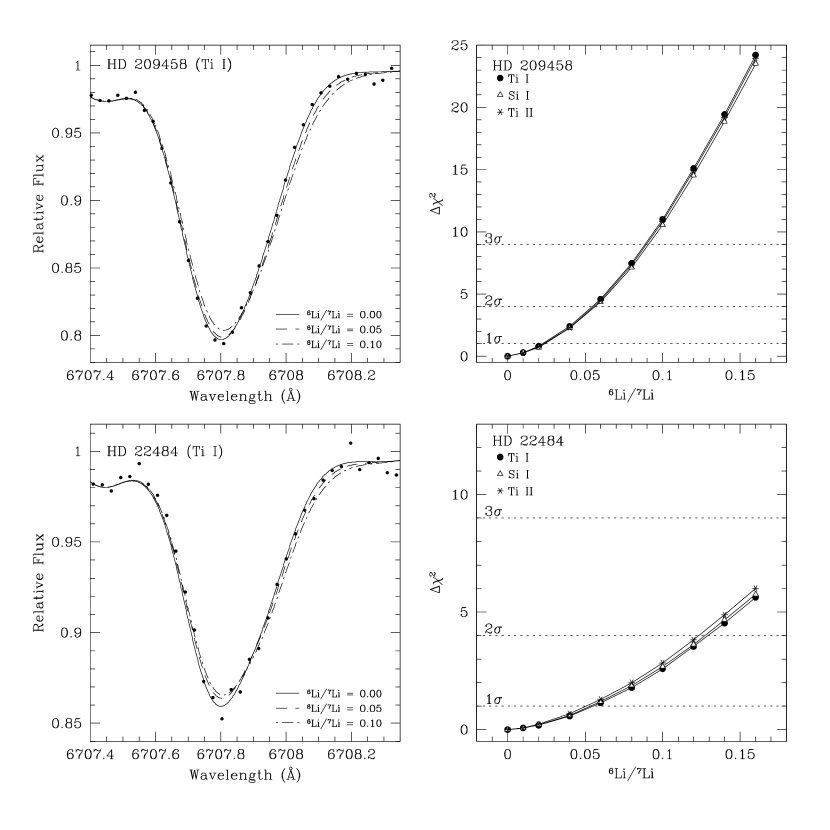
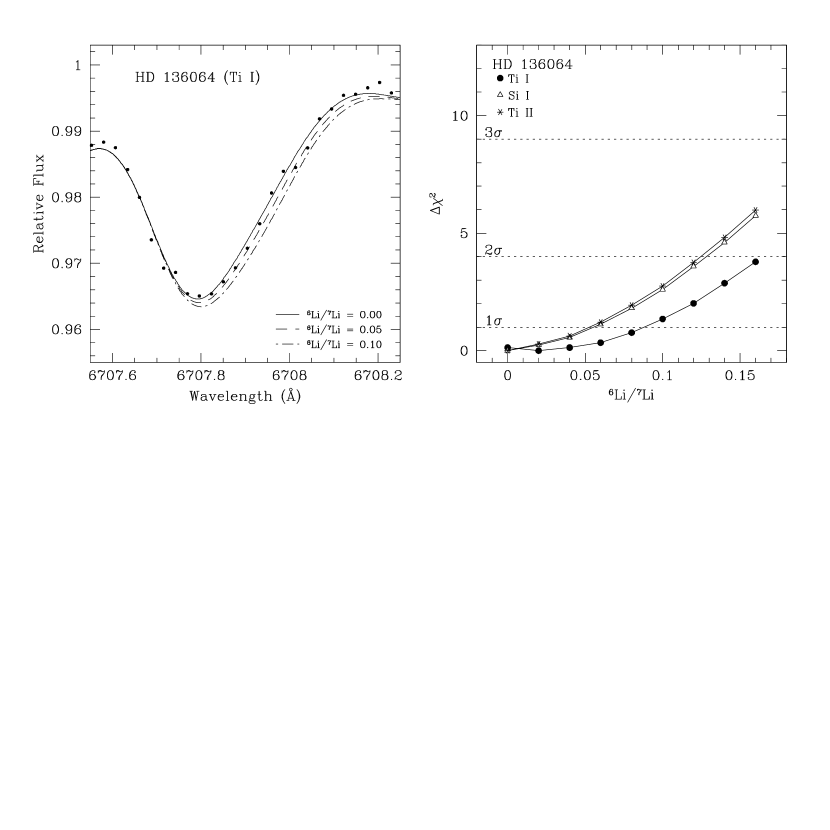
Figures 6 - 8 show computed synthetic profiles for each of the program stars compared with the observed spectrum, and vs 6Li/7Li for the best wavelength shift and the measured abundance for Ti and Si (where is calculated by varying the lithium isotope ratio and overall abundance while keeping all other variables constant). The broadening parameters, overall lithium abundance, and the best-fit 6Li/7Li ratio for each of the three line list scenarios are listed in Table 2. The errors in both log (Li) and 6Li/7Li are 1- errors obtained from the Li profile fitting, and do not include errors in reference abundances or the broadening parameters. The values of for the analyses were between 0.9 and 1.3 for all the program stars.
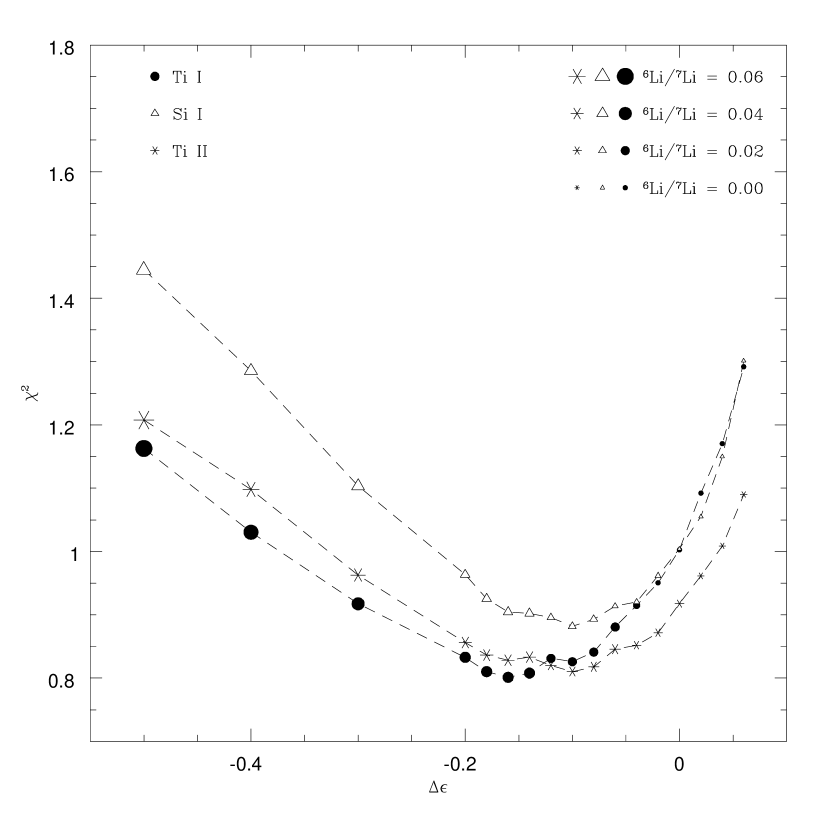
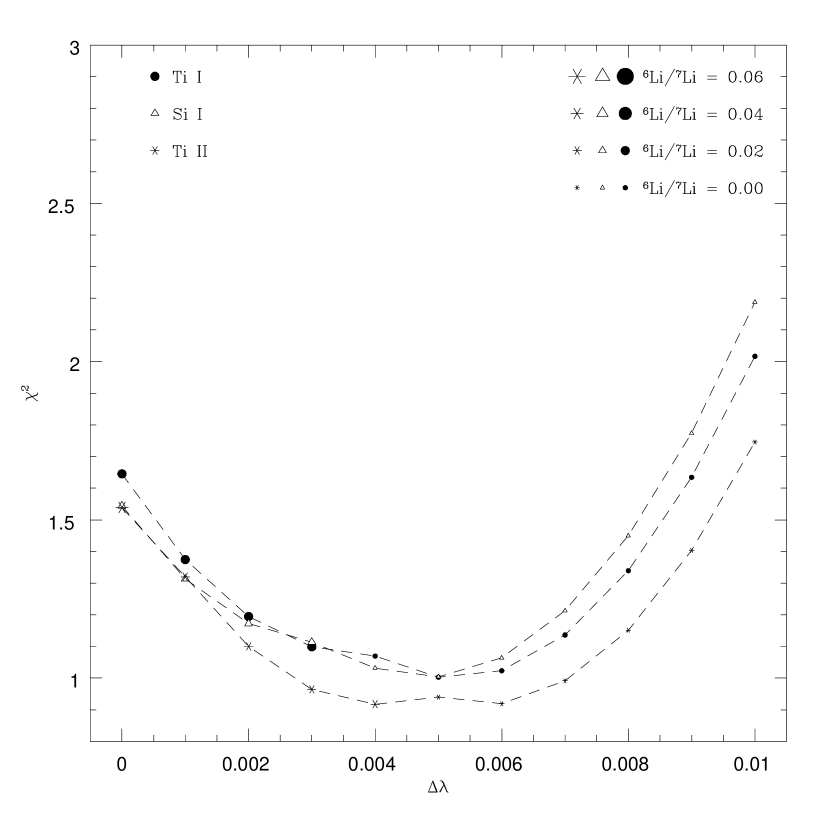
Adjustments in the wavelength shift and abundance of blending elements were tested to measure the effects of uncertainties in both the overall analysis as well as the line list. Figure 9 shows the variation in with changes in the abundance of Ti and Si from the values taken from the literature for 47 UMa, with the lithium isotopic ratio represented by the size of the points. As the abundance of the blending element is decreased, the best fit value of 6Li/7Li increases in order to fit the line. For most stars the decreased slightly when the blending abundances were decreased between 0.0 and 0.15 dex below the published values. Decreasing the wavelength shift for the lithium line also increased the 6Li/7Li ratio needed to fit the line, though the sensitivity of the isotopic ratio to the wavelength shift was less than the sensitivity to the blending abundance (see Figure 10). Considering the uncertainties in the line strength of the blending line at 6708.025 Å and the convective shifts, we cannot rule out these variations in abundance and wavelength shift, and therefore the 6Li/7Li could be slightly higher than the values found using abundances from the literature. In Table 2, the best-fit 6Li/7Li value found with the blending abundance and lithium wavelength shift kept as free parameters is noted in parentheses next to the original value calculated with the blending abundance held at literature values.
The results of the analyses for the three different choices for the blending feature at 6708.025 Å were very similar, with a maximum difference in the best-fit value of 0.02 dex. There did not appear to be systematic differences between the quality of fits achieved with the different line lists. The best-fit values for the lithium isotopic ratio for all the program stars were consistent with a non-detection of 6Li within errors: none of the stars had isotopic ratios above 0.0 for all three scenarios, and And was the only star with an isotopic ratio above 0.0 for two of the three line list scenarios. The maximum best-fit isotopic ratio found for any analysis was 0.02; the maximum 1- upper limit was 0.05 for each of the two lithium-poor planet-bearing stars and 0.03 for HD 209458, the lithium-rich planet-bearing star. The two comparison stars had upper limits of 0.05 as well.
6 Discussion
The results found for all of the planet-bearing stars in this sample are consistent with the results of R02, who found no 6Li present in any of their program stars or their reference stars. In particular, the derived lithium ratios and upper limits for HD 209458 coincide exactly. R02 observed three stars with lithium abundances below 2.2 dex: HD 10697 (1.9 dex), HD 89744 (2.1 dex), and 16 Cyg B (0.7 dex). Both HD 10697 and 16 Cyg B have effective temperatures around 5600K, while HD 89744 has an effective temperature of 6338K. Though no plots of the analysis were published, upper limits for the isotopic ratios of the three stars were 0.06, 0.03 and 0.03 respectively. Though R02 only performed their analysis using the Ti I line at 6708.025 Å, the fact the their results are concurrent with the results from all of our analyzes suggests that these limits are robust. Currently the nature of the blending line at 6708.025 Å is still uncertain, and therefore no strong conclusions can be drawn from the combined results of the lithium-poor stars in both studies, but it appears that the evidence supports a lack of significant enhancement of 6Li in most planet-bearing stars.
However, the value for the lithium isotopic ratio in HD 82943 is still a mystery; the revised value of 0.050.02 reported by I03, who used the Si I line in their analysis, is in conflict with the null result reported by R02 using the Ti I lines. But if the isotopic ratio of HD 82943 is found to be definitively different from all other stars studied to date, then a case may be made that this star has undergone an unusual recent pollution event.
The upper limits on the lithium isotopic ratio can be translated into an upper limit on the number of 6Li atoms in the convective zone of a star. Standard evolutionary models predict that the depth of the convective mixing layer is relatively stable after a star reaches the main sequence, and decreases with increasing stellar mass. The mass of the convective envelope of 47 UMa, with a mass of 1.03 and an effective temperature of 5800K, would be (Pinsonneault et al., 2001; Murray et al., 2001), and a lithium abundance of log and an isotopic ratio of 0.05 would be equal to atoms of 6Li. For a hotter, more massive star such as And the convective envelope is between 0.001 and 0.01, depending on the age of the star and the models used. Using 0.005 as an estimate, a lithium abundance of log and an isotopic ratio of 0.05 would also be equal to atoms of 6Li. Assuming an abundance for protoplanetary material similar to the meteoric values in our own solar system, one would expect and 6Li/7Li = 0.08, and a quantity of material with the mass of Jupiter would have atoms of 6Li (Anders & Grevesse, 1989). This suggests that Jupiter masses of material would have to fall onto a star fully depleted in 6Li to immediately produce the upper limits on the isotopic ratio seen in these two stars. For HD 209458, the 1- upper limit of 0.03 equates to 6Li atoms, which would be equivalent to 0.7 Jupiter masses of material.
If circumstellar material was deposited at some time in the past, or 6Li is not completely depleted in the PMS phase, the situation becomes more complex. Theoretical models of lithium depletion in the pre-main sequence and main sequence phases (Proffitt & Michaud, 1989; Piau & Turck-Chièze, 2002) of the evolution of solar-type stars suggest that the amount of lithium destroyed over the lifetime of a star depends critically on a variety of parameters such as metallicity, rotational mixing, opacities and the efficiency of convection. However, it is generally agreed that essentially all 6Li, and a large fraction of 7Li, is destroyed in the PMS phase in stars with masses less than 1.4; for stars above this mass the convection zone does not extend to temperatures sufficient to destroy lithium efficiently. Once the star reaches the main sequence at an age of approximately 10 to 20 million years, the convection zone retreats and classical models predict a cessation of lithium destruction. However, this prediction is at odds with observations (Jones et al., 1999) which show a decrease in average lithium abundance with age on the main sequence. Main sequence Li depletion appears to be more severe in lower mass stars, except for a notable increase in depletion for stars between 1.2 and 1.5 (Boesgaard & Tripicco, 1986). This phenomena is most likely due to rotational or other macroscopic mixing processes that result in a larger surface mixing layer (Murray et al., 2001), and most likely 6Li is destroyed at a higher rate than 7Li similar to the timescales predicted for pre-main sequence depletion.
Previous calculations of the ages of our program stars using a combination of age indicators find ages of approximately 6.5 Gyr for 47 UMa and 3 Gyr for And (Lachaume et al., 1999), and R02 estimate an age of 4 Gyr for HD 209458; this would suggest that any planetary dynamics due to interactions with the protoplanetary disk that may have deposited giant planets or massive amounts of planetary material would most likely have occurred at much earlier times. If any 6Li was to be maintained in the convective envelopes of solar-mass stars such as 47 UMa, it would most likely be greatly decreased from the initial amount deposited onto the parent star; calculations by Montalbán & Rebolo (2002) suggest that 6Li would be depleted by more than an order of magnitude over 5 Gyr. However, higher-mass stars may be able to maintain 6Li in their small convective zones for much longer, though these timescales would be shortened for higher metallicity stars. This suggests that the upper limits on And may be more meaningful than those calculated for 47 UMa, and the slight possibility of a non-zero lithium ratio in And is not completely unrealistic.
In order to reduce the uncertainties in the synthetic line synthesis, several improvements in future observations and analysis can be employed. The most severe limitations on the accuracy of the isotopic abundance analysis are the uncertainties in the identity and abundance of the underlying blends around the 6Li lines and the uncertainties in the line shape and wavelength shift due to unknown convective and granular motions. To improve the line identifications, additional observations of metal-rich stars with a range of effective temperature combined with laboratory measurements of metal lines in the lithium region would allow a more complete assessment of the blending lines. I03 have begun this process, but a larger sample of stars with varying metallicities is needed. To reduce the ambiguities in the line shape and position, a more complex model of the stellar atmospheric processes must be used. Three-dimensional hydrodynamic models of convection, though currently computationally expensive and restricted in parameter space, are able to accurately predict the line shifts for lines in the solar spectrum (Asplund et al., 2000), and applications to non-LTE calculations of lithium have recently been performed (Asplund et al., 2003). Two-component granulation models (Borrero et al., 2003) are also effective in predicting line shifts and atomic parameters, and may be more effective since they can be easily integrated in to line synthesis applications.
7 Conclusion
We have performed a search for 6Li in several planet-bearing stars with low lithium abundances in order to investigate the possibility of pollution due to infalling planets or planetary material and explore the differences between line lists used in previous studies. In order to fit the nearby blending features in the lithium region, we have enhanced previous atomic and molecular line lists using a combination of lines from previously published line lists and semi- empirical fits to the solar spectrum and a laboratory carbon arc spectrum.
Analyses of the lithium regions of the three planet-bearing stars 47 UMa, And, and HD 209458 using minimization find lithium isotopic ratios consistent with the absence of a detectable amount of 6Li. 1- upper limits suggest that if any planetary material was recently deposited on the host stars, it must be less than half the mass of Jupiter. However, if material was deposited on the stars at much earlier times, destruction of the fragile isotope could have rendered any pollution undetectable.
References
- Asplund et al. (2003) Asplund, M., Carlsson, M., & Botnen, A. V. 2003, A&A, 399, L31
- Asplund et al. (2000) Asplund, M., Nordlund, Å, Trampedach, R., Allende Prieto, C., and Stein, R.F. 2002, A&A, 359, 729
- Allende Prieto & García López (1998) Allende Prieto, C. & García López, R. J. 1998, A&AS, 129, 41
- Allende Prieto et al. (2002) Allende Prieto, C., Lambert, D. L., Tull, R.G., & MacQueen, P. J. 2002, ApJL, 566,L93
- Anders & Grevesse (1989) Anders, E. & Grevesse, N. 1989, Geochim. et Cosmochim Acta, 53, 197
- Boesgaard & Tripicco (1986) Boesgaard, A. M. & Tripicco, M. J. 1986, ApJ, 302, L49
- Borrero et al. (2003) Borrero, J.M., Bellot Rubio, L.R., Barklem, P.S., & del Toro Iniesta, J.C. 2003, A&A, 404, 749
- Brault & Müller (1975) Brault, J. W. & Müller, E. A. 1975, SoPh, 41, 43
- Carretta et al. (2000) Carretta, E., Gratton, R. G., & Sneden, C. 2000, A&A, 356, 238
- Davis (1987) Davis, S. P. 1987, PASP, 99, 1105
- de Laverny & Gustafsson (1998) de Laverny, P. & Gustafsson, B. 1998, A&A, 332, 661
- Denn et al. (1991) Denn, G. R., Luck, R. E., & Lambert, D. L. 1991, ApJ, 377, 657
- Forestini (1994) Forestini, M. 1994, A&A, 285, 473
- Gonzalez (1998) Gonzalez, G. 1998, A&A, 334, 221
- Gonzalez & Laws (2000) Gonzalez, G. & Laws, C. 2000, AJ, 119, 390
- Gonzalez et al. (2001) Gonzalez, G., Laws, C., Tyagi, S., & Reddy, B. E. 2001, AJ, 121, 432
- Gratton et al. (1996) Gratton, R. G., Carreta, E. & Castelli, F. 1996, A&A, 314, 191
- Grevesse (1968) Grevesse, N. 1968, SoPh, 5, 159
- Hill (2003) Hill, F. 2003, The National Solar Observatory Digital Library, http://diglib.nso.edu
- Hinkle et al. (2000) Hinkle, K., Wallace, L., Valenti, J., & Harmer, D. 2000 Visible and Near Infrared Atlas of the Arcturus Spectrum 3727 - 9300 Å (San Francisco: ASP)
- Hobbs et al. (1999) Hobbs, L. M., Thorburn, J. A., & Rebull, L. M. 1999, ApJ, 523, 797
- Ibukiyama & Arimoto (2002) Ibukiyama, A. & Arimoto, N. 2002, A&A, 394, 927
- Israelian et al. (2003) Israelian, F., Santos, N., Mayor, M., & Rebolo, R. 2003, astro-ph/0304358
- Israelian et al. (2001) Israelian, G., Santos, N.C., Mayor, M., & Rebolo, R. 2001, Nature, 411, 163
- Jones et al. (1999) Jones, B. F., Fischer, D. & Soderblom, D. R. 1999, AJ, 117, 117, 330
- Jorgensen & Larsson (1990) Jorgensen, U. G. & Larsson, M. 1990, A&A, 238, 424
- King et al. (1997) King, J. R., Deliyannis, C. P., Hiltgen, D. D., Stephens, A., Cunha, K., & Boesgaard, A. M. 1997, AJ, 113, 1871
- Kotler et al. (1980) Kotlar, A. J., Field, R. W., & Steinfeld, J. I. 1980, J.Mol.Spectr., 80, 86
- Kupka et al. (1999) Kupka, F., Piskunov, N., Ryabchikova, T., Stempels, H., & Weiss, W.W. 1999, A&AS, 138, 119
- Kurucz (1995) Kurucz, R. 1995: http://cfaku5.harvard.edu
- Lambert et al. (1993) Lambert, D. L., Smith, V. V., & Heath, J. 1993, PASP, 105, 568
- Lachaume et al. (1999) Lachaume, R., Dominik, C., Lanz, T., & Habing, H. J. 1999, A&A, 348, 897
- Lin et al. (1996) Lin, D. N. C., Bodenheimer, P., & Richardson, D. C. 1996, Nature, 380, 606
- Montalbán & Rebolo (2002) Montalbán, J. & Rebolo, R. 2002, A&A, 386, 1039
- Müller et al. (1975) Müller, E.A., Peytremann, E. & De La Reza, R. 1975, Solar Physics, 41, 53
- Murray et al. (2001) Murray, N, Chaboyer, B., Arras, P., Hansen, B., & Noyes, R.W. 2001, ApJ, 555, 801
- Murray et al. (1998) Murray, N., Hansen, B., Holman, M., & Tremaine, S. 1998, Science, 279, 69
- Nave et al. (1994) Nave, G., Johansson, S., Learner, R.C.M., Thorne, A.P., & Brault, J.W. 1994, ApJS, 94, 221
- Ng & Bertelli (1998) Ng, Y. K. & Bertalli, G. 1998, A&A, 329, 943
- Piau & Turck-Chièze (2002) Piau, L. & Turck-Chièze, S. 2002, ApJ, 566, 419
- Pinsonneault et al. (2001) Pinsonneault, M. H., DePoy, D. L., & Coffee, M. 2001, ApJ, 556, L59
- Proffitt & Michaud (1989) Proffitt, C. R., & Michaud, G. 1989, ApJ, 346, 976
- Rasio & Ford (1996) Rasio, F. A. & Ford, E. B. 1996, Science, 274, 954
- Reddy et al. (2002) Reddy, B., Lambert, D., Laws, C., Gonzalez, G. & Covery, K. 2002, MNRAS, 335, 1005
- Sandquist et al. (2002) Sandquist, E. L., Dokter, J. J., Lin, D. N. C.; Mardling, R. A. 2002, 572, 1012
- Schneider (2003) Schneider, J. 2003, The Extrasolar Planets Encyclopedia (Paris: Obs. Paris), http://cfa-www.harvard.edu/planets/encycl.html
- Sneden (1973) Sneden, C. 1973, Ph.D. thesis, Univ. Texas-Austin
- Tull (1998) Tull, R. G. 1998, Proc. SPIE, 3355, 387
- Weidenschilling & Marzari (1996) Weidenschilling, S. J. & Marzari, F. 1996, Nature, 384, 619


| Star | V | S/N | log g | [Fe/H] | Sp.Type | Mass | AgeaaStellar age ranges compiled from Ibukiyama & Arimoto (2002), Lachaume et al. (1999), and Ng & Bertelli (1998) | Refb,cb,cfootnotemark: | ||
|---|---|---|---|---|---|---|---|---|---|---|
| pixel-1 | (K) | cm | km | Gyr | ||||||
| 47 UMa | 5.10 | 1100 | 5800 | 4.25 | 1.00 | 0.01 | G0V | 1.0 | 6.0-7.0 | 1,1 |
| And | 4.09 | 900 | 6140 | 4.12 | 1.35 | 0.12 | F8V | 1.3 | 3.0-4.0 | 2,1 |
| HD 209458 | 7.65 | 350 | 6063 | 4.38 | 1.02 | 0.04 | G0V | 1.1 | 4.0-5.0 | 3,1 |
| HD 22484 | 4.28 | 300 | 5950 | 4.00 | 1.35 | -0.11 | F9IV | 1.1 | 6.0-7.0 | 4,2 |
| HD 136064 | 5.10 | 850 | 6077 | 3.94 | 1.52 | -0.02 | F9IV | 1.3 | 3.0-5.0 | 5,2 |
| Star | log (Li) | 6Li/7Li (Ti I) | 6Li/7Li (Si I) | 6Li/7Li (Ti II) | ||
|---|---|---|---|---|---|---|
| 47 UMa | 1.19 | 5.06 | 1.670.02 | 0.000.04 (0.03) | 0.000.04 (0.02) | 0.020.03 (0.03) |
| And | 8.33 | 7.88 | 2.190.02 | 0.020.03 (0.02) | 0.000.03 (0.00) | 0.010.03 (0.02) |
| HD 209458 | 4.20 | 5.23 | 2.640.01 | 0.000.03 (0.00) | 0.000.03 (0.00) | 0.000.03 (0.00) |
| HD 22484 | 2.17 | 5.84 | 2.430.03 | 0.000.05 (0.00) | 0.000.05 (0.00) | 0.000.05 (0.00) |
| HD 136064 | 3.33 | 6.88 | 1.810.02 | 0.020.05 (0.02) | 0.000.05 (0.00) | 0.000.05 (0.00) |
| Identification | Wavelength(air) | LEP | log | RefaaReference for original wavelength- J: Jorgensen & Larsson (1990); K: Kotler et al. (1980) |
|---|---|---|---|---|
| (Å) | () | () | ||
| 6702.5314 | 0.94 | -1.608 | J | |
| 6703.9421 | 0.81 | -1.869 | J | |
| 6704.0157 | 0.81 | -2.009 | J | |
| 6705.8851 | 2.35 | -1.792 | J | |
| 6705.8883 | 1.79 | -3.298 | J | |
| 6705.8905 | 1.10 | -3.227 | J | |
| 6705.9816 | 1.82 | -1.890 | K | |
| 6706.5476 | 3.13 | -1.359 | J | |
| 6706.5665 | 2.19 | -1.650 | J | |
| 6706.6568 | 0.87 | -3.001 | K | |
| 6706.7329 | 0.87 | -1.807 | K | |
| 6706.8440 | 1.96 | -2.775 | K | |
| 6706.8626 | 2.07 | -1.882 | J | |
| 6707.2052 | 1.97 | -1.222 | K | |
| 6707.2823 | 2.04 | -1.333 | J | |
| 6707.3706 | 3.05 | -0.522 | J | |
| 6707.4569 | 0.79 | -3.055 | K | |
| 6707.4695 | 1.88 | -1.581 | K | |
| 6707.5450 | 0.96 | -1.598 | K | |
| 6707.5947 | 1.89 | -1.451 | K | |
| 6707.6453 | 0.96 | -2.310 | K | |
| 6707.8071 | 1.21 | -1.853 | K | |
| 6707.8475 | 3.60 | -2.417 | J | |
| 6707.8992 | 3.36 | -3.110 | J | |
| 6707.9300 | 1.98 | -1.651 | J | |
| 6707.9800 | 2.39 | -2.027 | K | |
| 6708.0261 | 1.98 | -2.031 | J | |
| 6708.1470 | 1.87 | -1.884 | J | |
| 6708.3146 | 2.64 | -1.719 | J | |
| 6708.3700 | 2.64 | -2.540 | J | |
| 6708.4200 | 0.76 | -3.440 | J | |
| 6708.5407 | 2.50 | -1.876 | J | |
| 6708.6345 | 1.87 | -1.584 | K |
| Wavelength | Element | LEP | log | RefaaReference for original data- V: VALD-2 database,; K: Kurucz database; R: Reddy et al. (2002); I: Israelian et al. (2003); M: this study; H: Hobbs et al. (1999) |
|---|---|---|---|---|
| (Å) | () | () | ||
| 6706.8800 | Fe II | 5.96 | -4.100 | V |
| 6707.0100 | Si I | 5.95 | -2.640 | V |
| 6707.4330 | Fe I | 4.61 | -2.320 | R |
| 6707.4730 | Sm II | 0.93 | -1.777 | V |
| 6707.5180 | V I | 2.74 | -1.995 | V |
| 6707.6440 | Cr I | 4.21 | -2.667 | V |
| 6707.7400 | Ce II | 0.50 | -3.810 | R |
| 6707.7520 | Sc I | 4.05 | -2.654 | V |
| 6707.7561 | 7Li | 0.00 | -0.428 | H |
| 6707.7682 | 7Li | 0.00 | -0.206 | H |
| 6707.7710 | Ca I | 5.80 | -4.015 | R |
| 6707.9066 | 7Li | 0.00 | -1.509 | H |
| 6707.9080 | 7Li | 0.00 | -0.807 | H |
| 6707.9187 | 7Li | 0.00 | -0.807 | H |
| 6707.9196 | 6Li | 0.00 | -0.479 | H |
| 6707.9200 | 7Li | 0.00 | -0.807 | H |
| 6707.9230 | 6Li | 0.00 | -0.178 | H |
| 6707.9640 | Ti I | 1.88 | -6.903 | V |
| 6708.0220* | Ti II | 1.88 | -4.230 | M* |
| 6708.0230* | Si I | 6.00 | -2.890 | I* |
| 6708.0250* | Ti I | 1.88 | -2.202 | R* |
| 6708.0728 | 6Li | 0.00 | -0.303 | H |
| 6708.0940 | V I | 1.22 | -2.313 | V |
| 6708.2750 | Ca I | 5.88 | -6.097 | V |
| 6708.2900* | Mg I | 5.75 | -2.678 | M* |
| 6708.6090 | Fe I | 5.45 | -3.405 | V |
| Wavelength | Element | LEP | log |
|---|---|---|---|
| (Å) | () | () | |
| 6680.1370 | Ti II | 3.10 | -2.075 |
| 6689.2480 | Ti I | 2.25 | -1.602 |
| 6716.6730 | Ti I | 2.49 | -1.143 |
| 6721.8430 | Si I | 5.86 | -1.190 |
| 6739.5230 | Si I | 5.96 | -1.660 |
| 6741.6280 | Si I | 5.98 | -1.680 |