00 \Year0000 \Month00 \Pagespan000000 \lhead[0]A.N. S.F.Sánchez: The Euro3D Visualization Tool \rhead[Astron. Nachr./AN XXX (200X) X]0 \headnoteAstron. Nachr./AN 32X (200X) X, XXX–XXX
E3D, the Euro3D Visualization Tool II:
mosaics, VIMOS data and large IFUs of the future.
Abstract
In this paper, we describe the capabilities of E3D, the Euro3D visualization tool, to handle and display data created by large Integral Field Units (IFUs) and by mosaics consisting of multiple pointings. The reliability of the software has been tested with real data, originating from the PMAS instrument in mosaic mode and from the VIMOS instrument, which features the largest IFU currently available. The capabilities and limitations of the current software are examined in view of future large IFUs, which will produce extremely large datasets.
keywords:
techniques: image processing; methods: data analysisssanchez@aip.de
1 Introduction
In Sánchez (2003), hereafter Paper I, we presented E3D, the Euro3D Visualization tool. We described its main characteristics and gave some examples of its use with different IFU data. One of the initial requirements for the Euro3D visualization tool was that it shall be able to handle large 3D datasets made either from large number of exposures of the same “small” IFU at different pointings (mosaics) or from a single or few exposures obtained using a “large” IFU. To demonstrate the capabilities of the current software to handle and display mosaics and large datasets, we give examples of its use for the visualization of a mosaic of PMAS data ([Sánchez et al. 2003]), section 2, and a single exposure obtained with the largest existing IFU, namely VIMOS/IFU ([Sánchez et al. 2003]), section 3. We then discuss the current limitations of the E3D software in view of future very large IFUs like the MUSE/VLT project ([Bacon et al. 2002]).
2 Mosaics
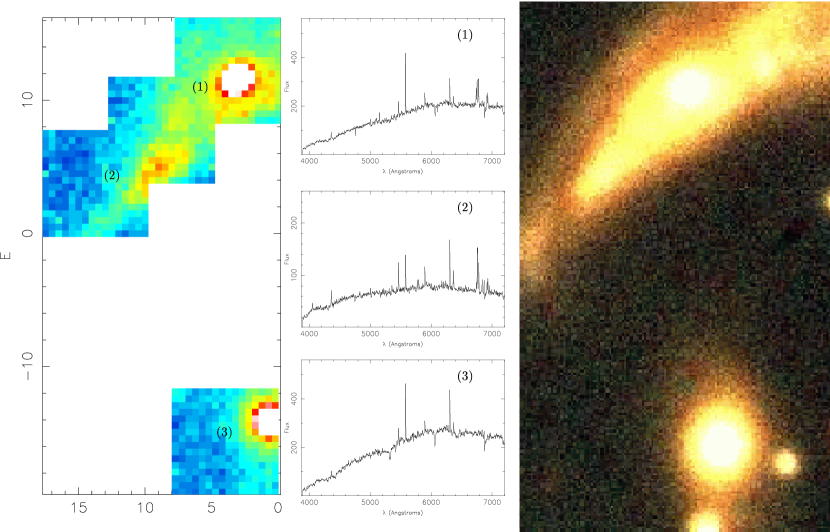
Figure 1 shows a mosaic of four pointings, obtained with the PMAS instrument ([Kelz et al. 2003], [Roth et al. 2000]) of the object IRAS 16365+4202. Three of the pointings overlapp (with 6 8 coincident spaxels each, where a spaxel is defined as a spatial element: fiber, lenslet…) while one pointing is completely separated spatially (centered on a nearby companion). The size of each individual field of view is . The mosaic of the overlapping pointings has been created using an IDL based software code written by one of us ([Becker 2001]), while the single, non-contiguous, pointing was included using the standalone program pmasMosaic, that is part of the E3D distribution.
Both the Euro3D format and E3D handle complex geometries of mosaic pointings, without the need to add fake values or to fill any gaps, like in the case of a 3D cube, or to interpolate the data to match a certain grid or pattern. This method decreases the size of the stored data on the disk and increases the speed of reading/writting. Importantly, it also preserves the original data (as opposed to interpolations). The mosaic displayed in In Fig. 1 comprises 934 spectra with 1009 spectral pixels each one. Each pixel contains two times a float digits of 4 bytes, one for the data, and one for the noise information. i.e., 8 bytes per spectral pixel and spaxel. The final size of this file on the disk is 7.3Mb. It takes less than 3 seconds to E3D to load the complete file in the memory, using a Linux PC with 512Mb of RAM and a Pentium IV processor at 2GHz (hereafter C1), and about the double using a Linux PC with 128Mb of RAM and a Pentium III processor at 700MHz (hereafter C2). If the data were storaged on a continuously sample datacube (i.e., in which all the gaps between the pointings are filled with “fake” data), a cube containing more than 2520 spectra would be needed, yielding a total size of 20Mb on the disk.
3 Large IFUs: test with VIMOS
We have tested E3D with low-resolution VIMOS ([Le Fèvre et al. 2003]) data. These data were obtained for an on-going project dedicated the study of the connection between merging and AGN activity in galaxies ([Sánchez et al. 2003]). They reduced using a modified version of the PMAS data reduction software P3d ([Becker 2001]). VIMOS, mounted on the VLT, is the largest existing IFU. It comprises 6400 spaxels, with 536 spectral pixels each (in the low resolution mode). A single VIMOS exposure occupies 26.5Mbs on the disk, saved in the Euro3D format. E3D reads this file in 7 seconds, using C1, and about the 17 seconds using C2.
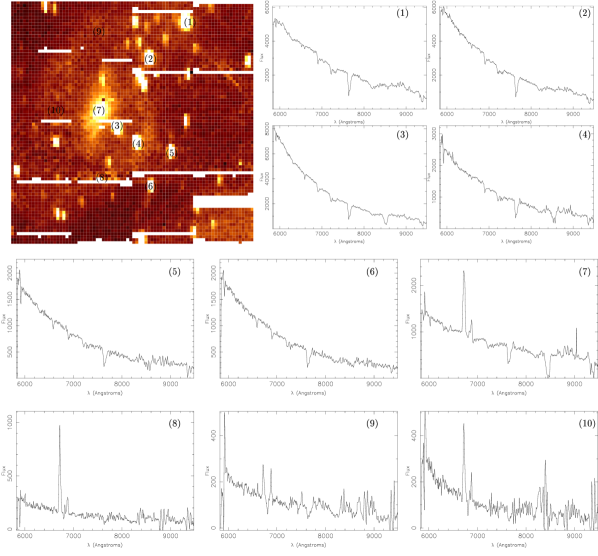
VIMOS has a number (10%) of dark or low-performance spaxels, that are not homogeneously distributed within the field-of-view. We have used E3D to eliminate these spaxels. As a consequence of the Euro3D format, dead and/or low-efficiency spaxels can be easily removed from the data, without affecting the data visualization. In Figure 2 we present an example of this cleaning method. This figure shows an H map of the object IRAS 13031-5717, observed with VIMOS in the low-resolution red mode. All the bright point-like objects on the field are foreground stars. We also plotted the spectra of foreground stars (spectra 1 to 6) and different regions of the target (spectra 7 to 10). The removed spaxels appear as white strips in the image.
E3D includes 5 different interpolation algorithms: Spline, Linear Delaunay, Natural Neighbors, Linear Nearest Neighbors and Inverse Distance Nearest Neighbors. The fastest method is the Linear Delaunay, although the most accurate is the Natural Neighbor. The speed of an interpolation depends on the original number of spaxels, and the final number of pixels of the regular grid. It takes less than 0.1 seconds to E3D to interpolate a VIMOS map (6400 spaxels) in a regular grid of 0.20.2 pixels (90000 pixels) using the Delaunay interpolation, and 1 second using the Natural Neighbor interpolation (for C1 configuration).
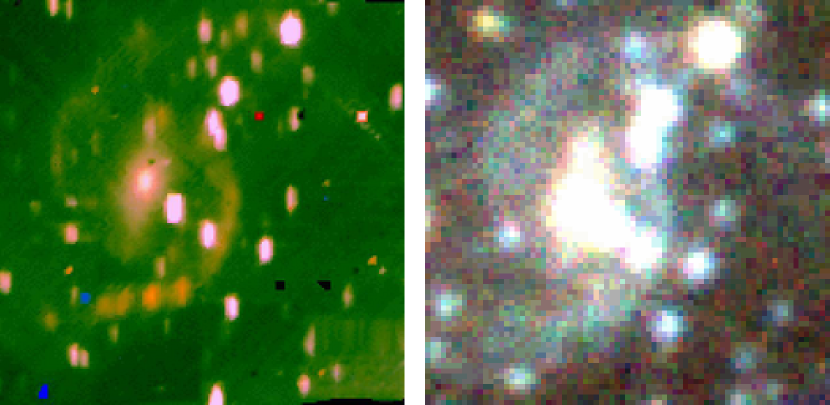
We have interpolated the VIMOS cleaned data, using the Linear Delaunay algorithm, and created three images, that have been combined using the EXPORT routine under IRAF to generate a true-color image. The three wavelength ranges used for the true-color image of Figure 3 are the H emission line and the continuum bluewards and the continuum redwards of it. For comparison, we have included a true-color image of the same field obtained using the EXPORT routine over , and -band images from the SuperCOSMOS catalogue ([Hambly et al. 2001]). Comparing Figures 2 and both images on Figure 3 we can appreciate that the interpolation routine works well in general. There are some artifacts created by the interpolation on the areas with large strips of missed data. The artifacts are clearly identified as purely red, blue or black spots, and can be easily removed by hand. We have prefered not to clean them to show the limits of the interpolation over large datasets with strips of non existing data.
4 Future work
A problem with the current software version is that it does not deallocate a fraction of the memory in the process of reading large data formats. For example, using C1, the datasize limit is reached at 64000 spaxels (assuming spectra of 1024 spectral pixels, and float digits) or any comparable spectral/spatial combination. Under these conditions it takes about 3 minutes to read the data. This shortcoming will be a problem for the huge datasers of possible future instruments like MUSE ([ba02]), which will have more than 90000 spaxels, each containing 4k spectral points. It will therefore have to be fixed. It is however worth pointing out that current instruments like VIMOS (6400 spaxels), or reasonable mosaics (e.g. up to 250 pointings with a PMAS-like IFU) are not affected by this problem.
Acknowledgements.
This project has be founded by the Euro3D Training Network on Integral Field Spectroscopy, funded by the European Commission under contract No. HPRN-CT-2002-00305. I’d like to acknowledge Sebastièn Foucaud for his help on the development of an interface to comunicate between E3D and external packages, especially with PYTHON. I like to acknowledge Matthew Horrobin for his tests with SPIFFI and his useful comments. I like to acknowledge A.Pécontal-Rousset, P. Ferruit and all the Lyon group for their advice, help, and their marvelous work on the library. Thanks to all the network for your comments and help. I’d like to acknowledge the referee, P.Ferruit, for his comments that have help to improve substantially the quality of this article.References
- [Bacon et al. 2002] Bacon, R., et al., 2002, in Scientific Drivers for ESO Future VLT/VLTI Instrumentation, eds. J. Bergeron, G. Monnet, Springer, Berlin, p. 108
- [Becker 2001] Becker, T., 2002, PhD Thesis, University of Potsdam, Germany
- [Becker et al. 2003] Becker, T., Roth, M.M., Kelz, A., 2003, Euro3D Science Workshop, 21-23 May 2003, IoA, Cambridge, AN, , these proceedings.
- [Hambly et al. 2001] Hambly, N. C., MacGillivray, H. T., Read, M. A., Tritton, S. B., Thomson, E. B., Kelly, B. D., Morgan, D. H., Smith, R. E., Driver, S. P., Williamson, J., Parker, Q. A., Hawkins, M. R. S., Williams, P. M., Lawrence, A., 2001, MNRAS, 326, 1279
- [Pécontal-Rousset et al. 2003] Pécontal-Rousset, A., et al., 2003, Euro3D Science Workshop, 21-23 May 2003, IoA, Cambridge, AN, , these proceedings.
- [Kelz et al. 2003] Kelz, A., Roth, M.M., Becker, T., 2003, in Proc. SPIE, Vol. 4841, 1057
- [Kissler-Patig et al. 2003a] Kissler-Patig, M., Copin, Y., Ferruit, P., Pécontal-Rousset, A., Roth, M.M., 2003, Euro3D Data Format Definition, Euro3D Documentation.
- [Kissler-Patig et al. 2003b] Kissler-Patig, M., et al. 2003, Euro3D Science Workshop, 21-23 May 2003, IoA, Cambridge, AN, in preparation.
- [Le Fèvre et al. 2003] Le Fèvre, 0. et al., 2003, in Proc. SPIE, Vol. 4841, 1670
- [Pecontal-Rousset et al. 2003] Pécontal-Rousset, A., Ferruit, P., Copin, Y., 2003, Euro3D I/O Libraries v1.0a, Installation Guide, Euro3D Documentation.
- [Roth et al. 2000] Roth, M.M., Bauer, S., Dionies, F., et al., 2000, in Proc. SPIE, Vol. 4008, 277-288
- [Sánchez et al. 2003] Sánchez, S.F., Christensen, L., Becker, T., Kelz, A., Jahnke, K., Benn, C.R., García-Lorenzo, B., Roth, M.M., 2003, Euro3D Science Workshop, 21-23 May 2003, IoA, Cambridge, AN, these proceedings.
- [Sánchez 2003] Sánchez, S.F.: 2003, Euro3D Science Workshop, 21-23 May 2003, IoA, Cambridge, AN, these proceedings.
- [Walsh & Roth(2002)] Walsh, J. R. & Roth, M. M., 2002, The Messenger, 109, 54