00 \Year0000 \Month00 \Pagespan000000 \lhead[0]A.N. S.F.Sánchez: The Euro3D Visualization Tool \rhead[Astron. Nachr./AN XXX (200X) X]0 \headnoteAstron. Nachr./AN 32X (200X) X, XXX–XXX
E3D, The Euro3D Visualization Tool I:
Description of the program and its capabilities
Abstract
We present the first version of E3D, the Euro3D visualization tool for data from integral field spectroscopy. We describe its major characteristics, based on the proposed requirements, the current state of the project, and some planned future upgrades. We show examples of its use and capabilities.
ssanchez@aip.de
1 Introduction
The Euro3D Research Training Network (RTN) ([Walsh & Roth 2002]) was put forward with the intention to promote integral field spectroscopy (IFS), or “3D” spectroscopy, and to help making it a common user technique. In order to accomplish this, one of the major tasks was identified as the need of providing standard software tools for the visualization and analysis of datacubes. These tools should be general enough to be entirely independent of the origin of data, i.e. 3D instrument. Previously, a heterogenous collection of instrument-specific data formats and software tools (e.g. XOASIS), proprietary software packages and a lack of any standard have hampered a break-through of this powerful observing method, leaving it merely as an expert technique with comparatively limited scientific impact.
Recognizing the importance of this problem, a work plan was devised to start creating a package of tools for the analysis and visualization of IFS data. Entitled 3D Visualization, Task 2.2 of this work plan foresees the development of a programme, which should be capable of reading, writing, and visualizing reduced data from 3D spectrographs of any kind. We have named this tool “E3D”.
Here we present the current status of the project, give a brief description of the programme as it is now, point out some requirements which have not yet been met, and explain some problems that were encountered during the development. We also present some examples with real data, trying to explore the potential of the tool already at its first stage of development.
2 Background
One of the major problems for the development of a standard visualization tool is the lack of a standard data format. Every group has developed its own 3D data format, both for the spectral and the position information (cubes, FITS images, FITS tables, MIDAS images, etc…). In order to overcome this problem, the RTN has proposed a unified data format, the “Euro3D Data Format” ([Kissler-Patig et al. 2003a]; [Kissler-Patig et al. 2003b]). Taking into account previous experience from more than a decade of operating 3D instrumentation in the visible and the near-infrared, this data format is supposed to cover most foreseeable requirements of existing and future instruments. The Euro3D visualization tool was written specifically to make use of this data format.
It was the scope of the network from the very begining to provide a freely distributed software, that could be installed/used on the largest possible number of computers. This prevents us from developing the software in any comercial (e.g., IDL) or non comercial environment (e.g., MIDAS) that could create a long-term dependence or limit its use. The possibility of using/adapting a previous existing tool (like DS9, XIMAGE or GIPSY) was considered. However, the expecific requeriments of IFS prevented us from choosing this solution. A major caveat was the requisite of that tools to handle with regular gridded data, like datacubes, which force us to interpolate (i.e., alter) the data to visualize them. Due to all these reasons it was decided to write a stand-alone software in C.
A C-coded library (“LCL”) was developed to handle the input/output of data on the proposed format ([Pecontal-Rousset et al. 2003]). This library allows to read and write not only Euro3D format files, but also reads/writes single spectra, monochromatic datacube slices, FITS images, and FITS tables. We have tested different graphical libraries (NCARG, PLPLOT, X11 low-level routines,etc.) and created different prototypes based on these various libraries. As a result, it was decided to use PGPLOT, mainly due to its flexibility, portability, and in particular its capability to interact with Tcl/Tk. The latter property allowed us to implement a scripting capability.
3 Requirements
Decisions upon the specification of E3D were made after extensive discussion in various RTN meetings. The following summary explains the main requirements:
-
1.
Display all the spectra stored on the file as a single 2D image (staked spectra, one spectrum per row).
-
2.
Display different spatial representations of the data (maps) from the stacked spectra representation:
-
(a)
Display maps built from a single spectral pixel (monochromatic maps) or from integration over a given spectral range (polychromatic maps), using the geometry of the spatial elements (spaxels: fibers, lenslets…). done
-
(b)
Display interpolated images done
-
(c)
Page handling, blinking done
-
(d)
Display maps with overlay of the spaxel shapes done
-
(e)
Correct for atmospheric refraction done
-
(f)
Weighted summation of maps, with rejection of noisy spaxels work in progress
-
(g)
Load and display regular FITS spectra, images and tables work in progress
-
(h)
Simple statistical tools work in progress
-
(a)
-
3.
Select spectra from map representation:
-
(a)
Investigate interaction between windows, events done
-
(b)
Window Layout ongoing development
-
(a)
-
4.
Alternative representations:
-
(a)
pseudo long-slit done
-
(a)
In addition, more demands have emerged in the course of discussion. It was demanded that E3D were built with a modular phylosophy that allows to integrate different packages on the future. E3D should be able to interact with the major astronomical data analysis packages, like IRAF/PyRAF or IDL. A Shared Memory Server (SHM) was integrated into E3D for this propose, although its capabilities have not been already fully tested. Additional communication methods have been developed and tested, based on the scriptable capabilities of E3D.
4 Characteristics
E3D comprises a C-coded core, with three main elements:
-
•
The Euro3D.o library of low-level functions, including the routines calling the Euro3D I/O library, the SHM routines, basic functions needed for plotting and analizing the data. This library can be invoked to create another program, which needs to read/write Euro3D data, or uses the SHM routines.
-
•
The tk_e3d Tcl/Tk interpreter. This is a standalone programme that creates its own Tcl/Tk interpreter, adding Euro3D routines to the standard Tcl ones. These routines invoke the C-functions included in Euro3D.o from Tcl, and they can be used for different proposes: e.g., load/save Euro3D format files, plot single or coadded spectra, plot monochromatic/polychromatic maps, interpolate these, save maps in FITS format.
-
•
A number of stand-alone C-coded tools that help to handle the Euro3D format. Perhaps the most interesting routine is any2Euro3D, transforming single Group IFS data from any instrument into the Euro3D Format.

Together with the C-core, we have coded a Tcl/Tk Graphical User Interface (GUI), that uses the Euro3D-Tcl routines (tk_e3d.tcl). The GUI comprises three main windows:
-
•
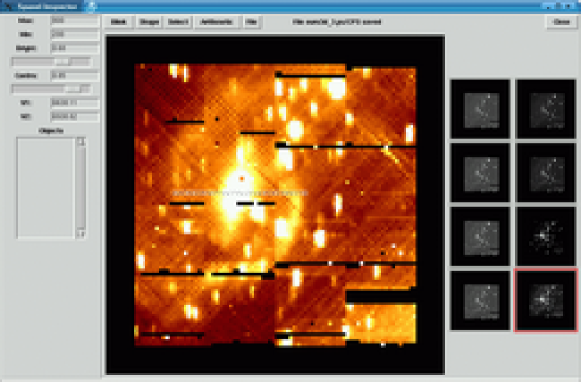
The Main window or Stacked Spectra Inspector. It comprises the main Menu with different options to handle Input/Output and different representations of the data. The data are automatically plotted in its canvas on the Stacked Spectra representation once loaded. A command-line prompt has been included in this window to directly call Euro3D-Tcl routines. Figure 1 shows an image of this window.
-
•
The Spaxels Inspector. It comprises a main canvas for plotting monochromatic/polychromatic datacube slices, which have been selected previously from the main window or from the Spectral Inspector (see below). It includes 8 minor canvas for buffering the last created maps. It also includes a menu with different options to handle spaxels/maps, including the spaxel selection, object creation and the selection of different methods to show the data. Figure 2 shows a screen-shot of this window.
-
•
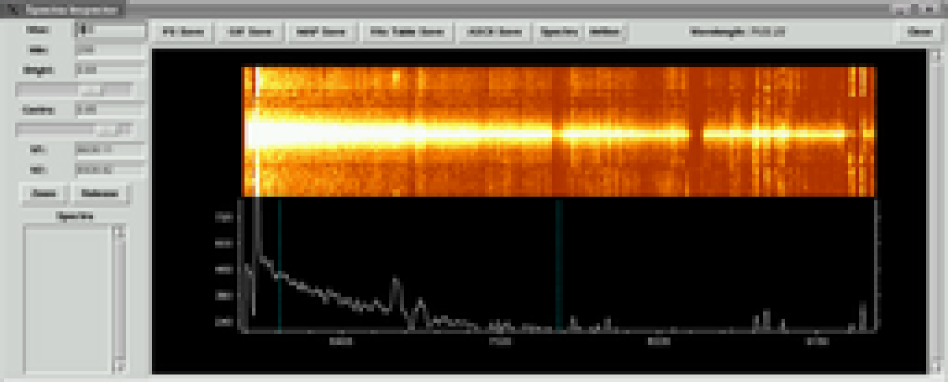
The Spectral Inspector. It comprises a main canvas for plotting the spectra corresponding to spaxels which were selected from any of the two previous windows. It also includes a menu with different options to handle the spectra. Figure 3 shows an image of this window.
As explained above the GUI has been coded in Tcl/Tk using the Euro3D-Tcl routines. This is probably the most powerful outcome of the adopted programming philosophy, since a scripting capability for handling Euro3D data is included “for free”. This means that any user can create his/her own Tcl-coded scripts by making use of the Euro3D-Tcl routines, and run them by invoking tk_e3d .
4.1 The Euro3D-Tcl routines: An example
It is beyond the scope of this article to explain in detail all of the existing Euro3D-Tcl routines. However, as an instructive example, we show a script which creates a movie or a sequence of monochromatic slices, running through the Euro3D datacube:
01 #!PATH/user/bin/tk_e3d
02 create_env euro3d "/XSERV"
03 euro3d load_file E3D_FITSFILE
04 set data [euro3d ask_e3d_info]
05 set start_w [lindex $data 2]
06 set delta_w [lindex $data 4]
07 set i_1 0
08 set i_2 1000
09 euro3d plot_spaxels -1 25 1 0 10 heat 0.65 0.60 -1 1 1 4 0
10 for {set x $i_1} {$x<$i_2} {incr x 10} {
11 set x2 [expr $x+10]
12 set w [expr (($x+1.5)*$delta_w+$start_w)]
13 euro3d plot_spaxels -1 35 1 $x $x2 heat 0.65 0.7 1 1 1 4 1
14 }
15 exit
Line 1 calls the interpreter, tk_e3d. Lines 2 and 3 create the Euro3D environment, with a permanent XWIN, and load the Euro3D file. Line 4 loads the descriptor of the file (e.g. wavelength range, number of spaxels, etc.) from the list data. Line 5-8 define some variables for later use (e.g. starting wavelength, start_w, wavelength step, delta_w, and the first and last spectral pixel to plot, i_1 and i_2). Line 9 plots the first averaged polychromatic map (mean taken over a 10 pixel-wide window). Lines 10-14 corresponds to a loop over the spectral pixels (from i_1 to i_2), with a step of 10 pixels. At each step, the corresponding, averaged polychromatic map is displayed.

4.2 E3D by examples
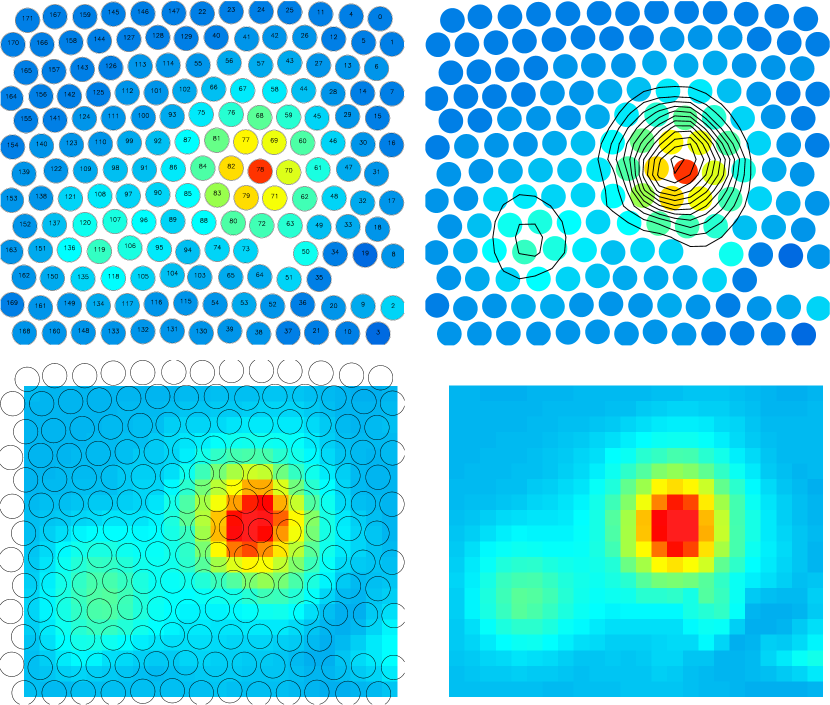
E3D actually performs relatively simple routines, like spaxel selection or image reconstruction. Figure 4 shows an example of four different representation of the maps. The top-left panel shows a spaxel representation of a slice cut of INTEGRAL data taken on the gravitational lens HES 1104-185 ([Gómez et al. 2003]). Each spaxel has a radius of 0.27. The top-right pannel shows the same representation including a contour plot. For displaying the contour plot it is needed to interpolate the data, creating a regular gridded map. Five different interpolation algorithms are already available on E3D. The two bottom pannels of Fig.4 show two examples of these interpolation algorithms, both using a 0.3/pixel grid.
We have included different representations of the spectra, both in a pseudo slit-spectra form (a spatial cut in the datacube, mimicking a slit-spectrum observation), as seen in Fig. 3, or as standard spectrum plot, Fig. 5. These two figures show the averaged spectra of the central region of IRAS 13031-5717, an interacting galaxy at 0.02 ([Sánchez et al. 2003]). This object was observed with VIMOS at the VLT, using the low-resolution red setup. We have reduced the data with a modified version of the P3d data-reduction software ([Becker 2001]). These data have been used as examples in Figures 1, 2 and 3.
A number of simple analysis tools has been added to E3D. Among these tools are the specarith and spaxarith routines. Both routines allow one to perform arithmetic operations between selected spectra and selected polychromatic maps, respectively. Figure 6 shows an example of spaxarith. This figure shows the H map of IRAS 13031-5717. To create this map we have subtracted a continuum map near H from a map centered on the emission line. This option is now included in the GUI.
5 Future work
We have designed E3D to be a data visualization and data analysis tool. It is our goal to integrate as many different tasks of the Euro3D software package as possible into E3D. In the end, this strategy will provide a powerful analysis/visualization tool. There are a number of bugs still to be fixed, some of which have been identified. A few basic requirements are still on the queue. For example, it has still to be decided how to handle different wavelength units (for now: Angstroms), and different spatial units (for now: arcsec). There is a need for improved zooming capabilities. We have to think how to treat the data quality flags, and which are the best and most flexible defaults. Different methods of selecting spaxels (area selection) have been proposed, but they have not been coded. It is still under discussion how to handle science tables, and how to plot their contents.
So far, we have tested E3D with data from a variety of instruments : INTEGRAL ([Arribas et al. 1998]), OASIS, PMAS ([Roth et al. 2000]), SAURON, SparsePak ([Bershady et al. 2003]), SPIFFI, TIGER, VIMOS, and with different mosaic patterns (e.g. [Sánchez et al. 2003]). Some memory bugs and overloading problems have been detected, rendering the program not very efficient for massive reloads of big frames. We need further investigations of how to interact with external packages (IDL, PyTHON, …), and further tests with the SHM are needed.
However, given this early stage of development, E3D seems to be a promising tool, which has already proven to be useful for visualize and help the analysis of real 3D data.
Acknowledgements.
This project is part of the Euro3D RTN on IFS, funded by the European Commission under contract No. HPRN-CT-2002-00305. I like to acknowledge: S. Foucaud for his help and M. Horrobin for his tests. A.Pécontal-Rousset, P. Ferruit and the entire Lyon group for their advice, help, and their marvelous work on the LCL library. M.M.Roth for his help on editing this manuscript.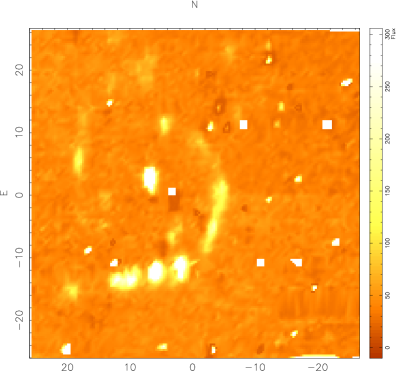
References
- [Arribas et al. 1998] Arribas S., Carter, D., Cavaller, L., et al.: 1998, Proc. SPIE, 3355, 821
- [Becker 2001] Becker, T.: 2001, PhD Thesis, Astrophysikalisches Institut Potsdam, Germany
- [Bershady et al. 2003] Bershady, M.A., Andersen D.R., Harker, J., Ramsey, L.W., Verheijen, M.A.W., 2003, PASP, submitted
- [Pecontal-Rousset et al. 2003] Pecontal-Rousset, A., Ferruit, P., et al., 2003, Euro3D Science Workshop, 21-23 May 2003, IoA, Cambridge, AN, these proceedings.
- [Gómez et al. 2003] Gómez, P., Mediavilla, E., Sánchez, S.F., et al., 2003, Euro3D Science Workshop, 21-23 May 2003, IoA, Cambridge, AN, these proceedings.
- [Kissler-Patig et al. 2003a] Kissler-Patig, M., Copin, Y., Ferruit, P., Pécontal-Rousset, A., Roth, M.M., 2003, Euro3D Data Format Definition, Euro3D Documentation.
- [Kissler-Patig et al. 2003b] Kissler-Patig, M., Copin, Y., Ferruit, P., Pécontal-Rousset, A., Roth M.M., 2003, Euro3D Science Workshop, 21-23 May 2003, IoA, Cambridge, AN, these proceedings.
- [Roth et al. 2000] Roth, M.M., Bauer, S., Dionies, F., et al. : 2000, in Proc. SPIE, Vol. 4008, 277-288
- [Sánchez et al. 2003] Sánchez, S.F., Christensen, L., Becker, T., Kelz, A., Jahnke, K., Benn, C.R., García-Lorenzo, B., Roth, M.M. : 2003, AN, these proceedings.
- [Walsh & Roth 2002] Walsh, J. R. & Roth, M. M.: 2002, The Messenger, 109, 54