High-Energy Cosmic Rays from Gamma-Ray Bursts
Abstract
A model is proposed for the origin of cosmic rays (CRs) from eV/nucleon to the highest energies ( eV). GRBs are assumed to inject CR protons and ions into the interstellar medium of star-forming galaxies—including the Milky Way—with a power-law spectrum extending to a maximum energy eV. The CR spectrum near the knee is fit with CRs trapped in the Galactic halo that were accelerated and injected by an earlier Galactic GRB. These CRs diffuse in the disk and halo of the Galaxy due to gyroresonant pitch-angle scattering with MHD turbulence in the Galaxy’s magnetic field. The preliminary (2001) KASCADE data through the knee of the CR spectrum are fit by a model with energy-dependent propagation of CR ions from a single Galactic GRB. Ultra-high energy CRs (UHECRs), with energies above the ankle energy at eV, are assumed to propagate rectilinearly with their spectrum modified by photo-pion, photo-pair, and expansion losses. We fit the measured UHECR spectrum assuming comoving luminosity densities of GRB sources consistent with possible star formation rate histories of the universe.
For power-law CR proton injection spectra with injection number index and low and high-energy cutoffs, normalization to the local time- and space-averaged GRB luminosity density implies that if this model is correct, the nonthermal content in GRB blast waves is hadronically dominated by a factor -200, limited in its upper value by energetic and spectral considerations. Calculations show that 100 TeV – 100 PeV neutrinos could be detected several times per year from all GRBs with kilometer-scale neutrino detectors such as IceCube, for GRB blast-wave Doppler factors . GLAST measurements of -ray components and cutoffs will constrain the product of the nonthermal baryon loading and radiative efficiency, limit the Doppler factor, and test this scenario.
keywords:
Gamma Ray Bursts, Cosmic Rays, Gamma Rays, Neutrinos1 Introduction
In this paper we develop a model for high energy cosmic rays (HECRs; here defined as eV/nucleon CRs), based on the underlying assumption that CRs are accelerated in the relativistic and nonrelativistic shocks found in GRBs and their attendant supernovae (SNe). This model extends the work of Vietri vie95 and Waxman wax95 , who proposed that UHECRs originate from GRBs (see also Ref. mu96 ), to include cosmic ray production from SNe and GRB sources in our Galaxy der02 . To test the model, KASCADE ulr01 ; ber01 ; kam01 and HiRes-I and HiRes-II Monocular data hires are fit over the energy range eV to eV. A good fit to the entire data set is possible if CRs are injected with a power-law spectrum with number index , as could be expected in a scenario where particles are accelerated by relativistic shocks bo98 ; kirk .
CRs that are injected with energies eV diffuse through and escape from their host galaxy. The sources of high-energy CRs, namely GRBs, are located in star-forming regions found in the galaxy’s disk. CR transport in the disk and halo of the Milky Way is modeled using a time-dependent, spherically-symmetric propagation model that employs an energy-dependent, spatially-independent diffusion coefficient. The random-walk pathlengths are assumed to arise from gyroresonant, pitch-angle scattering of CRs with a magnetohydrodynamic (MHD) turbulence spectra that can be decomposed into two components reflecting different power-law distributions of turbulence over different wavelength ranges. The spectral break at the CR knee energy is explained in an impulsive, single-source model for HECRs if the turbulence spectral index changes from Kraichnan to Kolmogorov turbulence near the wavenumber resonant with CRs at the knee of the CR spectrum. We model the preliminary KASCADE data reported in 2001 by assuming that all ionic species have the same injection index, with the compositions of the ions adjusted to fit the observed CR spectrum near the knee. Additional hardenings of the low-energy CR spectrum from a single GRB source of HECRs can result both from energy-dependent diffusion and from a low-energy cutoff in the CR injection spectrum. Superposition of the contributions from many SNe are assumed to accelerate the bulk of the GeV/nuc – TeV/nuc CRs, as in the conventional scenario gs64 ; hay69 .
UHECRs have such large gyroradii and diffusion mean free paths that they are assumed to escape directly from the halo of the GRB host galaxy and stream into metagalactic space. The UHECR energy spectrum evolves in response to photo-pair and photo-pion losses on the redshift-dependent cosmic microwave background radiation (CMBR), which we treat in a continuous energy-loss formalism. UHECRs in intercluster space also lose energy adiabatically due to cosmic expansion. The measured UHECR spectrum arises from the contributions of sources throughout the universe, with an intensity that depends on the local luminosity density of GRB sources and the evolution of the GRB luminosity density with redshift (see Refs. nw00 and mes02 for recent reviews of UHECRs and GRBs, respectively). The UHECR spectral model assumes that many sources produce the measured ultra-high energy and super-GZK ( eV) CRs.
Our model for UHECRs from GRBs implies a local time- and space-averaged CR luminosity density of CRs. The local () luminosity density ergs Mpc-3 yr-1 is inferred from BATSE observations of the hard X-ray/soft -ray (X/) emission from GRBs wb99 ; bd00 ; der02 . The value of depends sensitively on the minimum energy of CR injection for soft injection spectral indices . For if GeV then more energy must be injected in nonthermal hadrons than is observed as X/ emission from GRBs. If TeV, then more energy is required. Such large baryon loads would provide a bright cascade emission signature in GRB spectra at MeV – GeV energies through photopion or hadron synchrotron processes bd98 ; zm01 .
The large nonthermal baryon load, , required to fit the UHECR data assuming that the GRBs comoving luminosity density traces the star formation rate (SFR) history, implies that GRBs can be much more luminous neutrino sources than predicted under the standard assumption that the energy injected into a GRB blast wave in the form of CRs is equal to the energy inferred from X/ fluence measurements of GRBs da03 . We therefore predict that if this model is correct, and CRs are accelerated and injected in the form of soft power-laws with index , then IceCube should detect up to several neutrinos from the brightest GRBs with total X/ radiation fluence at levels erg cm-2. This prediction holds both in a collapsar scenario when the Lorentz factors of the relativistic outflows are , or if the GRB takes place in an intense external radiation background for a wide range of . Lower limits to can be inferred from -ray transparency arguments applied to observations of GRBs with the Gamma-ray Large Area Space Telescope111http://www-glast.stanford.edu/.
We also consider whether this model can explain the AGASA data tak98 for the UHECRs. Poor fits are found if GRBs inject soft CR spectra with . However, if GRBs inject hard spectra with , for example, through a second-order relativistic shock-Fermi process dh01 or through the converter mechanism derishev03 , then the highest-energy AGASA data can be fit, though the reduced of our best fits are not compelling. Because the injection spectrum is so hard, most of the produced high-energy neutrinos are too energetic and the flux too weak to be detected with IceCube, though other telescope arrays, such as the Extreme Universe Space Observatory (EUSO), could be sensitive to these GZK neutrinos. To explain the CRs below eV, an additional component of CRs would still be required either from GRBs or another class of sources, and these would make an additional contribution to high-energy neutrino production.
Section 2 gives a discussion of the CR and photon luminosity density of GRBs and their event rate. Our propagation model describing CR diffusion in the disk and halo of the Galaxy is presented in Section 3, where we fit the KASCADE data between and 200 PeV with a single Galactic GRB source pc away that took place around 200,000 yrs ago. In Section 4, we describe our calculation of the UHECR flux, including energy losses from cosmic expansion, and photo-pair and photo-pion production. We present minimum fits to the high-energy KASCADE, HiRes-I and HiRes-II Monocular data covering the energy range eV to eV. We also fit the AGASA data from eV to eV for hard CR injection spectra. Section 5 presents new high-energy neutrino calculations from hadronically dominated GRBs, and our predictions for km-scale high-energy neutrino telescopes such as IceCube or a deep underwater, northern hemisphere array. Discussion of the results and conclusions are given in Section 6. Our treatment of the UHECR attenuation and flux calculation is described in Appendix A.
2 Gamma Ray Burst Model for High-Energy Cosmic Rays
The progenitor sources of HECRs are likely to be GRBs, as suggested by the following observations:
-
1.
The evidence from KASCADE kam01 that the break energies of the different CR ionic species are proportional to rigidity, and that the mean atomic mass increases with through the knee region, admits a propagation solution to understand the energies of the spectral breaks of different CR ions—given a galactic source that injects power-law CRs to the highest energies.
- 2.
-
3.
The CR all-particle spectrum breaks at PeV by units and then extends without spectral change, other than for a possible weak softening above the second knee, to the ankle at eV som01 . A single power-law injection source, modified by acceleration and transport effects, provides the simplest solutions.
A comprehensive model of HECRs therefore seems achievable if a source type that injected power-law distributions of relativistic CRs were found in star-forming galaxies such as the Milky Way, with injection episodes frequent and energetic enough to power the HECRs. For reasons reviewed in Refs. der02 and der01a , GRBs offer the most likely solution.
2.1 Local GRB and Super-GZK Emissivities
We first address the question of the local () time- and space-averaged GRB luminosity density (or emissivity) (ergs Mpc-3 yr-1) and the local luminosity density required to power the super-GZK ( eV) CRs. Pre-Beppo SAX estimates vie95 ; wax95 concerning the X/ emission from GRBs found
| (1) |
with . This exceeds the local () GZK emissivity ergs Mpc-3 yr-1 required to power eV CRs, where ergs cm-3 is the observed energy density in eV CRs ( for HiRes and for AGASA), and the photo-pion energy-loss timescale for a eV proton is Mpc/ sta00 . A better estimate that corrects for the energy-dependence of implies ergs Mpc-3 yr-1, comparable with the GRB emissivity , so that the required luminosity density to power the super-GZK CRs is in coincidence with that available from GRBs.
Based on the study by Böttcher and Dermer bd00 of BATSE statistics in the external shock model, a value of was derived der02 using an analytic fit to the SFR derived from Hubble Deep Field measurements Madau . This emissivity includes, in addition to the photon luminosity that is dominated by hard X-ray and -ray emission, an inefficiency factor for production of photons due to the radiative regime implied by the fits to the data bd00 , and a further correction for dirty and clean fireballs dcb99 , which have since been discovered Heise .
Removing the inefficiency factor from the estimate of Ref. der02 gives the local GRB emissivity in the form of nonthermal photon radiation to be . Vietri, de Marco, and Guetta vmg03 argue for a value of . Given the various uncertainties, we take the local GRB emissivity in the form of hard X-rays and 100 keV – MeV -rays from GRBs to be
| (2) |
2.2 Beaming and GRB Rate
A second issue to be considered is the source rate of GRBs in our Galaxy. Beaming breaks in the optical light curves of GRBs indicate that the most apparently luminous GRBs are highly collimated. Frail et al. fra01 argue that a typical GRB has a beaming factor of 1/500th of the full sky, so that GRBs are in actual fact 500 times more numerous, and 1/500th as energetic on average, as the measured energy releases imply. This means that most GRBs typically release ergs in X/ emission.
The local density of spiral galaxies, of which the Milky Way is representative, can be derived from the Schechter luminosity function, and is (200–500 Mpc3) wij98 ; der02 . The BATSE observations imply GRBs/day over the full sky ban02 . Due to beaming, this rate is increased by a factor of , where . Given that the volume of the universe is Mpc), this implies a rate per galaxy of
| (3) |
The factor corrects for the star-formation activity at the present epoch [] (see Section 4), and the factor accounts for dirty and clean fireball transients that are not detected as GRBs bd00 . This estimate is in agreement with the result of Ref. vmg03 that excludes short GRBs. Thus a GRB occurs about once every 3–10 millennia throughout the Milky Way, or at about 10% of the rate of Type Ib/c SNe.
We write for the local luminosity density of CRs injected by GRBs, where is the nonthermal baryon-loading factor by which the emissivity injected by GRBs in the form of hadronic CRs exceeds the emissivity inferred from direct observations of the X/ emission from GRBs. In the following, we take (eq. 2). From eqs. (3) and (1), we find that the average apparent isotropic energy release per GRB is ergs, and the smaller actual mean energy release per GRB due to beaming and the consequent larger number of GRB sources is ergs.
For our canonical model GRB used to fit CR data near the knee, we take ergs, corresponding to . A value of is implied by the data fits if this model for HECRs is correct (Section 5). Hence, in a unified model for HECRs from GRBs, the GRB blast wave must be strongly baryon-loaded with , at least during the prompt phase of the GRB when the acceleration is most rapid.
3 Galactic Cosmic Rays from GRBs
Observations indicate that GRB sources are located in the disks and star-forming regions of galaxies undergoing active star formation, such as the Milky Way. The relativistic ejecta in the GRB explosions accelerate and inject CRs into the ISM of the GRB host galaxy in the form of a power law to the highest energies, though possibly with a low-energy cutoff to the accelerated proton spectrum. In relativistic blast waves, this cutoff is expected at GeV energies, which could easily reach TeV – PeV energies for typical GRB blast waves with – 300. UHECR acceleration and injection probably occurs during the -ray luminous phase of a GRB, which is on the order of minutes to hours. Acceleration and injection of lower energy CRs might operate on the Sedov time scale, which could exceed thousands of years. These acceleration times are still short compared to the times for particles with the corresponding energies to diffuse a distance comparable to the disk scale height, as can be shown from the diffusion properties of the Galaxy derived below. A GRB source can therefore be treated as an impulsive source of CR injection.
In this section we present a simplified propagation model for CRs in the disk and halo of the Galaxy.
3.1 Diffusion Mean Free Path
We assume that the Galaxy’s disk and halo magnetic field consists of a large-scale field of mean strength G on which is superposed a spectrum of MHD turbulence. The diffusion mean-free-path for CRs diffusing through this field is a function of the Larmor radius
| (4) |
where is the Lorentz factor of the relativistic CR proton or ion with atomic mass , , and the pitch angle is set equal to . We assume isotropic turbulence, though it is straightforward to generalize the treatment for particle-scattering properties that differ in directions parallel and transverse to the plane of the disk.
We consider a very simplified approach to CR transport where particles diffuse via pitch-angle scattering with resonant MHD turbulence; see, e.g., Refs. bs87 ; dml96 ; cb98 ; bla00 , and Ref. sch02 for a detailed treatment. Let represent the differential energy density of isotropic MHD turbulence with wavenumbers between and . First consider the case where the MHD turbulence spectrum is described in the inertial range by a single power-law function , where when and otherwise, and is the spectral index of the wave spectrum. The index for a Kolmogorov spectrum of turbulence, for a Kraichnan spectrum of turbulence, and is the total energy density of MHD turbulence when and . Note that this description of the wave turbulence is an extreme oversimplification, insofar as we do not consider different wave modes and helicities, or distinguish between forward- and backward-propagating waves.
The ratio of the MHD wave energy to the energy density of the large-scale component of the Galactic magnetic field is denoted by , so that for . The value of corresponds to the inverse of the largest size scale on which turbulence is injected.
We make the ansatz that the diffusion coefficient of a CR with Larmor radius is inversely proportional to the the energy density in gyroresonant waves with wavenumber dru83 . We therefore have , giving
| (5) |
where pc-1.
Equation (5) gives the mean-free path of relativistic () CRs that diffuse due to gyroresonant interactions with large-wavenumber () turbulence. When , or pc, CRs gyroresonate with small-wavenumber () turbulence. If the knee in the CR all-particle spectrum at PeV is due to propagation effects, then when for the dominant CR proton species. The break energies in the spectra of other CR ions are also given by the relation , so that the knee energies for the different CR ions occur at energies
| (6) |
The fit to the data described below uses and . If the value of , corresponding to the ratio of the energy density turbulence to is a few percent, then for PeV CR protons, where is the scale height of molecular gas or massive stars in the disk of the Milky Way. A break in the all-particle spectrum due to a change in the propagation mode occurs at PeV, where , with a pattern of break energies for the ionic constituents of the CR all-particle spectrum.
Although a CR proton with energy has pc , its mean-free-path because pitch-angle scattering results only from gyroresonant interactions with MHD waves that constitute a small fraction of the total magnetic field energy density. CRs injected with will diffuse through the Galaxy’s disk and halo through gyroresonant pitch-angle scattering with MHD turbulence carried by waves with wavenumbers that gyroresonate with particles with . This suggests that we consider a more general wave spectrum over a larger range of given by the expression
| (7) |
where is the index of the small wavenumber MHD turbulence, and normalizes the energy densities of the small () and large () wavenumber turbulence spectra at . The normalization condition implies , from which the normalization coefficient can be easily derived.
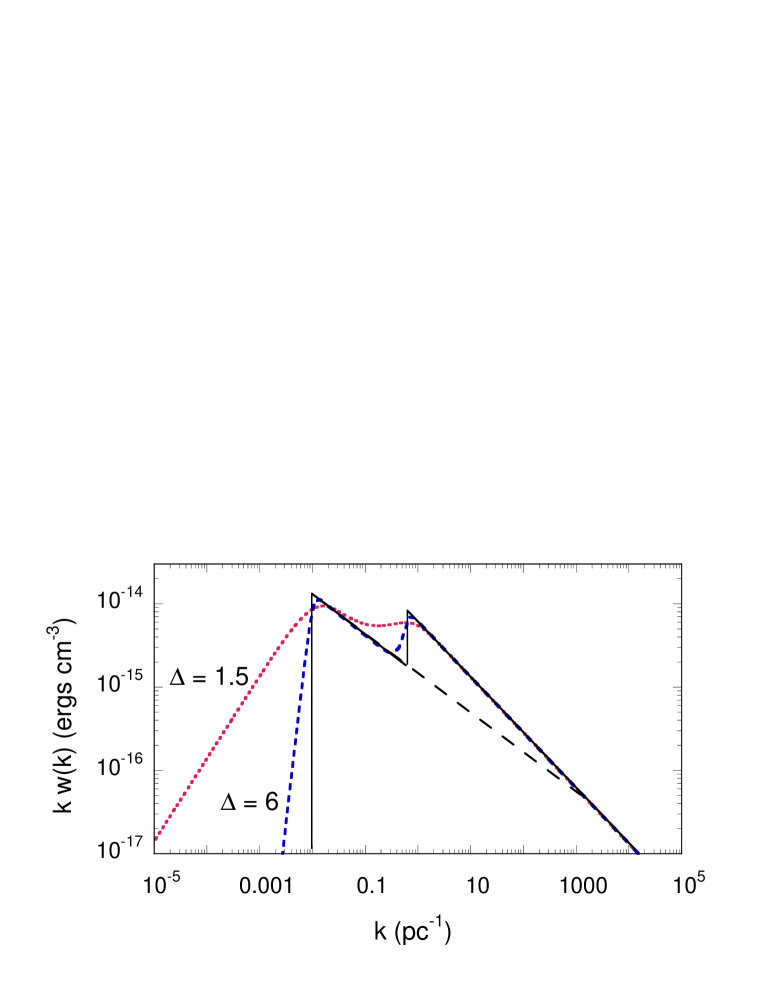
The wave spectrum from eq. (7) is plotted in Fig. 1 by the solid lines. The parameters are pc-1, pc-1, , , , , and G. Sixty-five percent of the turbulence energy density is in the small wavenumber component, so that . The sharp edges in this wave spectrum introduce unphysically sharp features in the spectra of particles for this simple model of transport. A more physically plausible turbulence spectrum that retains the features of eq. (7) but smooths the particle distribution function, as would be physically expected from 3-wave interactions and turbulence-energy diffusion and cascading sg69 , is given by
| (8) |
where the smoothing function , and we let . Eq.(8) reduces to eq. (7) in the limit . Fig. 1 shows a plot of eq. (8) with and, for comparison, . The subsequent fits to the data use the MHD wave spectrum, eq. (8), with .
The ansatz with therefore implies
| (9) |
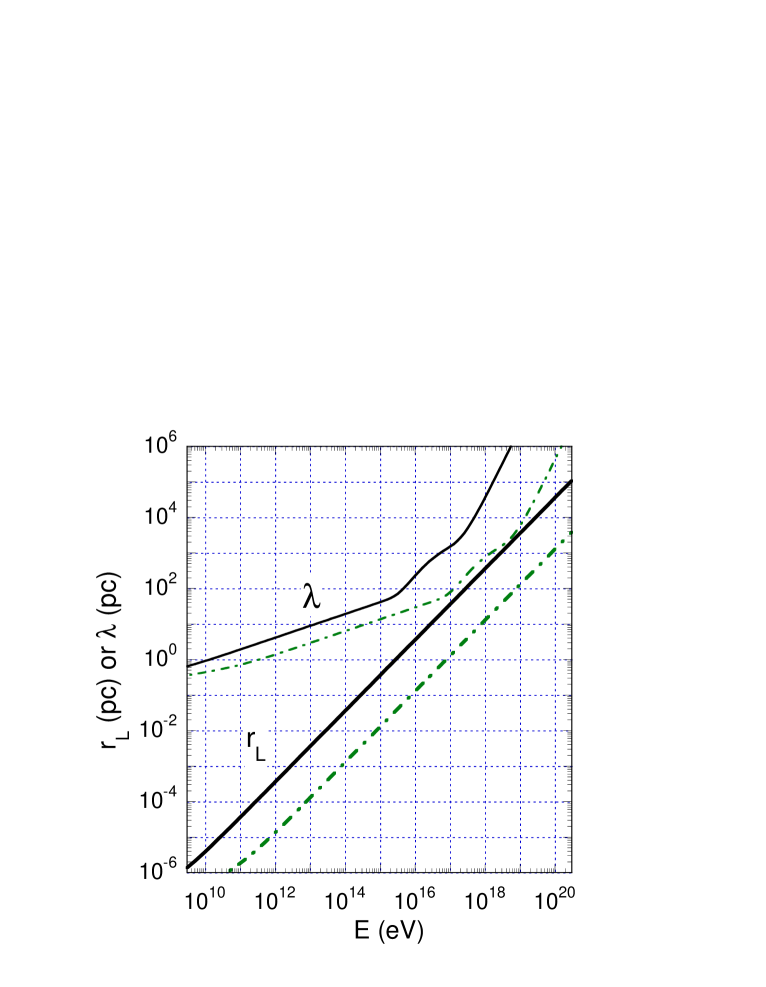
In Fig. 2, we plot and as a function of total energy for CR protons and Fe nuclei. The turbulence spectrum is given by Fig. 1 with . Note that kpc when the CR proton energy eV. This energy is near the onset of quasi-rectilinear propagation in a Galactic halo of size kpc, and we expect a cutoff in the CR proton flux from a recent GRB in this energy range whenever we are not in the beam of a GRB jet (which is nearly always true because of the extreme improbability of such an occurrence). The energy-dependent cutoff will be , as observed. The actual situation is of course more complicated due to the magnetic field gradient from the disk to the halo and into metagalactic space.
3.2 Three Dimensional Isotropic Diffusion
We assume that a GRB injects a total energy ergs in the form of cosmic rays. For impulsive injection, the number injection spectrum of CRs with atomic charge and atomic mass is assumed to be given by for , and we assume that is the same for all (). When , , and ,
| (10) |
If , ,
| (11) |
Cosmic rays are assumed to diffuse isotropically in the interstellar medium, with the initial anisotropy from injection by the GRB jet quickly washed out. For energy-dependent diffusive propagation, the spectral number density of relativistic CR ions with charge and mass measured at a distance pc away from an impulsive source of CRs from a GRB that occurred a time earlier is
| (12) |
Here the diffusion radius , and eq. (12) assumes that CRs suffer no significant energy losses during transport (see Ref. aav95 for the more general case).
Inspection of eq. (12) shows that when the observer is within the diffusion radius, that is, when , then
| (13) |
The measured spectrum from a burstlike source is therefore steepened by units, where the diffusion coefficient aav95 . (By comparison, the spectral index is steepened by units for continuous injection sources of CRs.) Eq. (13) shows that energy-dependent diffusion due to pitch-angle scattering with a Kolmogorov and Kraichnan spectrum of MHD turbulence steepens the injection spectrum of an impulsive source by 0.5 and 0.75 units, respectively. If the disk and halo magnetic fields of the Galaxy support a two-component MHD turbulence spectrum with indices and , then an injection spectrum with will be steepened to a measured spectrum , with at and at . Because these indices are similar to the measured CR indices below and above the knee energy, we adopt this simplified model for CR transport. Speculations concerning the origin of such a turbulence spectrum are deferred to Section 7.
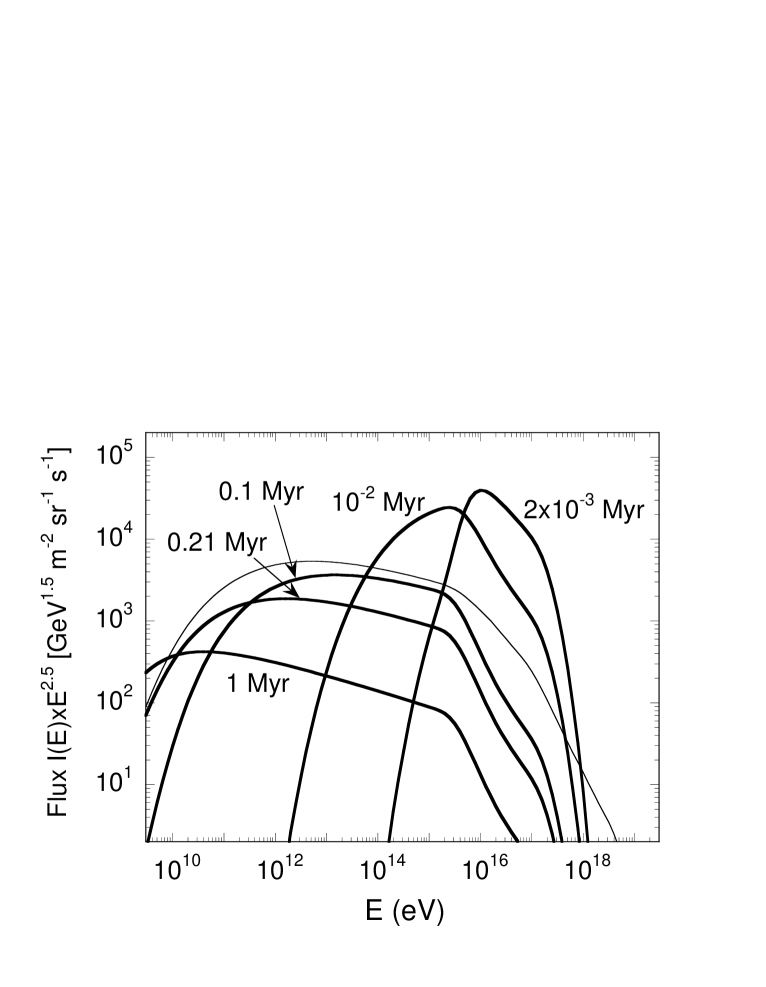
Fig. 3 shows the CR proton flux measured at Earth at different times after a GRB explosion located 500 pc from Earth. The low-energy cutoff energy is given by , so that most of the energy is deposited by GeV/nuc CRs. When , the CR intensity is increased at energies above the low-energy cutoff by the factor .
The flux of relativistic CRs is calculated from the expression
| (14) |
where and is in cgs units. Propagation effects arising from the combined disk and halo MHD turbulence spectrum produce a break in the spectrum at PeV. The index of the CR number fluxes above the knee is , for the reasons given above, until propagation effects at the “second knee” at eV start to soften the spectrum so that the metagalactic component begins to make a dominant contribution.
The observer is within the diffusion radius when , or when . If we are considering CRs with energies below the knee, then these particles scatter with the large wavenumber , turbulence, so that . We write pc, where the observer is irradiated by a CR flux from a GRB that took place Myr ago. At early times following the GRB, the low-energy portion of the measured CR spectrum from a GRB source is exponentially attenuated due to the slower diffusion of lower energy CRs. The observer will see the maximum flux from CRs with energies when
| (15) |
This expression uses the parameters for the model fits discussed below, with and , thus showing that the maximum flux of CR protons near the knee energy reaches an observer 500 pc away years after the GRB, in accord with Fig. 3. Eq. (15) shows that the low-energy cutoff of the CR proton flux in Fig. 3 evolves according to the relation . Note that eq. (15) is only valid when .
Fits to the CR data near the knee are compatible with a 500 pc distant GRB releasing ergs in cosmic rays if the GRB took place yrs ago. This implies that the 0.1 – 100 PeV CR fluxes were up to 100 times brighter one or two hundred thousand years ago than they are today, though no test of this implication suggests itself.
3.3 Fits to the KASCADE Data
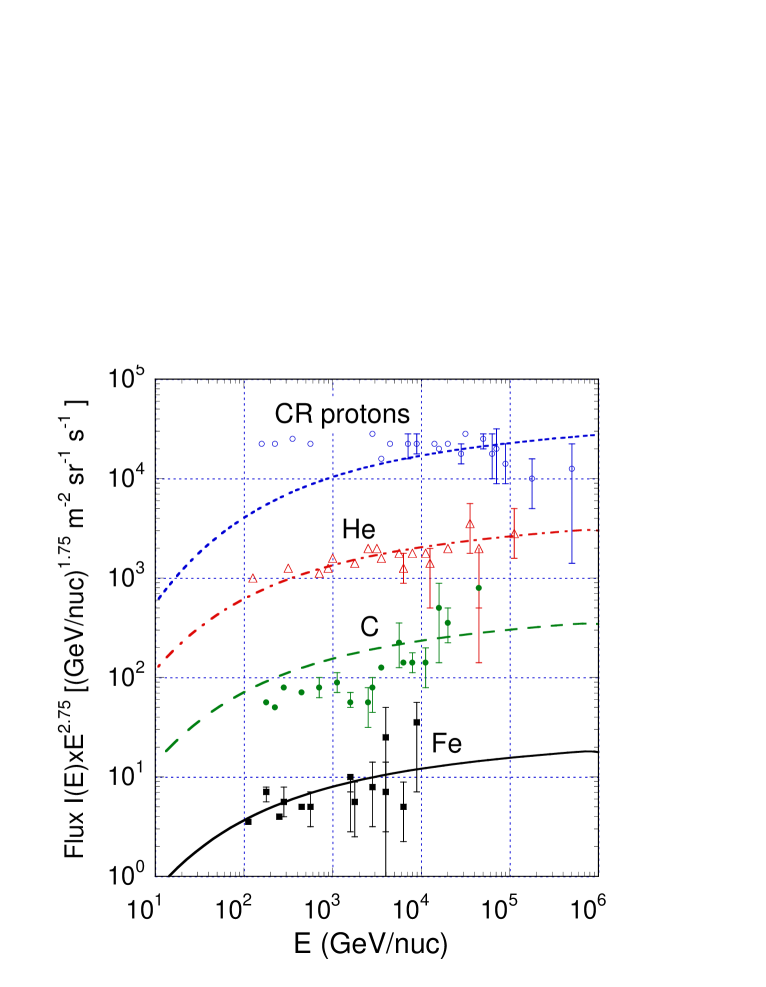
We now apply this model to fit the preliminary KASCADE data announced in 2001 ulr01 ; ber01 ; kam01 . The points in Fig. 4 show KASCADE data and error bars for CR protons, He, Carbon, Fe, and the all-particle spectrum in panels (a) – (e), respectively. Fig. 4(d) also shows the reported 1 boundary to the estimated systematic errors for CR Fe.
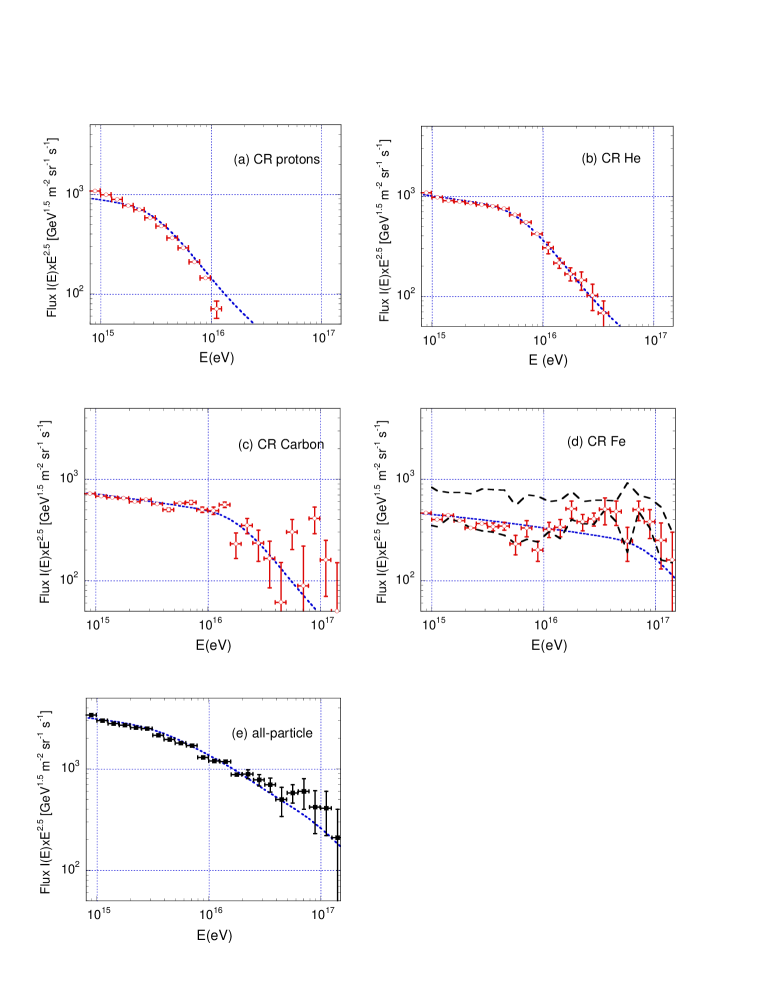
The fits to the KASCADE data shown in Fig. 4 use the propagation model previously described, with a GRB source of CRs at a distance pc that exploded 210,000 yrs ago. The change in the diffusion and propagation properties leads to a break in the CR particle spectrum at break energies (eqs. [5] and [6]). Because of the preliminary nature of the data and the potentially significant systematic errors that could still remain in the early analyses, we did not perform a rigorous fit to the data, but instead adjusted the wavenumber and the compositions of the different ionic species until a reasonable fit to the data was obtained. With G, the best value for the energy-dependent break was obtained with pc in the spectrum of turbulence.
The Anders-Grevesse Solar photospheric composition ag89 , and the (energy-independent) metallicity enhancements, compared to the Anders-Grevesse compositions, that were used to fit the data, are listed in Table 1. The strong enhancements by a factor of 50 and 20 for C and Fe, respectively, may be possible from highly-enriched winds that could be peculiar to a GRB stellar progenitor, or if there was an earlier supernova as in the supranova model. Note that O cannot be strongly enhanced if we are to maintain a good fit to the all-particle spectrum. A more detailed discussion about implications from composition will depend on fits to final analysis of KASCADE data rot03 .
| Ion | Enhancement | |
|---|---|---|
| 1.00 | 1.0 | |
| 0.098 | 1.6 | |
| 50 | ||
| 20 |
As can be seen from Fig. 4, this model gives a reasonable fit to the data for the CR ion and all-particle spectra around the knee. Thus we argue that propagation effects from CRs injected and accelerated by a single GRB are responsible for the shape of the CR spectrum between and 100 PeV.
This model must not overproduce CRs at energies below the knee. Fig. (5) compares CR observations with a model that fits the KASCADE data and has an injection momentum at . This model weakly overproduces the CR Carbon ions, though it is not a serious discrepancy given the uncertainty in the KASCADE data which determines the CR Carbon composition. A strong overproduction would imply a low-energy cutoff in the energy of the injected cosmic rays, or an earlier GRB. A model with a low-energy cutoff at GeV would certainly be consistent with the medium-energy cosmic rays. In the proposed scenario, SN contributions to CR production make up the difference between CRs produced by a single GRB source and the measured CR fluxes below TeV/nuc. The transition from multiple SNs source to, primarily, a single source seems to occur at energies of – 100 TeV/nuc.
3.4 Probability of Nearby GRB and CR Anisotropy
We estimate the probability that we find ourselves in the midst of a CR bubble formed by a recent, nearby GRB using the relation . The quantity measures the relative area of the Milky Way’s disk covered by a CR bubble with age , and is the number of GRBs that would have taken place during . We normalize the rate of GRBs in the Milky Way to GRBs per millennium, and –0.3 (Section 2). Thus .
Using model parameters, kpc. Most of the active star formation in the Milky Way takes place within the spiral arms found within kpc. Thus , and the probability is very unlikely when , or when . The model fits use a time of 0.21 Myr since the GRB exploded to fit the CR data, so there is a reasonable probability for this event to have taken place, even with .
CRs from a GRB event that occurred much earlier than 0.2 Myr cannot fit the data unless the total energy release in CRs from a single GRB is increased, which makes severe demands on GRB models (see Fig. 3). For the estimated values of the diffusion coefficient, CRs from a GRB that occurred much later than Myr also makes severe energy demands on the GRB source. Thus a GRB event occurring a few hundreds of millennia ago represents the most probable situation.
The anisotropy gp76 . Substituting eq. (12) gives
| (16) |
The interesting point about eq. (16) is that is independent of energy for this diffusion model.
Analyses of the arrival directions of large numbers of CRs show anisotropies near 3 PeV at the % level wat84 ; hil84 . When is between 100 GeV and 100 TeV, anisotropies of % are found. Schlickieser sch02 discusses some sources of uncertainty in anisotropy measurements. An anisotropy of % is implied from eq. (16) for . If an anisotropy below % is confirmed, then a number of implications follow. Either we are located near a rather recent GRB, which could be unlikely, or the CR energy release from GRBs is larger than given here. Moreover, there could be contributions from a second GRB that would help isotropize the flux. Indeed, CR contributions from a multitude of weaker SNe that do not host GRBs could also help isotropize the CR flux. We discuss the relative contributions of SNe to the CR spectrum in Section 7.
4 Ultra-High Energy Cosmic Rays from GRBs
In our model, the UHE component of the CR spectrum is produced by extragalactic GRBs. Throughout our calculations we take the local GRB luminosity density in CRs to be where is given in eqs. (1) and (2), and is the nonthermal baryon-loading fraction required by a GRB model of HECRs. Our fits to the data imply values for .
We assume that the GRB cosmic rate-density evolution, in comoving coordinates, follows the SFR history Madau derived from the blue and UV luminosity density of distant galaxies, with an analytic fitting profile given by
| (17) |
der01 , where is the GRB comoving rate density at epoch . To accommodate present uncertainty in the true SFR evolution we take two models with , , and in line with the extreme ranges of optical/UV measurements without (with) dust extinction corrections. The lower optical/UV curve is arguably a lower limit to the SFR evolution, while a much stronger evolution of the SFR is found by Blain et al. Blain99 after correcting for dust extinction. To study the significance of this uncertainty we consider a “lower SFR” and “upper SFR” in each of our model fits. We plot these SFR histories in Fig. 6 in comparison with an oversimplified evolution used by other authors Scully ; Berez , who perform similar UHECR calculations.

Both our upper and lower SFR evolution differ significantly from the evolution , when . For eV CRs, this difference is irrelevent as all of these CRs must have orginated from due to severe CR attenuation during propagation, but the differing SFRs have an important effect on the predicted CR flux at energies eV.
Results from the Wilkinson Microwave Anisotropy Probe ben03 and the High- Supernova Search Team Tonry favor a -cold dark matter (CDM) cosmology where and , assuming a dark energy equation of state with and We use this set of cosmological parameters throughout. Our treatment of the UHECR flux calculation, including attenuation during propagation, is presented in Appenix A.
4.1 KASCADE and HiRes Data Fits
Our fits to the KASCADE and HiRes-I and HiRes-II Monocular data cover the energy range from eV to eV. The low energy CRs are from galactic GRBs (Section 3) and the high energy flux is a superposition of extragalactic GRB sources. The region where the combined flux changes from halo-dominated to extragalactic-dominated is near We carry out 8 different calculations where in each case our minimum- routine fits the halo and extragalactic normalizations and finds the best-fit value for The value of in turn fixes parameters in the halo propagation model.
We take characteristic values for the maximum cutoff energy from acceleration in relativistic shocks of eV and eV. The spectral indices we consider are where the CR energy is injected equally over all decades in energy-space, and where optimal fits are found in our Galactic diffusion model. The upper and lower SFR evolution cases are studied in turn. For each case our model has three free parameters: 1) the CR halo-component cutoff energy ; 2) the local CR luminosity density of extragalactic GRBs; and 3) the relative intensity of the galactic halo CR component to the extragalactic component. We also consider two values of the minimum energy eV and eV for CR injection, which yield identical fits but affect the overall CR energy requirements of a typical GRB. For a soft spectrum, the baryon loading is a factor lower for the eV case than the eV case. In total, we fit 43 data points covering the highest 4 decades of CR energies. We estimate the quality of our fits with a reduced-minimum- routine for 40 degrees of freedom.
The transition region between the halo and extragalactic components falls in the range eV – eV. Thus, our data set must extend to low-enough energies to make a determination of practicable. The lower energy data we fit is from the KASCADE all-particle spectrum kam01 , starting at eV and continuing to eV. The HiRes-II Monocular data set covers eV to eV, while the HiRes-I Monocular data covers the highest energies, from eV to eV. Our best-fitting model (marked with an asterisk in Table 2) was considered in the context of the full KASCADE data set down to energies of eV.
The interplay between our model and features in the data is apparent in the 8 calculations shown in Figs. 7 – 9 and with the results listed in Table 2. The steepening in the data near the second knee ( eV) is a feature which rules out cases with This assumes that the intercalibration between the KASCADE and HiRes data is accurate, a conclusion that could be modified if reanalysis of the HECR data reveal calibration uncertainties. The extragalactic flux for spectra fall well below the data at eV leaving the halo component incapable of fitting the data both above and below the second knee. Our best fitting set of model parameters is with , eV, and the upper SFR history. This case puts the transition between galactic and extragalactic CRs in the vicinity of the second knee, consistent with evidence for a heavy-to-light composition change in this energy range fly93 . The ankle energy (at eV) has a simple interpretation as a suppression of the UHECR flux from the photo-pair process (analogous to the GZK suppression from photo-pion production).
The extragalactic contribution to the CR flux in the eV – eV range is driven by the strength of the SFR evolution. The flux below eV is markedly higher in the upper SFR case because the UHECRs produced at redshift are readily swept down to eV by propagation effects (see Appendix A). A similar result was obtained Scully ; Berez in the case when the cosmic evolution of GRB sources changes , which approximates the upper SFR to but then diverges from the upper bound to the SFR derived in Ref. Blain99 , hence predicting too high a flux at eV.
| Spectrum, | (eV) | SFR evol. | (eV) | ||
|---|---|---|---|---|---|
| 2.2 | lower | 1.28 | 821(77.5) | ||
| 2.2 | lower | 3.10 | 677(65.3) | ||
| 2.2∗ | upper | 1.03 | 746(70.3) | ||
| 2.2 | upper | 2.64 | 617(59.5) | ||
| 2.0 | lower | 2.77 | 38.9(21.2) | ||
| 2.0 | lower | 3.57 | 21.0(12.2) | ||
| 2.0 | upper | 2.45 | 35.2(19.2) | ||
| 2.0 | upper | 3.58 | 18.6(10.9) |
4.2 AGASA Data Fits
The reported AGASA flux above eV provides a clue that UHECRs may violate the GZK-cutoff. We explore this possibility within the context of an astrophysical source with a hard () spectrum and cutoff eV sufficient to produce a super-GZK flux. The results of five models are presented in Figure 10 with fits to AGASA’s highest nine energy bins. For hard CR-spectra GRB sources, the CR energetics are not a problem because the high-energy portion of the spectrum receives most of the nonthermal CR energy. However, it is clear from our fits that if a super-GZK flux is verified by observations with the Auger Observatory, it calls for either a multi-component model of astrophysical sources (including nearby sources) or new physics in the form of top-down (for recent reviews, see Refs. topdown ; topdown1 ) or hybrid (for some examples, see Refs. hybrid ; hybrid1 ; hybrid2 ) scenarios.


5 High-Energy Neutrinos from Gamma-Ray Bursts
The prediction of our model that the energy output in relativistic protons and nuclei accelerated by relativistic shocks of GRBs can be much larger than the total power inferred from the observed X-ray/MeV radiation, , suggests a very important conclusion concerning the question of detectability of GRBs by forthcoming km-scale neutrino detectors like IceCube.
A recent study da03 of this question shows that, at best, only from the brightest fraction of GRBs with neutrino fluence in the prompt phase exceeding erg cm-2, would it be possible to detect multi-TeV neutrinos by IceCube. This is a general model-independent result which only assumes that the radiation fluence derived from the X-ray/MeV -ray measurements in the prompt phase of GRBs does not strongly underestimate the total radiation output of GRBs (that could be missed at higher energies). This result follows from the direct calculation of the number of muon neutrinos to be expected for a detector like IceCube, with an area , assuming a spectral fluence of the neutrinos erg cm-2. For a spectrum of with the spectral index (i.e., with index for the differential number fluence ), a simple derivation give for , and for (see da03 ). Thus if the neutrino fluence is comparable to the X/ photon fluence, detection of neutrinos could be expected only from very powerful GRBs, at a fluence level .
Note that corresponds to the neutrino fluence erg cm-2 integrated per each decade of energy. Note also the decline in the number of neutrinos to be expected per equal energy fluences per decade when . This is explained by the change in the detection efficiency of upward-going muon neutrinos at this energy (see ghs95 ), which can be approximated as , where for , and for . Therefore, since a typical spectrum of neutrinos expected from GRBs due to photomeson interactions of HECRs extends well beyond 100 TeV, detection of even a single neutrino at multi-TeV energies would become likely only if the total fluence in the would significantly exceed erg cm-2.
Meanwhile, the total amount of energy released in the neutrinos (including ) is only about - of the energy of secondaries resulting from photomeson interactions. Therefore at least the same amount of energy is released in the gamma-rays and electrons of multi-TeV energies produced in the secondary pion decays. For a blastwave Lorentz factor -300, the GRB radiation fields in the prompt phase are typically optically thick to photo-absorption for gamma-rays with energies above the GeV domain as is apparent from the curves in Fig. 11. Even if one assumes that the radiation in the prompt phase of a GRB is contributed only by several individual spikes, with a characteristic duration as large as -10 s, the source becomes transparent to gamma-rays below the GeV domain only in case of a collapsar GRB with Doppler-factor . Therefore most of the energy injected in multi-TeV gamma-rays will be efficiently converted to hard radiation in the X-ray to sub-GeV gamma-ray domains through the synchro-Compton photon-pair cascade developing in the relativistic shock/GRB source.
Our knowledge of high-energy ( MeV) emission from GRBs is limited to 7 GRBs detected with the spark chamber on EGRET bcs98 and the Milagrito detection of GRB 970417a atk03 . The average spectrum of four GRBs detected simultaneously with BATSE and the EGRET spark chamber from MeV to GeV is consistent with a photon number spectrum, implying that in these cases the MeV fluence does not exceed the BATSE fluence by more than a factor of a few. However, the examples of the prompt and delayed high-energy emission from GRB 940217 hur94 , the anomalous hard component detected with BATSE and the EGRET TASC from GRB 941017 gon03 , and GRB 970417a, which required times more energy in the TeV range than in the BATSE range, show that the high-energy behavior of GRBs is yet poorly measured and even more poorly understood. The baseline assumption made here is to require that the energy fluence in neutrinos not exceed the fluence observed in electromagnetic radiation at hard X-ray and soft -ray energies.
Calculations of the neutrino fluxes expected from GRBs in case of baryon-loading factor , i.e., assuming equal energies for relativistic hadrons and directly accelerated electrons (which are assumed to produce the observed radiation), show that even in the case of very powerful bursts with radiation fluence at the level ergs cm-2, which happen only few/several times per year, the probability of detection of neutrinos by a km-scale detector would remain hopelessly small in the framework of the collapsar model unless the Doppler factor or the variability time scale s. A significant contribution to the target photon field density from a radiation component external to the GRB source/blob, as in the plerionic emission in the “supranova” scenario kg02 , or from radiation scattered by the progenitor material in the circumburst environment in the collapsar model, improves chances to detect neutrinos from GRBs (see Ref. da03 for details). This is because for large Doppler factors and ergs cm-2, only a small fraction of the injected proton energy can be converted into secondaries through photomeson interactions of HECRs with internal photons.


The current model for the origin of galactic high and ultra-high energy CRs from GRBs requires that the nonthermal baryon loading factor , and this prediction will be tested by the IceCube class neutrino detectors. In Fig. 12a we show the neutrino fluxes expected in the collapsar scenario from a burst at the radiation fluence level , calculated for 3 values of the Doppler factor assuming a GRB source at redshift (for ). In order to demonstrate clearly the dependence of the neutrino fluxes on , here we fixed the baryon-loading factor at a value for 3 values of . As in Fig. 11, for calculations in Fig. 12a we assume that the prompt emission is contributed by spikes with characteristic timescales each, which define the characteristic size (in the proper frame) of individual spikes through .
The numbers of (muon) neutrinos to be expected by IceCube for and 300 are and 0.016, respectively. We should note, however, that for the assumed value of , the calculated total fluence of neutrinos (both and ) produced when is erg cm-2, i.e., by a factor larger than the assumed radiation fluence. It means that in the light of the arguments given above, the maximum value of the baryon loading that could be allowed if the high-energy radiation fluence is less than the X/ fluence for this particular case should be about 8-10, instead of 20. Consequently, the expected number of neutrinos for should be reduced to . On the other hand, in Fig. 12a the neutrino fluence for the case is equal to , so this accommodates a baryon-loading increased from up to , with the expected number of neutrinos observed by IceCube . If the radiation fluence at MeV – GeV energies is allowed to exceed the X/ fluence by an order of magnitude, a possibility that GLAST will resolve, then the expected number of detected neutrinos could be increased correspondingly.
In order to understand the degree of stability of the predicted numbers of neutrinos against the model assumptions, and most importantly with respect to the assumed number of spikes which determine the characteristic size/compactness of individual “contributing blobs,” in Fig. 12b we present the results of calculations of the fluxes assuming , corresponding to . In this case we chose a higher , anticipating a lower than previously considered fraction of energy extraction from the relativistic protons. The heavy solid and dashed curves show in Fig. 12b show the fluxes calculated for and 300, respectively, in the collapsar scenario. The corresponding total neutrino fluences are equal to and , and the relevant numbers of to be expected for IceCube are and . Correcting these numbers for the maximum acceptable level of neutrino fluence assuming , results in and for and 300, respectively, which are indeed close to the numbers derived above in Fig. 12a. Note that for the latter case, the implied baryon-loading factor would be as high as , which could still be marginally acceptable, as discussed in Section 5.1 above.
The two thin lines in Fig. 12b are calculated in the framework of a “supranova” scenario for the same values of and 300, assuming an external radiation field density in the “plerionic nebula” with age (see Ref. da03 for details of calculations). The number of neutrinos to be expected when would be practically the same as for the collapsar model, with . It is noteworthy, however, that for , the predicted probability of neutrino detection would be greatly increased relative to the collapsar model prediction, namely , which would at the same time demand a significantly smaller value for the baryon-loading factor, with only.
Although these numbers are still smaller than 1, these calculations leave a non-negligible probability for detection of 1 – 2, and hopefully up to a few, neutrinos from some of most powerful GRBs during a reasonable observation time even in the case of a “collapsar” GRB with . Note that these neutrinos would be mostly at energies where almost no background neutrinos are to be expected from a given direction to any single GRB da03 . Such a detection would be a confirmation of high baryon-loading in GRB blast waves, and would also suggest a very significant contribution of the accelerated hadrons in the observed hard radiation through secondaries produced in the photomeson interactions.
Another prediction of a hadronically dominated GRB model is the possible detection of gamma-rays in the multi-GeV energy domain by GLAST at a stage near the prompt phase when the density of radiation fields would still be sufficient for extraction of a small fraction of the energy of accelerated protons, but when the secondary gamma-rays would not be suppressed by the photo-absorption process. In case of relatively close GRBs, with , these gamma-rays could then be detectable also by ground-based gamma-ray detectors like VERITAS and HESS with energy thresholds GeV.
6 Discussion
We have proposed a model where HECRs originate from GRBs. The CR flux near the knee is assumed to result from CRs produced by a single GRB which has occurred relatively recently and not very far from us in the Milky Way. These CRs propagate diffusively in the Galactic disk and halo. The simple diffusive propagation model developed in Section 3 implies that the measured CR flux results from the modification of the injection spectrum of an impulsive CR source due to transport through a magnetic field with a given turbulence spectrum. Using a turbulence spectrum harder at smaller wavenumbers and steeper at larger wavenumebrs, we have fit the 2001 KASCADE data for CR ion spectra between and 100 PeV, and explained the change in the all-particle spectra from to . A GRB releasing ergs in HECRs, located pc away, and occurring years ago, provides reasonable fits to the KASCADE data.
Our model of a single GRB source making CRs at energies through the knee of the CR spectrum bears some similarity to the single-source model proposed by Erlykin and Wolfendale ew02 to fit data near the knee. These authors argue, however, that propagation (“Galactic modulation”) effects cannot explain the constant rigidity break of the CR ionic species, whereas we employ a propagation model to produce that break. In this respect our propagation model treats rigidity-dependent transport as in the model of Swordy swo95 and builds upon the detailed study of Atoyan, Aharonian, and Völk aav95 for the spectral modification effects due to energy-dependent diffusive propagation of CRs from a single source. Our model explains, moreover, CR data not only through the first and second knees but also at the highest energies.
The turbulence spectrum that fits the CR spectrum near the knee employs a Kraichnan spectrum at small wavenumbers and a Kolmogorov spectrum at large wavenumbers. Turbulence is thought to be generated at the smallest wavenumbers or largest size scales, with subsequent energy cascading to smaller size scales clv02 . It is interesting to note that there are two crucial length scales in our turbulence spectrum, namely pc, and pc. The generation of turbulence in the disk and halo of the galaxy at the larger size scale could be associated with halo-disk interactions (e.g., through the interactions of high-velocity clouds with the Galactic disk), which would deposit turbulence throughout the disk and the halo of the Galaxy on a size scale pc. The smaller length scale is typical of the Sedov length scale for supernova explosions in the disk of the Galaxy. Indeed, SNe would generate a large amount of turbulence energy which could make a distinct contribution to the turbulence spectrum in this wavenumber range.
The origin of the different indices of the two components of the MHD turbulence spectra at small and large wavenumbers could be related to the time available for the turbulence energy injected at the different size scales to cascade to larger wavenumbers. Medium-energy CRs with energies between – eV/nuc will diffuse by gyroresonant pitch-angle scattering in response to MHD waves with /pc. The model turbulence spectrum at large values of is given by a Kolmogorov spectrum with index , as seen in Fig. (1). Because medium-energy CRs are thought to arise from a superposition of many SNe, we can treat their transport in the framework of continuous injection. As noted previously, the measured index of CRs from continuous sources is steepened by a factor . If medium-energy CRs, whose measured number intensity index is sim83 , result from many SNe that produce CRs which diffuse through pitch-angle scattering in a spectrum of MHD turbulence with index , then it is necessary that the injection indices of these medium-energy CRs lie between and 2.4.
This is a surprising result, because it is generally thought that the strong shocks in SNe accelerate and inject CRs with an injection closer to 2.0 than 2.4 kir94 . Such a soft injection spectrum could be avoided if medium-energy CRs diffuse in a turbulence spectrum with index . In this case, the measured index is steepened by 0.5 units compared to the injection index. If the large- component with the steeper index is superposed on the extrapolation of the small- component to large wavenmbers, then at sufficiently large values of , the turbulence spectrum will change from a Kolmogorov to a Kraichnan spectrum, as illustrated by the long-dashed line in Fig. 1. In this case, a continuous injection scenario implies that an injection index of 2.2 yields an observed CR spectrum with a 2.7 number index. A injection index is in accord with expectations from nonrelativistic shock acceleration. Note that wavenumbers of 103 pc-1 are gyroresonant with TeV CR protons.
An important feature of recent GRB studies is their association with SNe. CR acceleration at SN or GRB shocks is crucial for the production of CRs from the lowest energies, GeV/nuc, to the highest energies eV. The different speeds of the SN shocks in the different types of SNe ejecta ranging from relatively slow Type II ( – 10000 km s-1) to marginally relativistic Type Ib/c is important to produce the full cosmic ray spectrum der01a ; sve03 . We therefore predict that HESS and VERITAS, with their improved sensitivity and imaging, will detect -ray emission from supernova remnants at a low level unless that SN has also hosted a GRB.
At energies eV, CRs stream out of galaxies to form the metagalactic CR component. We assume that GRBs evolve with cosmic epoch according to the SFR history of the universe, so that most of the UHECRs are produced at redshift when the SFR is greatest. The UHECRs have their spectrum attenuated by photo-pion, photo-pair, as well as adiabatic energy losses which become important for particle energies below eV. Our best fit was found to have spectral index and eV. For these parameters, a slightly better fit was found for the stronger GRB redshift evolution (“upper SFR”). Stronger GRB evolution contributes more of the extragalactic CR flux over the range eV to eV than the lower SFR case, giving a best-fit value eV. This is an effect of CR attenuation from photopion and photopair production processes where all of the CR flux produced at eV (and ) are swept to lower energies. Crucial for deriving these conclusions are the relative calibrations of the KASCADE and High-Res experiments.
Our best fit to the UHECR data gives a measure of the local GRB luminosity density required in CRs. We find for eV and . This implies that GRBs must be baryon-loaded by a factor if this model for HECRs is correct. The precise value of varies with Doppler factor according to , for a injection spectrum. Nonthermal baryon-loading factors implies that GRBs should also be luminous in high-energy neutrinos. In section 6 we calculate the fluence in neutrinos and predict that – few neutrinos of energy TeV– PeV may be observable in IceCube a few times per year from individual GRB explosions, which depends on the radiation fluence measured from GRBs at MeV – GeV energies, which is not yet well known.
In a collapsar model calculation da03 , the predicted number of neutrinos depends sensitively on , because the density of internal synchrotron photons is much larger for smaller values of . The X-ray flashes Heise may be “dirty fireball” GRBs, which are similar to classical long-duration GRBs, though with larger (thermal) baryon loading and smaller average values of dcb99 . This suggests that the X-ray flashes may be more promising candidates for neutrino detection than GRBs with peak photon energies of the flux at several hundred keV energies.
The low statistics of current data at the highest energies make unclear the presence or absence of a super–GZK UHECR component. The HiRes data appears to be consistent with the GZK effect, thereby favoring an origin of UHECRs in “conventional” astrophysical sources. If the UHECR flux is found to exceed predictions of a GZK cutoff, then this could be evidence of new physics, could indicate the existence of super-GZK sources of cosmic rays within Mpc from Earth, or both. Our current interpretation of the data is made uncertain by results from the AGASA experiment tak98 which reveals a super-GZK flux, in conflict with the HiRes and Fly’s Eye data hires (see, however, Ref. mbo03 , who argue that the discrepancy is not serious given the uncertainties in calibration and the statistical variance of CR fluxes measured at such high energies).
The possibility of new physics associated with a super-GZK CR flux has generated much interest. Scenarios for a super-GZK flux include the Z-burst scenario hybrid , magnetic monopole primaries hybrid1 ; hybrid2 , and the decay of supermassive relic particlestopdown . (For a recent review, see Ref. topdown1 .) Another approach to generate super–GZK fluxes is from astrophysical sources distributed within a GZK–distance from Earth, Mpc. The Auger detector should resolve this question by measuring events per year above eV.
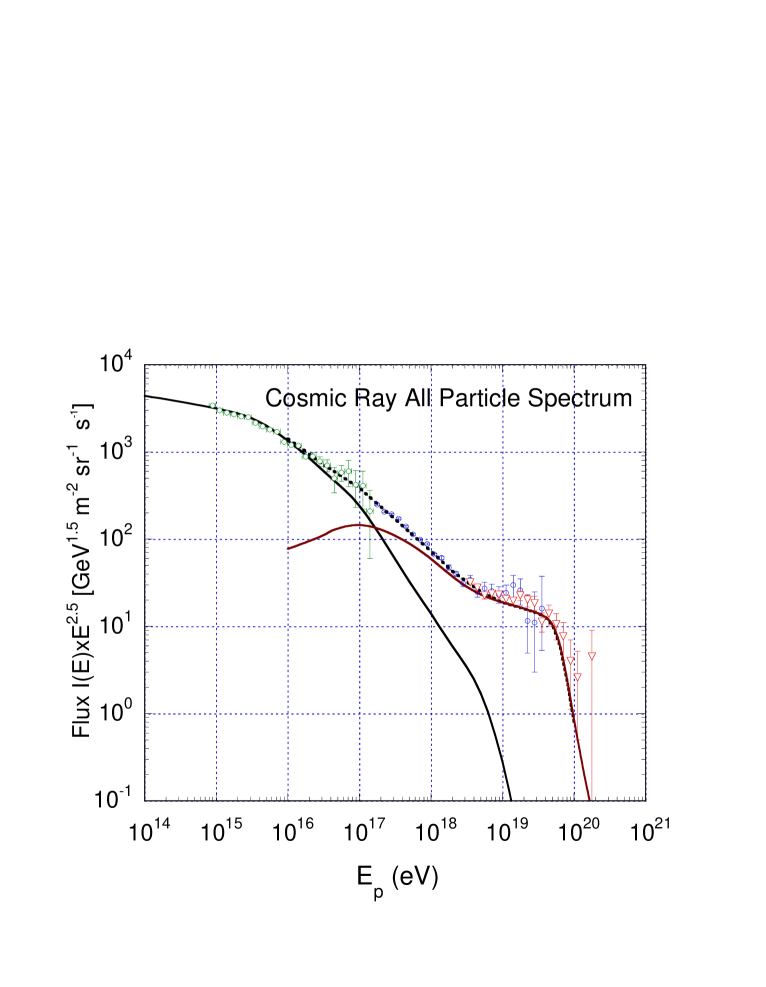
In conclusion, we have investigated the hypothesis that GRBs are the sources of HECRs. Our model provides a unified source-type to fit all the CR spectri, from some minimum CR energy produced in GRBs, which could be somewhere eV, to a maximum energy eV. The total CR flux that we calculate is a superposition of CRs originating from a past GRB in our Galaxy in whose HECR halo we inhabit (with a gradual transition at lower energies to CRs contributed from ordinary SN events with sub-relativistic blast waves), and eV CRs and UHECRs orginating in extragalactic GRBs and GRBs at cosmological distances. The HECR all-particle spectrum and our model fit to this data are shown in Fig. 13.
A GRB model for HECR production requires that GRB blast waves are hadronically dominated by nearly 2 orders of magnitude. This could be related to the injection process in relativistic shocks and the large proton/electron mass ratio. This has important consequences for 100 MeV – GeV – TeV -ray emission and high-energy ( TeV) neutrino detection. Allowed hadronic production in GRB blast waves will make rays of comparable fluence as the neutrino fluence. Insisting that the high-energy radiation fluence from a photomeson cascade can only reach the level of the X/ emission measured with BATSE (unless it is missed by detectors operating at larger energies), we have shown that neutrino could be detected coincident with a GRB at the fluence level ergs cm-1 by IceCube.
If GLAST shows that GRBs are much more fluent at MeV energies than at X/ energies, then in these GRBs one could expect a few high-energy neutrinos. Detection of even 1 or 2 neutrinos from GRBs with IceCube or a northern hemisphere neutrino telescope would unambiguously demonstrate the high nonthermal baryon load in GRBs. High-energy neutrino detection, especially from GRBs with bright 100 MeV – GeV emission components, or from GRBs with small Lorentz factors or large baryon-loading such as the X-ray bright GRBs, would provide compelling support for this scenario for the origin of the cosmic rays.
We thank the referee for a helpful report. The work of S.D.W. was performed while he held a National Research Council Research Associateship Award at the Naval Research Laboratory (Washington, D.C). The work of C.D.D. is supported by the Office of Naval Research and NASA GLAST science investigation grant DPR # S-15634-Y. A.A. acknowledges support and hospitality during visits to the High Energy Space Environment Branch of the Naval Research Laboratory.
Appendix A UHECR Attenuation and Flux Calculation
The Larmor radius of a UHE proton is kpc for a proton of energy eV propagating through a magnetic field of strength . We approximate the UHECRs as propagating rectilinearly where their spectrum is modified by energy losses. Here we describe the three attenuation processes included in our propagation code: 1) red-shifting of the proton momentum, 2) pion production from proton-CMBR scattering (), and 3) electron-pair production from proton scattering on the CMBR ().
The expansion of the universe causes a red-shifting of the proton momentum
| (18) |
where for a CDM cosmology,
| (19) |
Energy loss from proton scattering on CMBR is given by
| (20) |
bg88 , where is the black-body photon distribution of the CMBR with red-shift dependent temperature , is the cross-section for the process, and is the inelasticity. The mean-free-path between scatterings is found from eq. (20) by setting for all
We approximate photo-pion production following Ref. ad03 , modified to include three step cross-section and inelasticity functions
| (21) |
and
| (22) |
With increasing , the three regions correspond to 1) direct pion production at threshold, 2) the enhanced cross-section at the -resonance, and 3) multi-pion production in the diffractive scattering regime where photon coupling to the vector mesons and dominate. In comparison with the attenuation calculations of Mücke et al. Muecke and Stanev et al. sta00 , we agree to 2 (4)% at eV.
Our treatment of the photo-pair production losses follows that of Chodorowski et al. Chod . The greatest photopair energy-loss rate is found at eV when , and pair-production dominates other energy losses over the range
Our UHECR flux calculation follows the formalism of Berezinsky and Grigor’eva bg88 for diffuse sources. The flux from a volume element observed at Earth is
| (23) |
where is the comoving source density described in eq. (17) and Fig. 6, is the number of CRs produced per unit energy per unit time for an injection spectrum with power-law index and exponential cutoff energy the Hubble length Mpc, and is the proton energy at generation which is subsequently measured with an energy . We use and to obtain
| (24) |
where the term transforms the energy interval from propagation losses and we take . Results of calculating eq. (24) for several different spectra and evolution models are found in Figs. 7, 8, 9, and 10.
References
- (1) M. Vietri, Astrophys. J. 453 (1995) 883.
- (2) E. Waxman, Phys. Rev. Letters 75 (1995) 386.
- (3) M. Milgrom, V. Usov, Astropart. Phys. 4 (1996) 365.
- (4) C. D. Dermer, Astrophys. J. 574 (2002) 65.
- (5) H. Ulrich et al., in: 27th International Cosmic Ray Conference (Copernicus Gesellschaft: Hamburg, Germany) 1 (2001) 97.
- (6) M. Bertaina et al., in: 27th International Cosmic Ray Conference (Copernicus Gesellschaft, Hamburg, Germany) 2 (2001) 792.
- (7) K.-H. Kampert et al., in: 27th International Cosmic Ray Conference (Copernicus Gesellschaft, Hamburg, Germany) Invited, Rapporteur, and Highlight Papers (2001) 240.
- (8) T. Abu-Zayyad et al. (2003) (astro-ph/0208243).
- (9) J. Bednarz, M. Ostrowski, 1998, Phys. Rev. Letters 80 (1998) 3911.
- (10) J. G. Kirk, A. W. Guthmann, Y. A. Gallant, A. Achterberg, Astrophys. J. 542 (2000) 235.
- (11) Ginzburg, V. L., and Syrovatskii, S. I., The Origin of Cosmic Rays (New York, MacMillan, 1964).
- (12) Hayakawa, S., Cosmic Ray Physics (New York, Wiley, 1969).
- (13) M. Nagano, A. A. Watson, Rev. Mod. Phys. 72 (2000) 689.
- (14) P. Mészáros, Ann. Rev. Astron. Astrophys. 40 (2002) 137.
- (15) E. Waxman, J. Bahcall, Phys. Rev. D 59 (1999) 23002.
- (16) M. Böttcher, C. D. Dermer, Astrophys. J. 529 (2000) 635, (e) 536 (2000) 513.
- (17) M. Böttcher, C. D. Dermer, Astrophys. J. 499 (1998) L13.
- (18) B. Zhang, and P. Mészáros Astrophys. J. 559 (2001) 110.
- (19) C. D. Dermer, A. Atoyan, Phys. Rev. Letters 91 (2003) 071102.
- (20) M. Takeda et al., Phys. Rev. Letters 81 (1998) 1163.
- (21) C. D. Dermer, M. Humi, Astrophys. J. 536 (1999) 479.
- (22) E.V. Derishev, F.A. Aharonian, V.V. Kocharovsky, Vl. V. Kocharovsky, Phys. Rev. D 68 (2003) 043003.
- (23) J. N. Bahcall, E. Waxman, Phys. Lett. B 556 (2003) 1.
- (24) D. De Marco, P. Blasi, A. V. Olinto, Astropar. Phys. 20 (2003) 53.
- (25) P. Sommers, in: 27th International Cosmic Ray Conference (Copernicus Gesellschaft, Hamburg, Germany) Invited, Rapporteur, and Highlight Papers (2001) 170.
- (26) C. D. Dermer, in: 27th International Cosmic Ray Conference (Copernicus Gesellschaft, Hamburg, Germany) Invited, Rapporteur, and Highlight Papers (2001) 72.
- (27) T. Stanev, R. Engel, A. Mücke, R. J. Protheroe, J. P. Rachen, Phys. Rev. D 62 (2000) 93005.
- (28) P. Madau, L. Pozzetti, and M. Dickinson, Astrophys. J. 498 (1998) 106.
- (29) C. D. Dermer, J. Chiang, M. Böttcher, Astrophys. J. 513 (1999) 656.
- (30) J. Heise, J. in’t Zand, R. M. Kippen, and P. M. Woods, Gamma-ray Bursts in the Afterglow Era, ed. by E. Costa, F. Frontera, and J. Hjorth (Berlin, Springer, 2001) 16.
- (31) M. Vietri, D. De Marco, D. Guetta, Astrophys. J. 592 (2003) 378.
- (32) D. A. Frail et al. Astrophys. J. 562 (2001) L55.
- (33) R. A. M. J. Wijers, J. S. Bloom, J. S. Bagla, P. Natarajan, Monthly Not. Roy. Astron. Soc. 294 (1998) L13.
- (34) D. L. Band, Astrophys. J. 578 (2002) 806.
- (35) P. L. Biermann, P. A. Strittmatter, Astrophys. J. 322 (1987) 643.
- (36) C. D. Dermer, J. A. Miller, H. Li, Astrophys. J. 456 (1996) 106.
- (37) S. Colafrancesco, P. Blasi, Astropar. Phys. 9 (1998) 227.
- (38) P. Blasi, Astrophys. J. 532 (2000) L9.
- (39) R. Schlickeiser, Cosmic Ray Astrophysics (Springer-Verlag, Berlin, 2002), chpts. 14 and 17.
- (40) Drury, L. O’C., Repts. Theor. Phys. 46 (1983) 973.
- (41) R. Z. Sagdeev, A. A. Galeev, Nonlinear Plasma Theory (New York, Benjamin, 1969).
- (42) A. M. Atoyan, F. A. Aharonian, H. J. Völk, Phys. Rev. D 52 (1995) 3265.
- (43) E. Anders, N. Grevesse, Geochimica et Cosmochimica Acta 53 (1989) 197.
- (44) M. Roth et al., in: 28th International Cosmic Ray Conference, Tokyo, Japan.
- (45) S. P. Swordy, 24th Int. Cosmic-Ray Conf. (Rome), 2 (1995) 697.
- (46) S. P. Swordy, J. L’Heureux, P. Meyer, and D. Müller, Astrophys. J. 403 (1993) 658.
- (47) V. L. Ginzburg, V. S. Ptuskin, Rev. Mod. Phys. 48 (1976) 161.
- (48) A. A. Watson, Adv. Space Res. 4 (1984) 35.
- (49) A. M. Hillas, Ann. Rev. Astron. Astrophys. 22 (1984) 425.
- (50) C. D. Dermer, in: High Energy Gamma-Ray Astronomy, F. Aharonian and H. Völk, eds. (AIP, New York, 2001) p. 202.
- (51) A. W. Blain et al., Mon. Not. R. Astron. Soc. 309 (1999) 715.
- (52) C. Gronwall, in T. X. Thuan et al., eds., Dwarf Galaxies and Cosmology, Proc. XVIII Moriond Meeting (astro-ph/9806240).
- (53) M. A. Treyer et al., Mon. Not. R. Astron. Soc. 300 (1998) 303.
- (54) L. Tresse and S. J. Maddox, Astrophys. J. 459 (1998) 691.
- (55) S. J. Lilly, O. LeFevre, F. Hammer, and D. Crampton, Astrophys. J. 460 (1996) L1.
- (56) A. J. Connolly et al., Astrophys. J. 486 (1997) L11.
- (57) P. Madau et al., Mon. Not. R. Astron. Soc. 283 (1996) 1388.
- (58) M. Pettini et al., Astrophys. J. 508 (1998) 539.
- (59) S. T. Scully and F. W. Stecker, Astropart. Phys. 16 (2002) 271.
- (60) V. S. Berezinskii, A. Z. Gazizov, and S. I. Grigorieva, (hep-ph/0204357).
- (61) C. L. Bennett, et al. 2003, Astrophys. J. S. 148, 1.
- (62) J. N. Tonry et al., Astrophys. J. 594 (2003) 1.
- (63) D. J. Bird et al., Phys. Rev. Lett. 71 (1993) 3401.
- (64) M. Drees, PASCOS 03 (hep-ph/0304030).
- (65) L. Anchordoqui et al., Int. J. Mod. Phys. A18 (2003) 2229.
- (66) T. J. Weiler, Astropart. Phys. 11 (1999) 303.
- (67) T. W. Kephart and T. J. Weiler, Astropart. Phys. 4 (1996) 271.
- (68) S. D. Wick, T. W. Kephart, T. J. Weiler, and P. L. Biermann, Astropart. Phys. 18 (2003) 663.
- (69) T. K. Gaisser, F. Halzen, and T. Stanev, Phys. Repts. 258(3) (1995) 173.
- (70) B. D. Dingus, J. R. Catelli, and E. J. Schneid, Fourth Huntsville Symposium on Gamma Ray Bursts, eds. C. A. Meegan, R. D. Preece, and T. M. Koshut (New York: AIP), 349.
- (71) R. Atkins, et al., Astrophys. J. 583 (2003) 824.
- (72) K. Hurley, et al., Nature 372 (1994) 652.
- (73) M. M. González, B. L. Dingus, Y. Kaneko, R. D. Preece, C. D. Dermer, and M. S. Briggs, Nature 424 (2003) 749.
- (74) Königl, A. & Granot, J. 2002, Astrophys. J., 574, 134
- (75) A. D. Erlykin and A. W. Wolfendale, Adv. Space Res. 27 (2002) 803.
- (76) J. Cho, A. Lazarian, and E. T. Vishniac, Astrophys. J. 566 (2002) L49.
- (77) J. A. Simpson, Ann. Rev. Astron. Astrophys. 33 (1983) 323.
- (78) L. G. Sveshnikova, Astron. Astrophys. 409 (2003) 799.
- (79) J. G. Kirk, Saas-Fee Advanced Course 24: Plasma Astrophysics (1994) 225.
- (80) V. S. Berezinskii, S. I. Grigor’eva, Astron. Astrophys. 199 (1988) 1; (e) 210 (1989) 462.
- (81) A. M. Atoyan and C. D. Dermer, Astrophys. J. 586 (2003) 79.
- (82) A. Mucke, J. P. Rachen, R. Engel, R. J. Protheroe, and T. Stanev, Pub. Astr. Soc. Australia 16 (1999) 160.
- (83) M. J. Chodorowski, A. A. Zdziarski, and M. Sikora, Astrophys. J. 400 (1992) 181.