Breaking All the Rules:
The Compact Symmetric Object 0402+379
Abstract
We present results of multi-frequency VLBA observations of the compact symmetric object (CSO) 0402+379. The parsec-scale morphology of 0402+379 allows us to confirm it as a CSO, while VLA data clearly show the presence of kiloparsec-scale structure. Thus, 0402+379 is only the second known CSO to possess large scale structure. Another puzzling morphological characteristic found from our observations is the presence of two central, compact, flat-spectrum components, which we identify as possible active nuclei. We also present the discovery of neutral hydrogen absorption along the southern hotspot of 0402+379 with a central velocity 1000 km s-1 greater than the systemic velocity. Multi-epoch observations from the VLA archive, the Caltech-Jodrell Bank Survey, and the VLBA Calibrator Survey allow us to further analyze these anomalous features. Results of this analysis reveal significant motion in the northern hotspot, as well as appreciable variability in both of the core candidates. We consider the possibility that 0402+379 was formed during a recent merger. In this case, the two candidate cores could be interpreted as binary supermassive black holes that have not yet coalesced, whereas the large-scale radio emission could be attributed to interactions directly linked to the merger or to previous activity associated with one of the cores.
1 Introduction
Compact symmetric objects (CSOs) are a recently identified class of radio sources smaller than 1 kpc in size with emission on both sides of the central engine, and are thought to be very young objects (1000 yr, Readhead et al. 1996; Owsianik & Conway 1998). The small linear sizes of CSOs make them valuable for studies of both the evolution of radio galaxies and for testing the “unified scheme” of active galactic nuclei (AGN). CSOs are also extremely valuable as calibrators since they are relatively flux stable, unpolarized, and rarely exhibit any extended emission on kiloparsec scales. For all of these reasons, many recent observational campaigns have been aimed at identifying and better understanding these objects (e.g. Peck & Taylor 2000; Augusto et al. 1998). However, despite the increased interest, many properties of CSOs remain poorly understood. In particular, the origin of these objects’ unique and varied morphologies remains a topic of open debate. One object known to have an especially puzzling morphology is the relatively nearby (z=0.055 - Xu et al. 1994) CSO 0402+379.
The radio galaxy 0402+379 was first observed with the Very Long Baseline Array (VLBA) and the Very Large Array (VLA)111The National Radio Astronomy Observatory is operated by Associated Universities, Inc., under cooperative agreement with the National Science Foundation. as part of the first Caltech-Jodrell Bank Survey (CJ1), but owing to its moderately large extent (50 mas) and absence of a strong compact component, the high resolution image obtained at 5 GHz was quite poor (Xu et al., 1995), and it was not recognized as a CSO. Complimentary VLA observations obtained during this survey showed 0402+379 to possess large scale structure, but this result was not surprising since the CSO morphology was not known. The source was again observed five years later during the VLBA Calibrator Survey (VCS; Beasley et al. 2002), but it earned no special attention. In an analysis of the polarization properties of core jet sources, Pollack et al. (2003) classified 0402+379 as a CSO candidate and suggested further investigation. Reexamination of the VCS images revealed a central core with extended lobes on either side, consistent with the CSO interpretation. However, these images also showed the central core to be offset from a line connecting the two hotspots, which had not been seen in any other previously identified CSO.
In order to directly address the CSO-like morphology of 0402+379, we obtained multi-frequency VLBA observations at 1.3, 5, and 15 GHz. Our observations allow us to classify this object as a CSO. We emphasize, though, that 0402+379 exhibits several peculiar properties that are not typical of CSOs. In particular, the presence of large scale structure in this object is inconsistent with a recent onset of radio activity and has only been seen in one other CSO (0108+388; Baum et al., 1990). Moreover, the parsec-scale structure of 0402+379 is unique in that it possesses two central, compact, flat-spectrum components. Because jet components are not often found to show these features, this result is quite puzzling.
To explore these anomalous features in more detail, we have re-analyzed multi-epoch data for 0402+379 from the Caltech-Jodrell Bank Survey (Britzen et al. 2003, in prep.) and the VLBA Calibrator Survey (Beasley et al., 2002). Our analysis confirms the flat spectrum nature of this source’s two potential nuclei, and reveals appreciable variability in both of these components. We also find significant motion in the northern hotspot of 0402+379 and possible motion in one of the core candidates. In §4, we explore possibilities that could account for the two central, compact, flat spectrum components, as well as the large scale structure and highly redshifted HI discovered in 0402+379. Throughout this discussion, we assume H0=71 km s-1 Mpc-1, = 0.27, and = 0.73, resulting in a linear to angular scale ratio of 1.055 kpc arcsecond-1 222Derived using E.L. Wright’s cosmology calculator at http://www.astro.ucla.edu/ wright/CosmoCalc.html..
2 Observations
2.1 2003 VLBA Observations
VLBA observations were made on 2003 March 02 at 1.348, 4.983, and 15.353 GHz in a single 11 hr observing session. A single IF with a bandwidth of 16 MHz was observed in 256 channels in both R and L circular polarizations, resulting in a frequency resolution of 62.5 kHz, corresponding to a velocity resolution of 15 km s-1. Four-level quantization was employed at all three frequencies. The net integration time on 0402+379 was 651 minutes at 1.3 GHz, 478 minutes at 5 GHz, and 478 minutes at 15 GHz. Standard flagging, amplitude calibration, fringe fitting, bandpass calibration (using 3C 84 for continuum data and 3C 111 for spectral line data), and frequency averaging procedures were followed in the Astronomical Image Processing System (AIPS; van Moorsel et al. 1996). AIPS reduction scripts described in Ulvestad et al. (2001) were used for a large part of the reduction. Spectral line Doppler corrections were also applied in AIPS, and a clean cube was produced using Difmap (Shepherd et al., 1995). All manual editing, imaging, deconvolution, and self-calibration were also done with Difmap.
2.2 Archival Observations
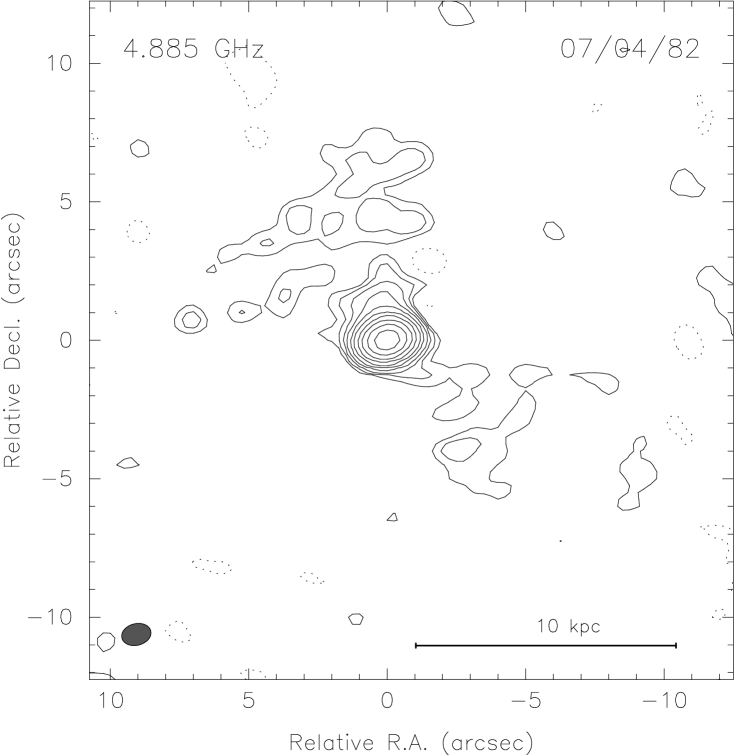
We have additionally obtained VLA archival data from 1992 November 06 and from 1982 July 04 at 1.46 and 4.89 GHz, respectively. The 1.46 GHz observation was first presented by Xu et al. (1995) and was taken in the A configuration, whereas the 4.89 GHz observation was taken in the BnA configuration and has not been previously published to our knowledge. Both frequencies were observed during snapshot observations, and both were made using a 50 MHz bandwidth. Further information regarding these observations can be found in Table 1. Standard flagging for these observations as well as amplitude and phase calibration was performed in AIPS, while manual editing, imaging, deconvolution, and self-calibration were done in Difmap.
To further study this source, we obtained fully-calibrated VLBI data taken in 1990 (Xu et al., 1995), in 1996 (VCS; Beasley et al. 2002), and in three epochs (1994, 1996, and 1999) of the CJ Proper Motion Survey (Britzen et al. 2003, in prep.). These data were imaged and modeled in Difmap to aid in analysis of motions, variability, and spectra of 0402+379. Further information regarding these observations can be found in Table 1.
3 Results
3.1 Radio Continuum
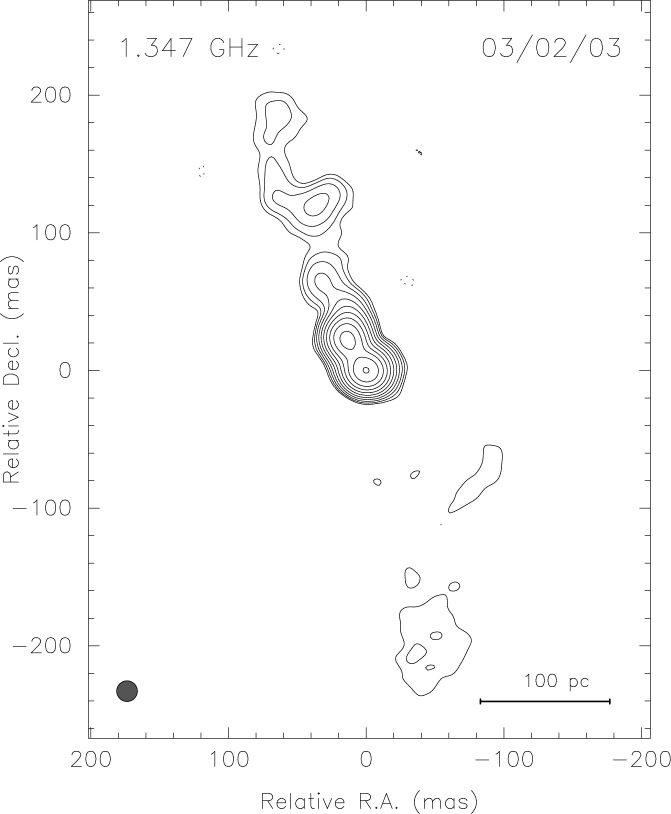
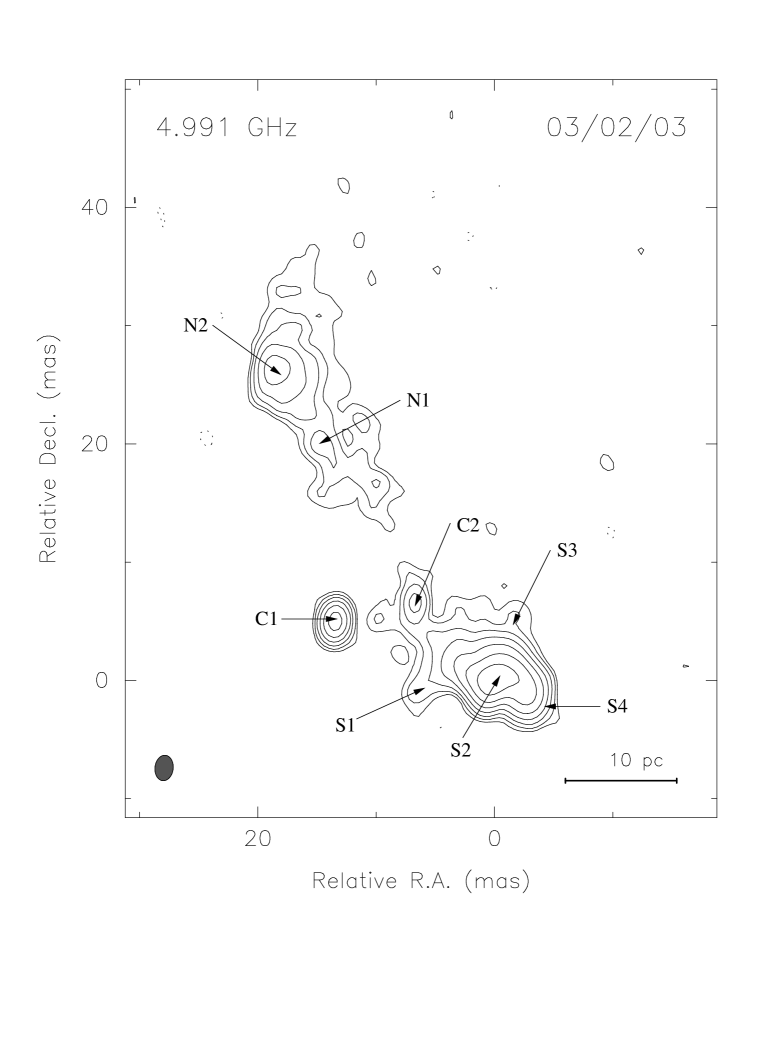
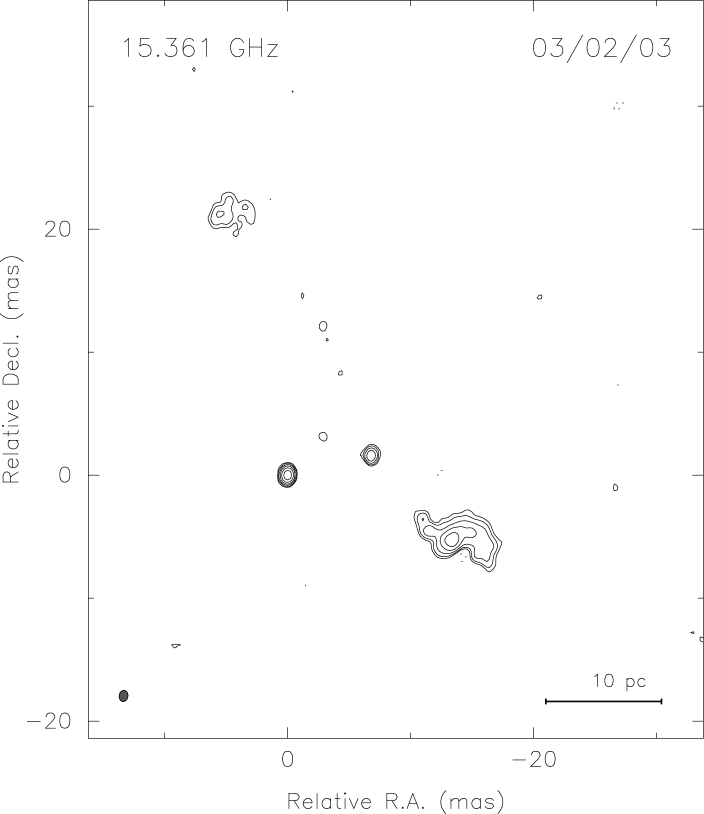
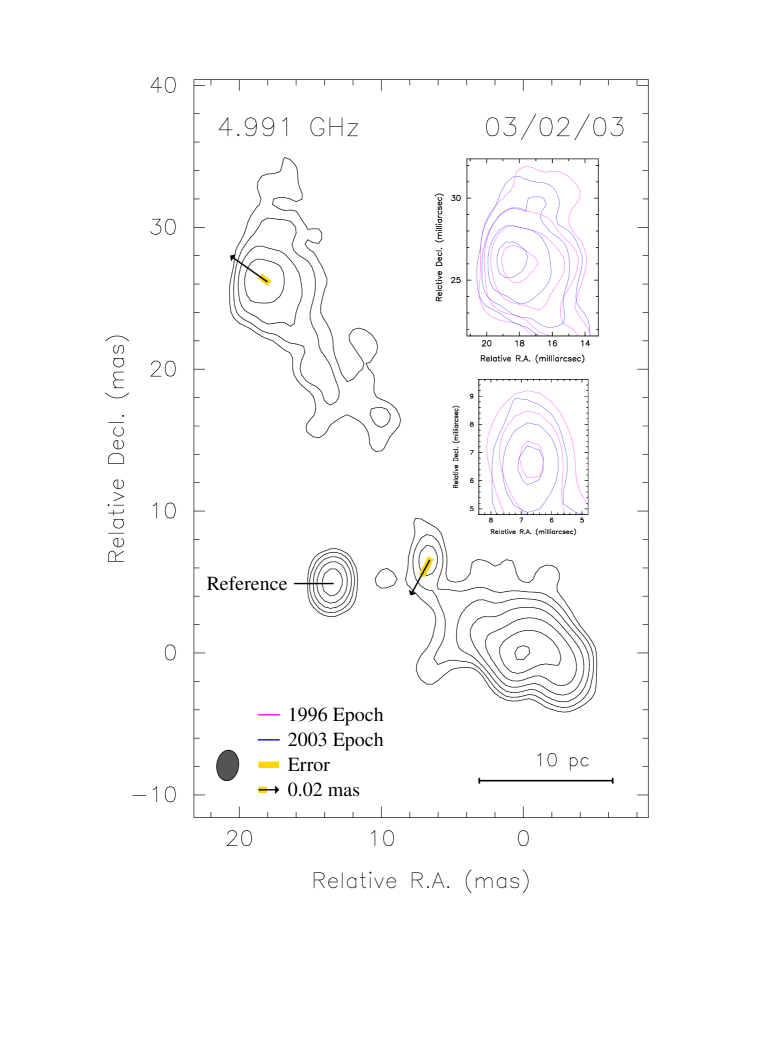
Figure 1 shows naturally weighted 1.3, 5, and 15 GHz images from the 2003 VLBA observations. The overall structure of the source is similar at 5 and 15 GHz, spanning 40 mas (40 pc) and consisting of two diametrically-opposed jets, as well as two strong, compact core candidates, one directly between the jets and one also between the jets but offset from the center. At 1.3 GHz, the radio morphology is somewhat different, showing significant extended structure to the north, as well as weak extended structure in the south. We note that the complex morphology of the southern hotspot is suggestive of substantial interaction between the surrounding galactic medium and the southern hotspot.
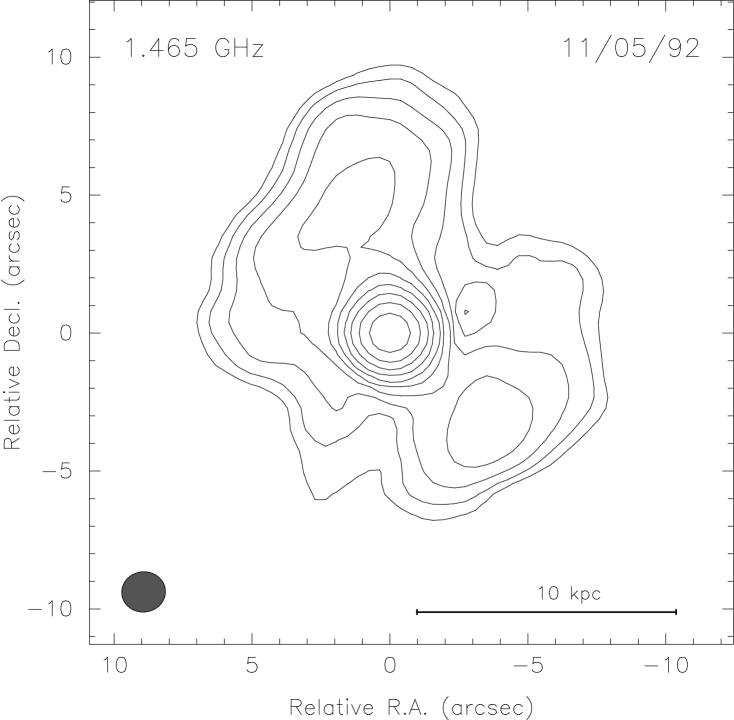
Results from our VLA observations at 1.4 and 5 GHz are shown in Figure 2. The 1.3 GHz map, initially analyzed by Xu et al. (1995), was the first indication of large scale structure in 0402+379. However, because the CSO morphology of this source was not known at the time, this result was not remarkable. Our VLBA observations, on the other hand, unambiguously reveal the parsec-scale CSO morphology of this source, thereby allowing us to report 0402+379 as only the second known CSO (after 0108+388) to possess structure on a kiloparsec-scale.
Because the detection of large scale structure associated with CSOs is inconsistent with a recent origin for their radio activity, Baum et al. (1990), who discovered and first analyzed the large scale structure in 0108+388, have explored possibilities that could account for extended emission in CSOs. One possibility they consider is that the source is a normal radio galaxy in a dense environment, where the radio plasma cannot currently escape from the nuclear regions. A second possibility they give is that the emission in such a source is recurrent and that the extended radio emission is a relic of activity from a previous period. We will return to these possibilities in §4.
3.2 Component Motions and Variability
In order to explore questions pertaining to motion and variability in 0402+379, we obtained fully-calibrated 5 GHz data from the Caltech-Jodrell Bank Proper Motion Survey (Britzen et al. 2003, in prep.). The three epochs included in this set correspond to VLBA observations taken in 1994, 1996, and 1999. Combining this data with our 2003 VLBA observations and the 1990 VLBI observations of Xu et al. (1995), we were able to probe motion and variability in this source over a thirteen year period. Although the first hot spot velocities in CSOs required time baselines of 15 years (Owsianik & Conway, 1998), we note that time baselines as short as 5 years have also been successfully used to probe motions in CSOs (Giroletti et al., 2003). Therefore, we believe that our time baseline of 13 years should be sufficient to detect component motions in 0402+379, should the motion be similar to that in other CSOs.
Motion and variability studies were performed by fitting 8 elliptical Gaussian components in Difmap to the 1996 visibility data. The 1996 epoch was chosen for the preliminary fit since data from this epoch showed a similar morphology to the other epochs but appeared to be somewhat less complicated in the southern hotspot, making it easier to fit with a small number of components. In this model, a large elliptical component was used to pick up the northern jet’s diffuse emission; compact components were used to describe the two core components, the southern hotspot, and the hotspot in the northern jet. We used our 1996 model to fit the 5 GHz data corresponding to the 1990, 1994, 1999, and 2003 epochs. During this process, we let only position and flux density vary; all other fitting parameters were held fixed at the 1996 values. Results from our fits are listed in Table 2, and regions describing each Gaussian component are labeled in Figure 1.
To study component variability in 0402+379, we compared the flux for components C1, C2, the sum of the southern components (S1, S2, S3, and S4), and the sum of the northern components (N1 and N2) over each of our five VLBI epochs. The above regions were chosen based primarily on their isolation relative to other components in the source. Errors for each region were then computed based on the rms noise and our estimated absolute flux calibration errors ( 20% for the 1990 and 1994 Mk 2 epochs and 5% for the 1996, 1999, and 2003 VLBA epochs). The resulting fractional variation lightcurves are shown in Figure 3. These lightcurves were created by dividing each region’s flux at each frequency by the the mean region flux found from averaging all observed frequencies. To aid in readability of our graph, the offset core component (C2), the southern lobe, and the northern lobe are displaced on the y-axis by 1, 2, and 3 units, respectively. From Figure 3 and Table 2, we find that component C1 (the offset core candidate) substantially increases in flux over our thirteen-year baseline, starting from 18 mJy in 1990 and increasing in brightness to 60 mJy in 2003. If C1 is the core, we find a relatively high 5 GHz core fraction of 7%, compared with the typical CSO 5 GHz core fraction of 3% (Taylor et al., 1996). We also find that component C2 is variable, ranging from 10 mJy in 1990 to 25 mJy in 1996. Because our 1990 epoch was observed with Mk 2 VLBI, this apparent variability could, in part, be attributed to poor data quality. We see, however, that the measured flux for all other components in 1990 is quite consistent with our later epochs, suggesting that our calculated upper-limit for component C2’s flux in 1990 is reliable and that the observed variability in C2 is significant. However, this result is strongly dependent on our 1990 epoch, and further observations are needed to confirm the variable nature of C2.
Core components in CSOs are known to be variable at 23% on timescales of several months (Fassnacht & Taylor, 2001), significantly less than both C1 and C2 have proven to be on a timescale of thirteen years. Our time sampling is not dense enough to determine the variability over a period of months in these components, but since the trend is gradual (with the exception of the change in C2 between 1990 and 1994), our results seem consistent with Fassnacht & Taylor (2001). We therefore believe that the variability we detect in component C1 and C2 is reasonable for core components in CSOs. We will further discuss the implications of these results in §4.
To calculate the advance velocity for our Gaussian components, we chose component C1 as our reference component, based on its isolation relative to other components in the source, and compared the model-fit for each epoch by fitting a line to each component’s position as a function of time and then fitting a second line to each component’s velocity as a function of time. Results of this fitting process are listed in Table 3, plotted in Figure 4, and shown schematically in Figure 5. Position errors at individual epochs were estimated based on the scatter exhibited in component fits where no motion is detected. Using our least squares fits shown in Table 3, our results indicate a (0.0398 0.010 mas yr-1 or 0.137 0.034 c) detection of motion in the northern hotspot (N2) as well a (0.0468 0.019 mas yr-1 or 0.16 0.065 c) detection in the aligned core candidate (C2). Although it is somewhat surprising that no motion is detected in the southern hotspot (S2), we emphasize that the southern hotspot is substantially more complicated than the northern hotspot (N2) and core candidates (C1 and C2). Therefore, it may be that component S2 is moving as fast as our other components with detected motion (N2 and C2) but that our modelfitting-based technique does not allow detection of this motion.
Using our velocity result for component N2 given in Table 3 and our position result for this component given in Table 2, we derive an approximate age for component N2 of 502 129 years. Assuming we have detected the majority of parsec-scale emission in this source, this component age is consistent with that of other expected component ages for CSOs (e.g., Readhead et al. 1996; Owsianik & Conway 1998).
Finally, we emphasize that our detection of motion for component C2 is extremely tentative, since it is only a result. Moreover, due primarily to the non-detection of component C2 in 1990 as well as the poor quality of data in 1994, the goodness-of-fit for component C2 is much worse than that for component N2. We also note that had we chosen component C2 as stationary, our motion results would indicate that component N2 is moving somewhat more northwardly than it is currently moving and at roughly twice its current speed, whereas component C1 would be moving toward the northern hotspot at the speed currently attributed to component C2. We will see in §4, however, that the component we choose as a reference is not crucial to our interpretation, since the only important results are that component N2 is moving northward and that components C1 and C2 are possibly moving relative to each other.
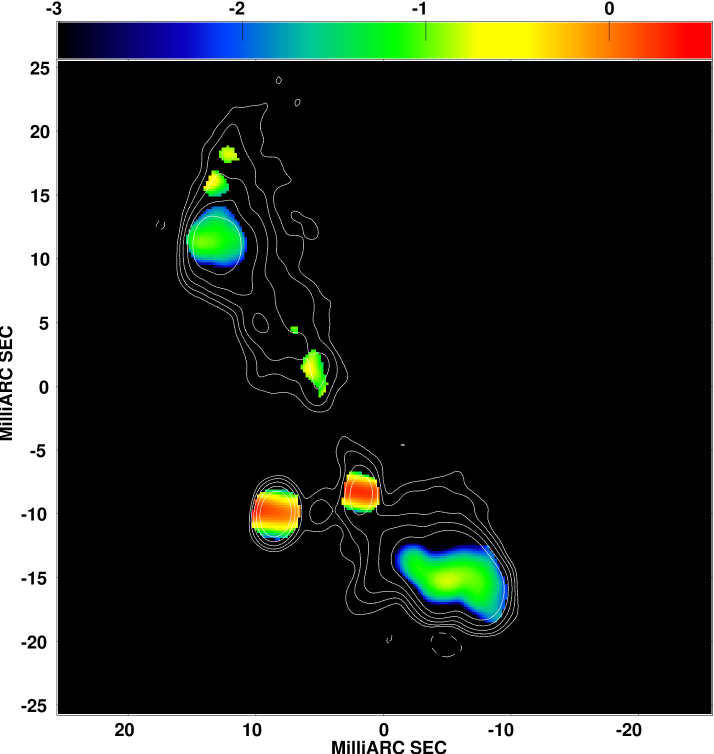
3.3 Radio Continuum Spectra
By appropriately tapering our 15 GHz 2003 image, we obtained an image resolution matched to our 5 GHz continuum image. These two images were then combined to generate an image of the spectral index distribution across the source (Figure 6). In both hotspots of the source, a steep spectrum is found, whereas in both core candidates, the spectrum is quite flat. Because only core components in CSOs are generally found to be flat spectrum (Taylor et al., 1996), we were somewhat surprised by this result.
To further explore this puzzling feature, we measured the peak flux of each component using images generated from calibrated data obtained in the VLBA Calibrator Survey (2 and 8 GHz; 1996 epoch), as well as from our 2003 epoch at 1.3, 5, and 15 GHz. These flux densities are listed in Table 4. Continuum spectra generated from these flux densities are shown in Figure 7. We emphasize that because components C1 and C2 are variable (§3.2), our points at 2 and 8 GHz for these components are highly uncertain. However, the hotspots in 0402+379 (components N2 and S2) do not appear to be variable, and we therefore believe that the measured peak fluxes for these components at 2 and 8 GHz provide a good estimate of the flux we would have found at these frequencies had we obtained 2003 observations. We see that our results are consistent with this supposition since our spectra for components S2 and N2 appear to vary continuously and because our results obtained for these components are similar to those obtained from our spectral index map. Using results from our continuum spectrum, we find spectral indices between 5 and 15 GHz for the northern hotspot (N2), the southern hotspot (S2), the offset core candidate (C1), and the aligned core candidate (C2) of 1.38, 1.60, 0.20, and 0.35, respectively.
3.4 HI Absorption
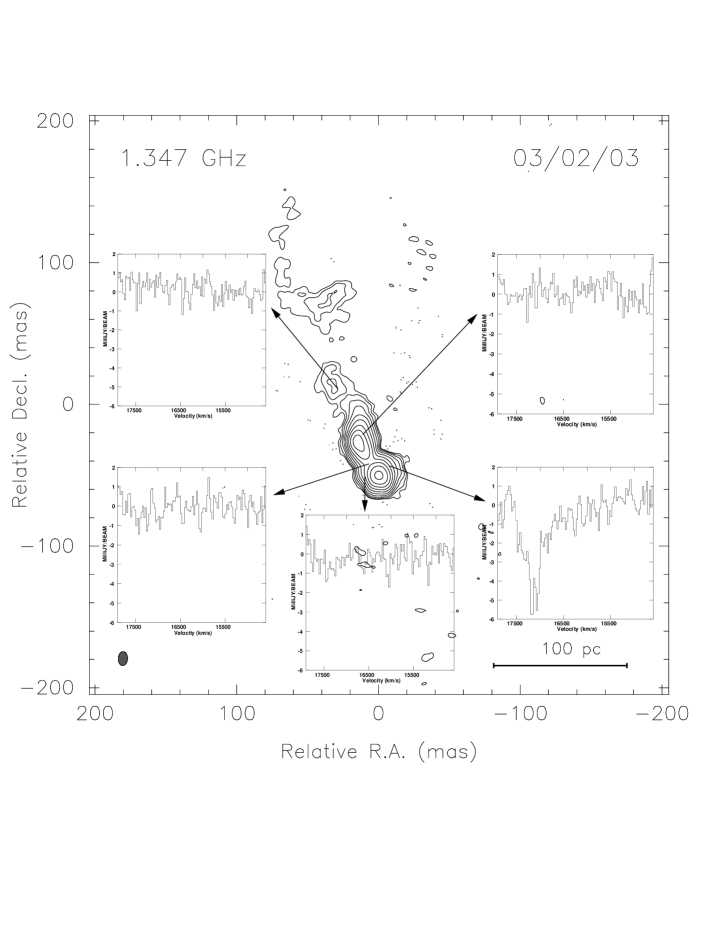
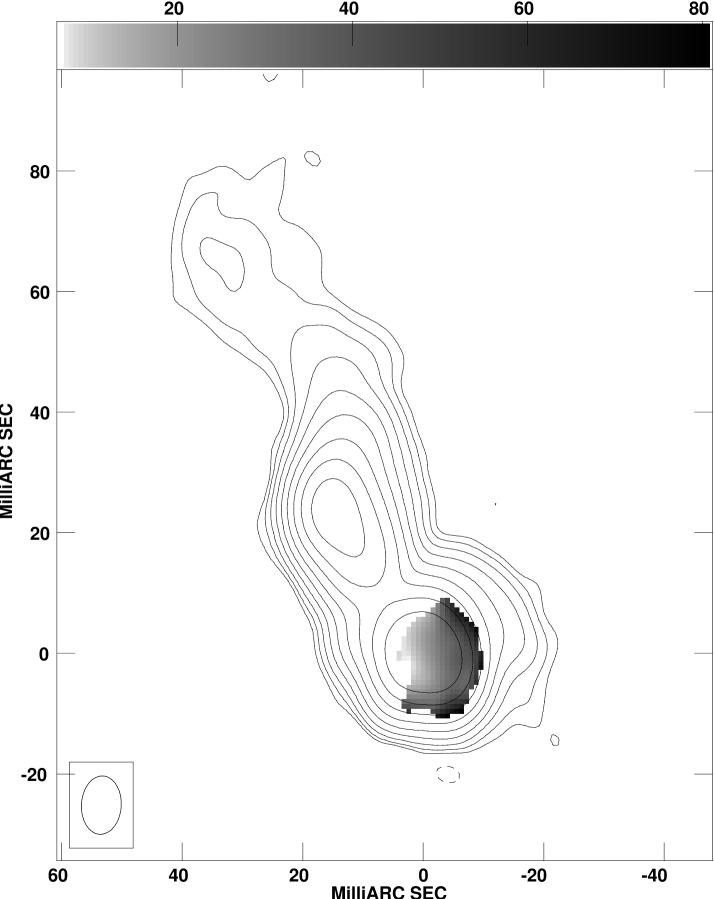
Spectral line observations at 1.348 GHz were also made during the 2003 VLBA observations. Figure 8 shows the 1.3 GHz continuum emission from this observation overlaid by spectra from five regions of the source, while Figure 9 shows a gradient in HI opacity over the source. A broad (540 km s-1) line is discovered along the eastern edge of the southern hotspot. Measurements for this line are given in Table 5. We note that no velocity gradient was found across the HI absorbing region.
We determine the central velocity of the HI absorption to be 17,115 23 km s-1, corresponding to a redshift of 0.0571 0.0001. From the reported redshift for 0402+379, as measured from optical emission lines (Xu et al., 1994), we find that our observed line is redshifted by 1012 300 km s-1 from the systemic velocity of the source. Most of this error comes from the uncertainty in redshift given by Xu et al. (1994). Although lines redshifted greater than 500 km s-1 are not typical in CSOs, they are not unprecedented. Vermeulen et al. (2003), for example, recently surveyed 57 low-redshift CSS/GPS sources and found that the majority of their detected lines were redshifted and were observed at displaced velocities ranging from several hundred km s-1 to sometimes greater than 1000 km s-1. Vermeulen et al. (2003) speculate that in many of their sources, interaction between the radio jets and the surrounding galactic medium in the central kpc lead to significant motions in the HI absorbing gas and, thus, result in absorption lines that are greatly displaced from the systemic velocity. This hypothesis was also used to explain the highly blueshifted line found in IC 5063 (Oosterloo et al., 2000). Because the morphology of 0402+379 in the HI absorbing region of the southern hotspot is highly suggestive of substantial interaction between the radio jets and the galactic medium (as previously discussed in §3.1), a similar explanation could be used to explain our substantially redshifted line. We note that while this hypothesis may appear to be in conflict with our nondetection of motion in the southern hotspot (§3.2), as we have already discussed, component S2 is too complicated for proper motions less than 0.3c to be detected. We further note that assuming this hypothesis is correct may also suggest that the southern jet is on the receding side with respect to our line-of-sight, since the absorption line is redshifted from the systemic velocity. This is consistent with the considerably weaker emission in the southern extension of the source than in the northern extension in the continuum maps at 1.3 GHz with the VLBA and at 5 GHz with the VLA. A problem with this hypothesis is how to sweep up enough neutral material in the shock driven into the cloud (Bicknell et al., 1998).
As an alternative hypothesis, it may be possible that the highly redshifted HI in 0402+379 is due to a recent merger. In this case, the observed HI redshift of 1000 km s-1 would be attributed to the velocity difference between the two merging galaxies, or to infall of gas that has been dispersed during the merger.
4 Discussion
Although the clearly symmetric morphology of the lobes in 0402+379 allows us to classify it as a CSO, 0402+379 exhibits several peculiar properties that are not typical of CSOs. In particular, 0402+379 has been shown to have large scale structure, making it only the second known CSO to possess such a feature. In addition, 0402+379 contains two central, compact, flat spectrum, variable components, a feature which has not been observed in any other compact source. While we are unable to fully explain these anomalous properties at present, in the following sections, we discuss several physical situations that could account for one or more of the observed features.
4.1 Background Source
To explain the two central compact, flat spectrum components observed in VLBI images of 0402+379, we first considered the possibility that component C1 is not actually associated with 0402+379 but is instead a foreground or background radio source. However, from our angular separation distance for the two core candidates (7 mas), we find the probability that component C1 is an unassociated background source to be 10-11(Condon, 1984). Moreover, our 5 GHz map shows a 6 detection of radio emission connecting components C1 and C2 (e.g. Figure 6). We therefore eliminate the background source theory as a likely explanation for the two central compact, flat spectrum components observed in 0402+379.
4.2 Gravitational Lensing
A second possibility that could account for the two, central compact components we observe in 0402+379 is that our source is gravitationally lensed. Starting in the late 1980’s, a number of gravitationally-lensed radio sources have been observed and documented (e.g., Soucail et al. 1987). The smallest known lens is 0218+357, with a separation of 330 mas (O’Dea et al., 1992). In response to the moderate lens separations of O’Dea et al. (1992) and others, Wilkinson et al. (2001) surveyed three hundred compact radio sources in search of lensing (with an expected lensing mass of ) and found none that were gravitationally lensed. Therefore, if 0402+379 were lensed, it would be the first in its class to be identified as such. Moreover, we note that while the morphology and spectrum of 0402+379 are highly supportive of the lensing hypothesis, we see that the lightcurves of components C1 and C2 (the two core candidates) are very different (see Figure 3). Although the lightcurves for a lensed source are not required to be identical, we would expect them to be proportional, with a short time delay. In addition, because 0402+379 is nearby (z=0.055), the lensing mass would likely be obvious if 0402+379 were lensed. Therefore, based on the known rarity of compact, lensed sources, the significant difference in the lightcurves of components C1 and C2, and the close proximity of 0402+379, we eliminate lensing as a potential mechanism to describe the observed parsec-scale morphology.
4.3 Dense Medium Theory
First analyzed by Baum et al. (1990), 0108+388 was the first CSO found to possess large scale structure. Because the presence of kpc-scale emission associated with CSOs is inconsistent with a recent origin for their radio activity, Baum et al. (1990) have presented several theories that could reconcile this apparent contradiction. One possibility they present is that 0108+388 is a CSO333Baum et al. (1990) actually referred to 0108+388 as a compact double (CD) since the classification of CSO was not in existence at the time of their work. However, 0108+388 has since been classified as a CSO (Readhead et al., 1996), so in all discussions of this source, we will refer to it as such., but that the radio emission is not a recent event. Baum et al. (1990) speculate, then, that 0108+388 could be a more evolved galaxy but that the radio plasma cannot currently escape from the nuclear regions. They propose that this situation might arise because the host galaxy has recently swallowed a gas rich companion, thereby smothering the source. Since 0402+379 is similar to 0108+388 as a CSO with large scale structure, we consider this possibility in some detail.
Because exotic jet morphologies are often attributed to substantial interaction with the external medium, the medium-interaction theory presented by Baum et al. (1990) could explain the puzzling pc-scale emission seen in 0402+379. In this case, the offset-core candidate (component C1) would be classified as the core, whereas the aligned-core candidate (component C2) would be classified as a knot in the southern jet. The southern hotspot morphology, the presence of greatly redshifted HI, and the lack of significant motion in the southern hotspot all appear to support this theory, since they all suggest substantial interaction between the ISM and the southern hotspot. Moreover, although the inverted spectrum of component C2 is difficult to explain using our “dense medium” hypothesis, the non-detection of component C2 in 1990 could suggest that substantial interactions with a dense surrounding medium have led to shocks in component C2, causing it to brighten significantly, as well as to appear compact and flat-spectrum. However, our derived HI column density of 1.8 cm-2 in the southern hotspot is inconsistent with the slow jet, dense medium model for CSOs presented by Readhead et al. (1996) by three orders of magnitude. It could be argued that this discrepency is due to our assumed spin temperature of 100 K, which was used in deriving the column density. We note, though, that while this assumed temperature may be underestimated, the column density derived assuming a spin temperature of 104 K is still too small to be consistent with the dense medium model presented by Readhead et al. (1996). If our dense medium theory is correct, then our HI opacity results require an anomalously large density gradient between component C2 and the southern hotspot. Our detection of significant motion in the northern hotspot, as well as the fact that we see no morphological evidence for substantial interaction between the northern jet and the surrounding medium also weakens our dense medium theory, since we would expect the medium to be distributed isotropically about the source. The relative motion of 0.16 c between C1 and C2 is plausible if C2 is a knot moving down a curved jet. Finally, as Baum et al. (1990) suggest, if the parsec-scale structure in our source is smothered by a dense medium, we might suppose that this density arises due to a merger between the host galaxy and a gas rich companion. If this were the case, we might expect to see some evidence for the interaction such as a disturbed optical morphology, or peculiar optical emission lines (e.g., Bartel et al. 1984). However, 0402+379 has a typical LINER spectrum (Ho et al., 1997) and does not contain any unusual features (Stickel et al., 1993). The digital sky survey images show nothing unusual in the bright elliptical host galaxy with a magnitude of 17.2 (Xu et al., 1994).
4.4 Supermassive Binary Black Holes
A final possibility that could account for several of the observed features in 0402+379 is that the two observed flat-spectrum, compact components are part of a supermassive black hole binary system formed from a recent merger. In this case, components C1 and C2 (the two core candidates) would both be interpreted as active nuclei, with the northern and southern hotspots belonging to component C2 (the aligned core candidate). The morphology and the spectrum are highly supportive of this hypothesis. In this picture, the high velocity of the HI absorption could be attributed to infalling gas from a merger.
Readhead et al. (1996) remarked on the commonality of an “S-shaped” morphology in CSOs and suggested that it could be the result of precession due to a binary black hole system in the nucleus. We note that 0108+388, the only other CSO known to have large scale structure, has S-symmetry. Because the extended strucuture we see in 0108+388 and in 0402+379 is quite anomalous in CSOs, it is reasonable to suppose that these objects are part of similar systems and were formed via similar mechanisms. Baum et al. (1990) have suggested that the large scale structure observed in 0108+388 is a relic of a previous period of activity. Given the possibility that both 0108+388 and 0402+379 harbor binary black holes in their centers, the previous period of activity may have been linked to a recent merger. We note, however, that we do not see an S-shaped morphology in the jets of 0402+379, which detracts from this argument.
Although the claim by Readhead et al. (1996) that the S-shaped morphologies in the jets of CSOs is indicative of a binary black hole system was speculative, more recent studies have provided substantial evidence that such systems do exist. For example, Sudou et al. (2003) have recently used high precision astrometry with the VLBA to observe an elliptical orbit in the core of the radio galaxy 3C 66B, providing strong evidence for a supermassive black hole companion. Moreover, it has been theorized that a small fraction of bright elliptical galaxies should harbor binary black holes at their center (Haehnelt & Kauffmann, 2002). It is not surprising that binary systems with a linear separation on the same scale at which we observe the core candidates in 0402+379 have not previously been imaged, since these objects are likely quite rare and since it is not required that either or both of the black holes be active.
We note, however, that our 2 result that component C2 is moving relative to component C1 may weaken our binary black hole hypothesis. Assuming typical supermassive black hole masses of for the binary system and using the radial separation derived from our 2003 maps (7 pc), we find from Kepler’s laws that the period of rotation for a binary supermassive black hole system such as ours should be on the on the order of years. This period corresponds to an orbital velocity between components C1 and C2 of 0.001c, which is two orders of magnitude slower than our measured relative velocity of 0.16 c (see Table 3). Given the total merger time expected for galactic collisions (Haehnelt & Kauffmann, 2002), it is improbable that we would observe binary black holes in 0402+379 at the measured separation distance between components C1 and C2 if the black holes were not in a stable orbit. We emphasize, though, that the above calculation assumes a stable, Keplerian orbit, which might be a poor assumption. Moreover, the detection of relative motion between components C1 and C2 is only a 2 result, so C1 and C2 may not be moving significantly with respect to each other. We therefore believe that our motion results do not yet rule out the binary black holes explanation.
5 Conclusion
We have identified two plausible explanations for the anomalous features observed in 0402+379: (1) interactions with an unusually dense and complex circumnuclear medium; and (2) a binary black hole system. However, we find some features from our observations that neither theory can adequately explain. Namely, from our continuum maps, our motion results, and our HI measurements, we find that the medium surrounding 0402+379 does not appear to be dense enough to support the “dense medium theory.” In addition, the relative motion we detect between our two core candidates may be too great to support a theory that both central, compact, flat-spectrum components in our source are binary active nuclei, since the probability of detecting the system in an unstable orbit is quite low.
Because 0402+379 possesses several unusual, anomalous features, constraining the theories we use to describe it is absolutely necessary if we are to better understand CSOs in the unified scheme of AGN. Future observations could significantly help in this process. Obtaining another epoch in 2005 at 5 and 15 GHz would allow us to better probe the motion in 0402+379 and potentially allow us to test the supermassive binary black holes theory. Low frequency (i.e. 90 cm) VLBA observations at 50 mas resolution would also be helpful because they would allow us to search for a connection between our current VLA and VLBA observations, thereby providing more information regarding the large scale structure in 0402+379. In addition, high frequency VLBA observations at 22 and 43 GHz would allow us to search for a spectral turnover in the two core candidates, which would be very helpful in identifying the true core in this object if only one of our components is a nucleus. Finally, multi-wavelength observations could constrain theories describing this object. Although the host galaxy of 0402+379 is fairly bright with a magnitude of 17.2 (Xu et al., 1994), it has not been imaged in detail. Particularly useful, then, would be to image this source at high resolution in order to look for optical evidence of a merger or disturbances in the nucleus.
References
- Augusto et al. (1998) Augusto, P., Wilkinson, P. N., & Browne, I. W. A. 1998, MNRAS, 299, 1159
- Bartel et al. (1984) Bartel, N., Shapiro, I. I., Huchra, J. P., & Kuhr, H. 1984, ApJ, 279, 112
- Baum et al. (1990) Baum, S. A., O’Dea, C. P., de Bruyn, A. G., & Murphy, D. W. 1990, A&A, 232, 19
- Beasley et al. (2002) Beasley, A. J., Gordon, D., Peck, A. B., Petrov, L., MacMillan, D. S., Fomalont, E. B., & Ma, C. 2002, ApJS, 141, 13
- Bicknell et al. (1998) Bicknell, G. V., Dopita, M. A., Tsvetanov, Z. I., & Sutherland, R. S. 1998, ApJ, 495, 680
- Condon (1984) Condon, J. J. 1984, ApJ, 287, 461
- Fassnacht & Taylor (2001) Fassnacht, C. D. & Taylor, G. B. 2001, AJ, 122, 1661
- Fomalont et al. (2000) Fomalont, E. B., Frey, S., Paragi, Z., Gurvits, L. I., Scott, W. K., Taylor, A. R., Edwards, P. G., & Hirabayashi, H. 2000, ApJS, 131, 95
- Giroletti et al. (2003) Giroletti, M., Giovannini, G., Taylor, G. B., Conway, J. E., Lara, L., & Venturi, T. 2003, A&A, 399, 889
- Haehnelt & Kauffmann (2002) Haehnelt, M. G. & Kauffmann, G. 2002, MNRAS, 336, L61
- Ho et al. (1997) Ho, L. C., Filippenko, A. V., Sargent, W. L. W., & Peng, C. Y. 1997, ApJS, 112, 391
- O’Dea et al. (1992) O’Dea, C. P., Baum, S. A., Stanghellini, C., Dey, A., van Breugel, W., Deustua, S., & Smith, E. P. 1992, AJ, 104, 1320
- Oosterloo et al. (2000) Oosterloo, T. A., Morganti, R., Tzioumis, A., Reynolds, J., King, E., McCulloch, P., & Tsvetanov, Z. 2000, AJ, 119, 2085
- Owsianik & Conway (1998) Owsianik, I. & Conway, J. E. 1998, A&A, 337, 69
- Peck & Taylor (2000) Peck, A. B. & Taylor, G. B. 2000, ApJ, 534, 90
- Pollack et al. (2003) Pollack, L. K., Taylor, G. B., & Zavala, R. T. 2003, ApJ, 589, 733
- Readhead et al. (1996) Readhead, A. C. S., Taylor, G. B., Xu, W., Pearson, T. J., Wilkinson, P. N., & Polatidis, A. G. 1996, ApJ, 460, 612
- Shepherd et al. (1995) Shepherd, M. C., Pearson, T.J., & Taylor, G.B. 1995, BASS, 27, 903
- Sudou et al. (2003) Sudou, H., Iguchi, S., Murata, Y., & Taniguchi, Y. 2003, Science, 300, 1263
- Soucail et al. (1987) Soucail, G., Fort, B., Mellier, Y., & Picat, J. P. 1987, A&A, 172, L14
- Stickel et al. (1993) Stickel, M., Kuehr, H., & Fried, J. W. 1993, A&AS, 97, 483
- Taylor et al. (1996) Taylor, G. B., Readhead, A. C. S., & Pearson, T. J. 1996, ApJ, 463, 95
- van Moorsel et al. (1996) van Moorsel, G., Kemball, A., & Greisen, E. 1996, ASP Conf. Ser. 101: Astronomical Data Analysis Software and Systems V, 5, 37
- Ulvestad et al. (2001) Ulvestad, J., Greisen, E. W. & Mioduszewski, A. 2001, AIPS Memo 105:AIPS Procedures for initial VLBA Data Reduction, NRAO
- Vermeulen et al. (2003) Vermeulen, R. C. et al. 2003, A&A, 404, 861
- Wilkinson et al. (2001) Wilkinson, P. N. et al. 2001, Physical Review Letters, 86, 584
- Xu et al. (1994) Xu, W., Lawrence, C. R., Readhead, A. C. S., & Pearson, T. J. 1994, AJ, 108, 395
- Xu et al. (1995) Xu, W., Readhead, A. C. S., Pearson, T. J., Polatidis, A. G., & Wilkinson, P. N. 1995, ApJS, 99, 297
| Frequency | Instrument | Date | Integ. Time | BW | Polar. | IFs | Reference |
|---|---|---|---|---|---|---|---|
| (GHz) | (min) | (MHz) | |||||
| 1.39 | VLBA | 02 Mar 2003 | 651 | 16 | 2 | 1 | This Paper |
| 1.46 | VLA | 06 Nov 1992 | 4 | 50 | 2 | 2 | Xu et al. 1995 |
| 2.22 | VLBA | 06 July 1996 | 3 | 8 | 1 | 4 | Beasley et al. 2002 |
| 4.89 | VLA | 04 July 1982 | 2 | 50 | 2 | 1 | Unpublished |
| 4.99 | VLBI Mk 2 | 10 Mar 1990 | 80 | 2 | 1 | 1 | Xu et al. 1995 |
| 4.99 | VLBI Mk 2 | 17 Sep 1994 | 57 | 2 | 1 | 1 | Britzen et al. 2003, in prep. |
| 4.99 | VLBI | 19 Aug 1996 | 41 | 8 | 1 | 1 | Britzen et al. 2003, in prep. |
| 4.99 | VLBA | 26 Nov 1999 | 35 | 8 | 2 | 2 | Britzen et al. 2003, in prep. |
| 5.00 | VLBA | 02 Mar 2003 | 478 | 16 | 2 | 1 | This Paper |
| 8.15 | VLBA | 09 July 1996 | 3 | 8 | 1 | 4 | Beasley et al. 2002 |
| 15.35 | VLBA | 02 Mar 2003 | 478 | 16 | 2 | 1 | This Paper |
| Component | Epoch | S | r | a | b/a | |||
|---|---|---|---|---|---|---|---|---|
| (Jy) | (mas) | (o) | (mas) | (o) | ||||
| C1… | 1990 | 0.018 0.004 | 0.0 | 0.0 | 0.525 | 1.00 | 172.4 | 1.13 |
| 1994 | 0.040 0.009 | 0.0 | 0.0 | 0.525 | 1.00 | 172.4 | 0.90 | |
| 1996 | 0.040 0.003 | 0.0 | 0.0 | 0.525 | 1.00 | 172.4 | 1.31 | |
| 1999 | 0.050 0.004 | 0.0 | 0.0 | 0.525 | 1.00 | 172.4 | 1.28 | |
| 2003 | 0.060 0.004 | 0.0 | 0.0 | 0.525 | 1.00 | 172.4 | 2.07 | |
| C2… | 1990 | 0.010 | ||||||
| 1994 | 0.025 0.006 | 7.323 | -73.79 | 1.61 | 1.00 | -152.1 | 0.90 | |
| 1996 | 0.024 0.002 | 6.932 | -75.42 | 1.61 | 1.00 | -152.1 | 1.31 | |
| 1999 | 0.018 0.001 | 6.803 | -78.00 | 1.61 | 1.00 | -152.1 | 1.28 | |
| 2003 | 0.021 0.001 | 6.809 | -77.28 | 1.61 | 1.00 | -152.1 | 2.07 | |
| S1… | 1990 | 0.078 0.017 | 11.063 | -105.26 | 3.29 | 1.00 | -51.7 | 1.13 |
| 1994 | 0.090 0.020 | 12.154 | -108.78 | 3.29 | 1.00 | -51.7 | 0.90 | |
| 1996 | 0.087 0.006 | 11.978 | -108.54 | 3.29 | 1.00 | -51.7 | 1.31 | |
| 1999 | 0.090 0.006 | 11.600 | -108.17 | 3.29 | 1.00 | -51.7 | 1.28 | |
| 2003 | 0.119 0.007 | 11.846 | -108.81 | 3.29 | 1.00 | -51.7 | 2.07 | |
| S2… | 1990 | 0.291 0.064 | 14.119 | -111.55 | 1.51 | 1.00 | -57.7 | 1.13 |
| 1994 | 0.228 0.050 | 14.364 | -111.54 | 1.51 | 1.00 | -57.7 | 0.90 | |
| 1996 | 0.211 0.015 | 14.234 | -111.29 | 1.51 | 1.00 | -57.7 | 1.31 | |
| 1999 | 0.198 0.014 | 14.120 | -111.34 | 1.51 | 1.00 | -57.7 | 1.28 | |
| 2003 | 0.208 0.012 | 14.165 | -111.12 | 1.51 | 1.00 | -57.7 | 2.07 | |
| S3… | 1990 | 0.187 0.041 | 16.029 | -106.60 | 3.40 | 0.37 | 32.0 | 1.13 |
| 1994 | 0.168 0.037 | 16.144 | -107.25 | 3.40 | 0.37 | 32.0 | 0.90 | |
| 1996 | 0.158 0.011 | 16.149 | -107.52 | 3.40 | 0.37 | 32.0 | 1.31 | |
| 1999 | 0.152 0.011 | 16.084 | -107.61 | 3.40 | 0.37 | 32.0 | 1.28 | |
| 2003 | 0.186 0.011 | 16.015 | -107.52 | 3.40 | 0.37 | 32.0 | 2.07 | |
| S4… | 1990 | 0.006 0.001 | 17.454 | -108.73 | 2.72 | 0.10 | -26.2 | 1.13 |
| 1994 | 0.028 0.006 | 17.399 | -107.40 | 2.72 | 0.10 | -26.2 | 0.90 | |
| 1996 | 0.019 0.001 | 17.731 | -109.84 | 2.72 | 0.10 | -26.2 | 1.31 | |
| 1999 | 0.019 0.001 | 17.641 | -111.04 | 2.72 | 0.10 | -26.2 | 1.28 | |
| 2003 | 0.029 0.002 | 17.763 | -110.29 | 2.72 | 0.10 | -26.2 | 2.07 | |
| N1… | 1990 | 0.107 0.024 | 17.033 | 5.15 | 13.58 | 0.27 | 20.3 | 1.13 |
| 1994 | 0.093 0.020 | 18.678 | 4.72 | 13.58 | 0.27 | 20.3 | 0.90 | |
| 1996 | 0.086 0.006 | 19.143 | 5.95 | 13.58 | 0.27 | 20.3 | 1.31 | |
| 1999 | 0.085 0.006 | 18.874 | 5.45 | 13.58 | 0.27 | 20.3 | 1.28 | |
| 2003 | 0.105 0.006 | 19.271 | 6.13 | 13.58 | 0.27 | 20.3 | 2.07 | |
| N2… | 1990 | 0.044 0.010 | 21.103 | 12.86 | 2.38 | 1.00 | -105.8 | 1.13 |
| 1994 | 0.057 0.013 | 21.414 | 11.47 | 2.38 | 1.00 | -105.8 | 0.90 | |
| 1996 | 0.049 0.003 | 21.416 | 13.17 | 2.38 | 1.00 | -105.8 | 1.31 | |
| 1999 | 0.056 0.004 | 21.487 | 13.15 | 2.38 | 1.00 | -105.8 | 1.28 | |
| 2003 | 0.068 0.004 | 21.613 | 13.42 | 2.38 | 1.00 | -105.8 | 2.07 |
| Component | Velocity | Projection Angle**Angles measured from north through east. | Status | |
|---|---|---|---|---|
| (mas/yr) | (degrees) | |||
| C1 | … | … | … | Reference++Position RA 04h05m49.2623s Dec +38d03m32.235s (Beasley et al. 2002) |
| C2 | 0.0468 0.019 | 241.48 | 4.05 | 0.161 0.065 |
| S1 | 0.0727 0.010 | -143.31 | 33.95 | No motion |
| S2 | 0.0034 0.010 | -93.72 | 1.28 | No motion |
| S3 | 0.0124 0.010 | 197.42 | 0.08 | No motion |
| S4 | 0.0047 0.010 | 190.58 | 4.26 | No motion |
| N1 | 0.1670 0.010 | 14.58 | 72.21 | No motion |
| N2 | 0.0398 0.010 | 54.82 | 1.38 | 0.137 0.034 |
| Component | Frequency | Epoch | Peak Flux | RMS Noise | ||
|---|---|---|---|---|---|---|
| (GHz) | (mJy/beam) | (mJy/beam) | ||||
| C1… | 1.347 | 2003 | unresolved | … | 0.20 | |
| 2.220 | 1996 | 26.38 | .94 | |||
| 4.991 | 2003 | 53.53 | 2.1 | |||
| 8.150 | 1996 | 26.92 | 2.4 | |||
| 15.36 | 2003 | 66.72 | 1.3 | |||
| C2… | 1.347 | 2003 | unresolved | … | 0.35 | |
| 2.220 | 1996 | unresolved | ||||
| 4.991 | 2003 | 12.79 | 2.1 | |||
| 8.150 | 1996 | 10.12 | 2.4 | |||
| 15.36 | 2003 | 18.89 | 1.3 | |||
| S2… | 1.347 | 2003 | 247.89 | .49 | -0.42 | -1.38 |
| 2.220 | 1996 | 351.65 | .94 | |||
| 4.991 | 2003 | 141.92 | 2.1 | |||
| 8.150 | 1996 | 76.33 | 2.4 | |||
| 15.36 | 2003 | 29.93 | 1.3 | |||
| N2… | 1.347 | 2003 | 162.97 | .49 | -1.32 | -1.60 |
| 2.220 | 1996 | 104.48 | .94 | |||
| 4.991 | 2003 | 28.68 | 2.1 | |||
| 8.150 | 1996 | 7.91 | 2.4 | |||
| 15.36 | 2003 | 4.74 | 1.3 |
| Amplitude | Central Velocity | FWHM | NHI**Assuming a spin temperature of 100 K and a covering factor of 1. | |
|---|---|---|---|---|
| (mJy) | (km s-1) | (km s-1) | ( 1020 cm-2) | |
| 5.2 0.49 | 17,115 23 | 540 69 | 0.0179 0.0007 | 1.8 0.2 |