Active Galaxies With Double-Peaked Emission Lines and What They Imply About the “Broad-Line Region”
Abstract
I review the distinguishing observational characteristics of active galaxies with double-peaked emission lines and their implications for the nature of the line-emitting region. Since double-peaked lines most likely originate in the outer parts of the accretion disk, they can be used to study the structure and dynamics of the disk and the associated wind. Such studies lead to general inferences about the broad-line regions of all AGNs. To this end, I describe the results of recent UV spectroscopy of double-peaked emitters that probes the disk-wind relation. I also summarize efforts to exploit the variability of the lines to study dynamical and thermal phenomena in the disk.
Department of Astronomy & Astrophysics, The Pennsylvania State University, 525 Davey Lab, University Park, PA 16802
1. Introduction: Properties of Double-Peaked Emitters and Implications
Active galaxies with double-peaked emission lines (hereafter double-peaked emitters) make up a small fraction of nearby () AGNs. They are found in about 20% of the radio-loud AGNs surveyed by Eracleous & Halpern (1994,2003) and in about 4% of (radio-loud and radio-quiet) objects from the SDSS studied by Strateva et al. (2003; see also Strateva et al., this volume). Double-peaked emitters share a number of spectroscopic properties that set them apart from the average AGN and suggest a close relation to LINERs. These properties include: (a) unusually-strong low-ionization emission lines from the narrow-line region, (b) a large contribution of starlight to the optical continuum, and (c) Balmer lines that are, on average, a few times broader than those of other AGNs. The connection to LINERs is bolstered by the fact that a number of double-peaked emitters have Oxygen line ratios that satisfy the LINER definition and by the fact that a number of previously known LINERs were recently found to host double-peaked Balmer lines. About 40-50% of double-peaked H profiles can be described quite well by the relativistic, circular, Keplerian disk model of Chen, Halpern, & Filippenko (1989) and Chen & Halpern (1989); two examples are shown in Figure 1. The remaining profiles require more sophisticated models, in which the disk is not axisymmetric (e.g., elliptical disks or disks with bright spots or spiral arms).
The properties of double-peaked emitters can be interpreted in the context of the scenario of Chen & Halpern (1989) who suggested that the inner accretion disk has the form of an ion torus (Rees et al. 1982; known today as a radiatively inefficient accretion flow). Such a vertically-extended structure can illuminate the geometrically thin, outer disk and power the emission of double-peaked lines; external illumination is needed because the line luminosity is too high to be powered by local viscous dissipation. The same scenario can also explain the other spectroscopic properties of disk-like emitters, since the spectral energy distribution of an ion torus lacks the UV bump that is a trademark of emission from an optically thick inner disk (see discussion in Eracleous & Halpern 1994, 2003). It is noteworthy that several alternatives to accretion disk emission have been proposed and discussed in the literature. However, accretion disk emission is the interpretation favored by the data available today (see Eracleous & Halpern 2003 for a description of alternative scenarios and their comparison with observations).

2. UV Spectra of Double-Peaked Emitters and the Disk-Wind Relation
The UV spectra of double-peaked emitters obtained with the Hubble Space Telescope have revealed a dramatic difference between the profiles of the Balmer and UV lines. A good example of this difference is provided by Arp 102B (Halpern et al. 1996). The profiles of some of the strong optical and UV lines of Arp 102B are compared in the left panel of Figure 2. The Balmer and Mg ii lines of Arp 102B are double-peaked with , while the far-UV lines (e.g., Ly, C iii], C iv) are single peaked with bell-shaped profiles that have . Moreover, once a disk model is subtracted from the double-peaked H profile, the residual resembles the profiles of the UV lines. Figure 2 includes two more examples of double-peaked emitters displaying similar behavior: PKS 0921–213 and NGC 1097 (a nearby LINER). The far-UV lines of PKS 0921–213 are single-peaked and quite strong relative to the Balmer lines, resembling those of typical Seyfert galaxies. On the other hand, the far-UV lines of NGC 1097 are fairly weak in comparison to the Balmer lines and they include associated absorption troughs, which are slightly blueshifted. These absorption lines are another manifestation of a dense wind and they are particularly prominent in objects where the single-peaked far-UV lines are relatively weak or absent (see the discussion and illustrations in Eracleous, Halpern, & Charlton 2003 and Eracleous 2002).

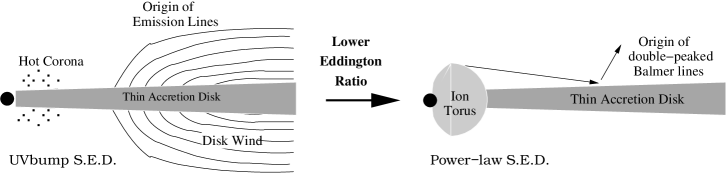
The UV spectra of double-peaked emitters lead to a number of interesting conclusions and general insights into AGN broad-line regions as follows. There seem to be at least two line-emitting regions in the same object, one producing the double-peaked Balmer and Mg ii lines, and another producing the single-peaked far-UV lines. These regions can be plausibly identified with an accretion disk consisting of dense, low-ionization gas and an outflowing wind of higher-ionization gas. This interpretation is based on the results of Collin-Souffrin & Dumont (1989) and Murray & Chiang (1997), which show that a weakly-ionized accretion disk is a very inefficient source of the far-UV lines; such lines should be emitted from a wind, whose velocity structure and radiative transfer properties lead to single-peaked line profiles. This interpretation also suggests a way of connecting double-peaked emitters to the greater AGN population: double-peaked emitters are the segment of the population in which the Eddington ratio (the accretion rate relative to the Eddington rate, ) is very low. In this extreme the inner accretion disk turns into an ion torus and the wind diminishes, perhaps due to a combination of a lower mass loss rate and the harder spectral energy distribution of the ion torus, which lacks a UV bump and makes radiative acceleration by far-UV photons less effective (e.g., Murray et al. 1995; Proga, Stone, & Kallman 2000). Thus, the disk proper is the predominant source of low-ionization lines. Seyfert galaxies and quasars probably represent the opposite extreme of a high Eddington ratio, where the inner disk is geometrically thin, and the wind is the primary source of all broad emission lines. This scenario is illustrated in Figure 3.
3. Long-Term Variability of the Line Profiles and Dynamical and Thermal Phenomena in the Disk
Since double-peaked emission lines afford us a rare view of AGN accretion disks, the long-term variability of their profiles can be exploited to investigate dynamical and thermal phenomena in these disks. However, such investigations require patience and persistence because of the long time scales involved. The relevant time scales can be cast as:
| light-crossing time: | ||||
| dynamical time: | ||||
| thermal time: | ||||
| sound-crossing time: |
In the above expressions, is the black hole mass in units of , is the radial distance in the disk in units of , is the temperature in units of K, and is the viscosity parameter of Shakura & Sunyaev (1973).
One must distinguish between variability of the emission-line flux due to reverberation of a variable continuum and variations of the emission-line profiles caused by changes in the structure of the line-emitting region. The former type of variation occurs on the light-crossing time and is not accompanied by significant profile variations, as shown by reverberation mapping of Seyfert galaxies (e.g., Ulrich et al. 1991; Wanders & Peterson 1996; Kassebaum et al. 1997) and of the double-peaked emitters 3C 390.3 and Arp 102B (Dietrich et al. 1998; Sergeev et al. 2002; Shapovalova et al. 2000; Sergeev, Pronik, & Sergeeva 2000). Significant changes in the line profiles occur on much longer time scales (on the order of the dynamical time, or longer), as shown by long-term monitoring of some of the brighter double-peaked emitters, such as Arp 102B, 3C 390.3, and 3C 332 (e.g., Newman et al. 1997; Zheng, Veilleux, & Grandi 1991; Gilbert et al. 1999).
A number of scenarios have been suggested and explored as explanations of the observed long-term variations of double-peaked line profiles. These scenarios are inspired by theoretical models for waves and other instabilities in the disks, which can be tested using the long-term behavior of the line profiles. The candidate scenarios include bright spots orbiting in the disk, precessing eccentric disks, disks with spiral waves, and even a binary broad-line region associated with a binary black hole. At this time, the spiral wave scenario appears to be the most promising: it has been successfully applied to 3C 390.3 and 3C 332 by Gilbert et al. (1999) and to NGC 1097 by Storchi-Bergmann et al. (2003). In the case of NGC 1097 this scenario not only explains the variability trend, but it also leads to an estimate of the precession period that is consistent with the black hole mass inferred from stellar kinematics (see the detailed discussion in Storchi-Bergmann et al. 2003).
Our group has been carrying out a long-term monitoring program of many double-peaked emitters over the past decade. Examples of our most recent results are presented in the paper by Lewis et al. in this volume. Our observational goals are to characterize the variability patterns, find out if these patterns recur, and if so on what time scale. The most obvious trend that we observe is a modulation of the relative heights of the two peaks on time scales of order 5–10 years. Using our long-term variability data, we have been able to reject the binary broad-line scenario for the origin of the double-peaked lines, based on the absence of radial velocity variations in the two peaks (Eracleous et al. 1997). This does not mean that we disfavor binary black holes as such; in fact binary black holes may be important ingredients in some of the currently viable scenarios (e.g., the elliptical disk scenario).
In parallel to the observational effort, we have been developing parametric descriptions of dynamical models and comparing them with observations (see, for example, Storchi-Bergmann et al. 2003). We have found that a detailed comparison of model line profiles with the data allows us to select a favorite model on the basis of the variability pattern and with the help of additional constraints, such as the black hole mass, which sets the variability time scale in the model. Since candidate models are falsifiable, we hope to make use of our data to identify a universal scenario, or narrow down the possibilities at the very least. This would represent substantial progress and could lead to insights on the mechanisms of angular momentum transport in the outer accretion disks of AGNs and the poorly understood causes of AGN variability.
Acknowledgments.
I am grateful to Jules Halpern and Karen Lewis for their critical reading of the manuscript and for helpful comments and suggestions. Karen Lewis also prepared the original version of the cartoon shown in Figure 3.
References
Chen, K. & Halpern, J. P. 1989, ApJ, 344, 115
Chen, K., Halpern, J. P., & Filippenko, A. V. 1989, ApJ, 339, 742
Collin-Souffrin, S., & Dumont, A. M. 1989, A&A, 213, 39
Eracleous, M. 2002, in Mass Outflow from Active Galactic Nuclei, New Perspectives, ASP Conf. Ser., 255, eds. D. M. Crenshaw et al. (San Francisco: ASP), 131
Eracleous, M. & Halpern, J. P. 1994, ApJS, 90, 1
Eracleous, M. et al. 1997, ApJ, 485, 570
Eracleous, M. & Halpern, J. P. 2003, ApJ, 599, in press (astro-ph/0309149)
Eracleous, M., Halpern, J. P., & Charlton, J. C. 2003, ApJ, 582, 633
Gilbert, A. M. et al. 1999, in Structure and Kinematics of Quasar Broad Line Regions, ASP Conf. Ser., 175, eds. C. M. Gaskell, et al. (San Fransisco: ASP), 189
Halpern, J. P., et al. 1996, ApJ, 467, 704
Kassebaum, T. M., et al. 1997, ApJ, 475, 106
Murray, N., & Chiang, J. 1997, ApJ, 474, 91
Murray, N., Chiang, J., Grossmann, S. A. & Voit, G. M. 1995, ApJ, 451, 498
Newman, J. A., et al. 1997, ApJ, 485, 570
Proga, D., Stone, J. M., & Kallman, T. R. 2000, ApJ, 543, 686
Rees, M. J., et al. 1982, Nature, 295, 17
Sergeev, S. G., Pronik, V. I., & Sergeeva, E. A. 2000, A&A, 356, 41
Sergeev, S. G., et al. 2002, ApJ, 576, 660
Shakura, N. I., & Sunyaev, R. S. 1973. A&A, 24, 337
Shapovalova, A. I., et al. 2001, A&A, 376, 775
Storchi-Bergmann, T., et al. 2003, ApJ, 598, in press (astro-ph/0308327)
Strateva, I. V., et al. 2003, AJ, 126, 1720
Ulrich, M.-H., et al. 1991, ApJ, 382, 483
Wanders, I. et al. 1995, ApJ, 453, L87
Zheng, W., Veilleux, S., & Grandi, S. A. 1991, ApJ, 381, 418