Deep near-infrared imaging of RDCS J1252.9-2927 at z=1.237
We present deep SofI and ISAAC near-infrared imaging data of the X-ray luminous galaxy cluster RDCS J1252.9-2927. The ISAAC data were taken at the ESO Very Large Telescope under very good seeing conditions and reach limiting Vega magnitudes of 25.6 and 24.1 in the and bands respectively. The image quality is 045 in both passbands. We use these data to construct a colour-magnitude (C-M) diagram of galaxies that are within 20″ of the cluster center and brighter than , which is five magnitudes fainter than the apparent magnitude of a galaxy in this cluster. The C-M relation is clearly identified as an over-density of galaxies with colours near . The slope of the relation is and the intrinsic scatter is 0.06 magnitudes with a 90% confidence interval that extends from 0.04 to 0.09 magnitudes. Both the slope and the scatter are consistent with the values measured for clusters at lower redshifts. These quantities have not evolved from to . However, significant evolution in the mean colour is detected. On average, the galaxies in RDCS J1252.9-2927 are 0.25 magnitudes bluer than early-type galaxies in the Coma cluster. Using instantaneous single-burst solar-metallicity models, the average age of galaxies in the center of RDCS J1252.9-2927 is 2.7 Gyrs.
Key Words.:
galaxies:clusters:general – galaxies:evolution – galaxies:formation – galaxies:photometry1 Introduction
The tight relation between colour and apparent magnitude for early-type galaxies in massive galaxy clusters (the C-M relation) is seen at all redshifts, from the nearest clusters (Bower, Lucy & Ellis Bower92 (1992)) to the most distant clusters currently known (Rosati et al. Rosati99 (1999), Nakata et al. Nakata01 (2001); van Dokkum et al. vanDokkum01b (2001); Stanford et al. Stanford02 (2002); Blakeslee et al. Blakeslee03 (2003), hereafter BFP).
Observations show that although the zero-point of the C-M relation evolves considerably with increasing redshift (Aragón-Salamanca et al. Aragon93 (1993); Stanford et al. Stanford98 (1998), hereafter SED; van Dokkum et al. vanDokkum01b (2001); Stanford et al. Stanford02 (2002); BFP), the slope of the relation and the scatter about it appear to evolve very little (Ellis et al. Ellis97 (1997); SED, van Dokkum et al. vanDokkum00 (2000); BFP). However, for some clusters at , there is tentative evidence for a flattening in the slope (van Dokkum et al. vanDokkum01b (2001); Stanford et al. Stanford02 (2002)).
Complimentary studies of clusters up to show that significant evolution is also occurring in the galaxy luminosity function (De Propris et al. DePropris98 (1998); Massarotti et al. Massarotti03 (2003); Toft, Soucail & Hjorth Toft03b (2003)) and the fundamental plane (van Dokkum et al. vanDokkum98 (1998), van Dokkum et al. vanDokkum03 (2003)). Early-type galaxies in rich galaxy clusters are uniformly becoming both brighter and bluer as they become younger.
The monolithic collapse scenario of Eggen, Lynden-Bell & Sandage (Eggen62 (1962)) is an attractive framework to model the observations. In this scenario, the bulk of the stars form in a single burst over a relatively short period of time at redshifts greater than two (Ellis et al. Ellis97 (1997); Bower, Lucy and Ellis, Bower92 (1992)). Hence, the scatter about the C-M relation and the slow steady evolution in the colours and luminosities of early-type galaxies are explained by the great age of the bulk of the stars. Extensions to this model allow future merging and star formation, but the scatter in the C-M relation limits the amount of merging and star formation that can take place (Bower, Kodama & Terlevich Bower98 (1998)).
This picture of passively-evolving, very old early-type galaxies in massive clusters should be compared to observations of moderately distant clusters ( to ) which show that the fraction of late-type, star-forming galaxies in massive clusters increases with redshift (Dressler et al. Dressler97 (1997); Couch et al. Couch98 (1998), van Dokkum et al. vanDokkum00 (2000); Nakata et al. Nakata01 (2001)), while the fraction of early-type galaxies does the opposite (Treu et al. Treu03b (2003); van Dokkum et al. vanDokkum00 (2000)). This picture should also be compared to semi-analytic and direct N-body numerical simulations which show that galaxy formation and evolution involves ubiquitous merging at all epochs (Kauffman and Charlot, Kauffmann98 (1998); Cole et al. Cole00 (2000); Pearce et al. Pearce01 (2001)). The simulations are able to reproduce the slope in the C-M relation and the scatter about it in present day clusters, although some difficulties, particularly at the high mass end, remain (Cole et al. Cole00 (2000)). At higher redshifts, the slope is predicted to flatten and the scatter is predicted to stay approximately constant, although there is a slight increase in the scatter at the bright-end of the C-M relation for clusters with (Kauffman & Charlot, Kauffmann98 (1998); Ferreras & Silk Ferreras00 (2000)).
Thus, there are two quite distinct pictures for the formation of early-type galaxies. In hierarchical merger models, the bulk of the stars form in disk-like galaxies that later merge to become early-type galaxies. In monolithic collapse models, the bulk of the stars form in early-type galaxies and subsequent merging and star formation are limited. In both models, the C-M relation is fundamentally a relation between the mass of a galaxy and the average metallicity of the stellar population (Faber Faber73 (1973)). In hierarchical merger models, large ellipticals are formed from large spirals, which are better able to retain the metals that result from stellar evolution (Kauffman and Charlot Kauffmann98 (1998)). Similarly, in monolithic collapse models, larger ellipticals are better able to retain their metals. Although age differences can be used to explain the slope of the C-M relation at low redshifts, the slope and the C-M relation itself are lost by (Kodama & Arimoto Kodama97 (1997)) if age is the sole reason for the slope.
The morphological evolution that is seen in hierarchical models can lead to a bias (the progenitor bias) in morphologically selected samples (van Dokkum et al. vanDokkum00 (2000); van Dokkum et al. vanDokkum01a (2001)). The bias causes the progenitors of the youngest low-redshift ellipticals to drop out of morphologically selected high-redshift samples. Consequently, the C-M relation is similar to that of a single-age stellar population formed at very high redshift and the scatter in the relation is approximately redshift independent. The progenitor bias is implicitly included in the semi-analytical simulations described above and allows the star formation history of early-type galaxies in clusters to be considerably more varied than that in monolithic collapse models. The model predicts that the fraction of early type galaxies in clusters decreases with increasing redshift.
The importance of progenitor bias depends on the origin of the scatter in the C-M relation. If the scatter is entirely caused by age differences, then progenitor bias is important. If the scatter is partially caused by other effects, such as dissipationless merging with little subsequent star formation (van Dokkum & Ellis, vanDokkum03b (2003)) or metallicity, then progenitor bias becomes less important and both the average age of the galaxies and the degree to which galaxies form coevally increase. The importance of progenitor bias also depends on the method used to derive C-M relations. C-M relations that are derived from morphological catalogues are more likely to be biased than C-M relations that are derived from photometric or complete spectroscopic catalogues.
Although hierarchical models have become the standard model for describing the formation of early-type galaxies in both cluster and field environments, these models are unable to describe all the observational data. Whereas the hierarchical merging model predicts a dramatic difference in the star formation histories of early-type galaxies in the field and in clusters (Diaferio et al. Diaferio01 (2001)), only small differences are inferred from observational data (Willis et al. Willis02 (2002); Treu et al. Treu02 (2002); Treu Treu03a (2003); van Dokkum & Ellis vanDokkum03b (2003)). More stringent tests of hierarchical models will come from observations of field and cluster galaxies beyond .
In this paper we describe deep near-infrared (NIR) observations of RDCS J1252.9-2927, an X-ray luminous cluster of galaxies at z=1.237 (Rosati et al. Rosati03a (2003)). These observations allow us to construct a NIR C-M diagram of one of the most distant massive clusters known to an unprecedented depth and accuracy. Throughout this paper, we assume , and km/s/Mpc. In this cosmology, 1′ on the sky corresponds to approximately 0.5 Mpc at . Unless specified otherwise, all colours and magnitudes are on the 2MASS system.
2 Observations
2.1 SofI NIR imaging
As part of an NIR program to confirm high redshift galaxy clusters in the ROSAT Distant Cluster Survey (Rosati et al. Rosati98 (1998)), RDCS J1252.9-2927 was observed during the nights of 1998 July 9th, 10th and 11th with SofI (Moorwood, Cuby & Lidman, Moorwood98 (1998)) on the ESO-NTT at the Cerro La Silla Observatory. SofI is equipped with a Hawaii 1024x1024 HgCdTe array, which, in the large field imaging mode, results in a pixel scale of 029 per pixel and a field of view of 49. The observations were done in and , which, at the redshift of the cluster, approximately correspond to the rest frame and bands.
Individual exposures lasted 10 seconds in and 20 seconds in and six of these were averaged to form a single image. Between images, the telescope was offset by 10″ to 30″ in a semi-random manner.
The data were reduced in the standard way. From each image, the zero-level offset was removed, a flatfield correction was applied, and an estimate of the sky from other images in the sequence was subtracted. Images with the best image quality, defined here as the Full Width at Half Maximum (FWHM) of stellar sources, were then registered and combined. A summary of the data is given in Table 1. The central part of the SofI band image is shown in Fig. 1.
The atmospheric conditions at the time the data were taken were very good. Zero Points (ZP) were derived by observing standards from the photometric catalogue of Persson et al. (Persson98 (1998)). Several standards were observed during each night. The scatter in the and ZPs throughout the entire run were less than 0.02 magnitudes. The SofI and filters are a good match to those used in the LCO (Persson) system, so no colour corrections between the natural SofI system and the LCO (Persson) system are made. However, we do transform the magnitudes and colours to the 2MASS system (Carpenter Carpenter01 (2001))111See also http://www.astro.caltech.edu/2mass.. Since the 2MASS and LCO systems are very similar, the transformations are small.
| Filter | Exposure | Image Quality | Detection Limit |
|---|---|---|---|
| (seconds) | (″) | (Vega magnitudes) | |
| 5400 | 0.68 | 21.1 | |
| 5040 | 0.72 | 22.5 |
We used the SExtractor software (Bertin & Arnouts Bertin96 (1996)) to detect objects, to do the photometry and to classify sources as either point like or extended. The colours are derived from the flux within fixed apertures of 6 pixels (173). A small correction (0.02 magnitudes) is applied to the J band data to account for the slightly poorer image quality. The total magnitude was estimated using the “BEST” magnitude in SExtractor (Bertin & Arnouts Bertin96 (1996)). Since many of the sources in the center of the cluster are blended, the total magnitude was more often than not the corrected isophotal magnitude.
The flux of non-stellar sources are corrected for galactic extinction. Using (Bouwens et al. Bouwens03 (2003)), the corrections for and are 0.067 and 0.027 magnitudes respectively. Stellar sources are not corrected for galactic extinction.
About a dozen sources from the 2MASS point source catalogue are visible in the SofI images. The photometry for objects brighter than and in the SofI images is generally poor because of detector non-linearity. However, for fainter objects, we can make a comparison between SofI magnitudes and those in the 2MASS catalogue. The variance weighted differences between the magnitudes in the 2MASS catalogue and the SofI derived magnitudes for 9 objects in common is and .
The C-M diagram of objects within 20″ of the cluster center is shown in figure 2. An over-density of galaxies with is clearly seen in this diagram. Over the entire SofI image other populations can be identified. Stars have colours that vary between 0 and 1.0, with a well defined peak at , which corresponds to early M-dwarfs, and a less well defined peak at , which corresponds to mid-G-dwarfs.
The co-incidence of X-ray emission with two relatively bright galaxies () and the distinctive sequence of galaxies with showed that RDCS J1252.9-2927 was probably a distant, rich galaxy cluster worthy of a more detailed study. We therefore initiated a program to obtain deep NIR images with ISAAC (this paper), deep optical and comprehensive spectroscopic observations (Rosati et al. in preparation; Demarco et al. in preparation) and deep X-ray observations (Rosati et al. Rosati03a (2003)).

2.2 ISAAC NIR imaging
RDCS~J1252.9-2927 was re-observed with ISAAC (Moorwood et al. Moorwood99 (1999)) on Antu (VLT-UT1) at the Cerro Paranal Observatory. The observations were done in service mode and the cluster was observed on 25 separate nights, starting on 2001 March 12th and ending on 2001 July 9th.
ISAAC, like SofI, is equipped with a Hawaii 1024x1024 HgCdTe array, which, in the S2 imaging mode, results in a pixel scale of 01484 per pixel and a field of view of 25. The cluster was imaged in and . The filter is slightly narrower and redder than typical filters and the blue edge of the filter is defined by the filter and not the atmosphere. This results in more stable photometry at the expense of introducing a small colour term.
We did not center the cluster within the ISAAC field of view. Instead we used a series of pointings which put the cluster into the four corners of the array. The resulting union of images covers a region which is slightly smaller than the region covered by the SofI data, but is significantly deeper and has significantly better image quality.
Individual integrations lasted 15 seconds in and 30 seconds in , and four of these were averaged to form a single image. Between images, the telescope was offset by 10″ to 30″ in a semi-random manner, and typically 30 to 40 images were taken in this way in a single observing block. In total, approximately 6 hours in both and were spent at each pointing. Since the cluster center was visible in all pointings, approximately 24 hours is spent on the cluster in both and .
In addition to these deep images, two additional regions that flank the eastern and western edges of the mosaic were observed so that potential cluster galaxies could be identified for later spectroscopic follow-up (Demarco et al. in preparation). The total exposure time in each of the these flanking fields is 18 minutes, so the depth in these images considerably shallower that the depth obtained in the center of the mosaic. The details are given in Table 2.
| Filter | Region | Exposure | Image Quality | Detection Limit |
|---|---|---|---|---|
| (seconds) | (″) | (Vega magnitudes) | ||
| Mosaic | 81990 | 0.45 | 24.1 | |
| Mosaic | 86640 | 0.45 | 25.6 | |
| Eastern | 1080 | 0.40 | 21.5 | |
| Eastern | 1080 | 0.43 | 23.3 | |
| Western | 1080 | 0.32 | 21.5 | |
| Western | 1080 | 0.40 | 23.3 |
The data were reduced in a similar way to that used for the SofI data, but with following additional steps.
-
•
The difference in the relative level between odd and even columns was removed. The relative difference is a function of the average count level and it evolves with time.
-
•
An electronic ghost, which is most easily seen when there are bright stars in the field of view, was removed.
-
•
Sky subtraction is done with object masking. We used the XDIMSUM package for this step.
-
•
Images were corrected for field distortion, which can amount to several pixels at the edges of the ISAAC field of view.
-
•
Individual images were scaled to a common ZP before being combined.
The atmospheric conditions at the time the data were taken were very good. All but two of the nights were photometric and the image quality on the raw images varied between 025 to 08, with a median around 045. Zero points were derived from the observations of photometric standards from the catalogue of Persson et al. (1998). The ISAAC colours were transferred to the LCO (Persson) system using the transformation
As with the SofI data, the colours and magnitudes were then transferred to the 2MASS system (Carpenter Carpenter01 (2001)) and only non-stellar sources are corrected for galactic extinction.
The ISAAC data were taken over a large number of nights and, consequently, the image quality over the entire mosaic is slightly variable. The dispersion in the image quality as measured from bright stars over the entire mosaic is about 8% in and 5% in . The median ellipticity is 0.05 and 0.03 for the and images respectively. In the central part of the mosaic, the uniformity of the PSF is considerably better, since the central part of the mosaic is common to all images.
We used the SExtractor software (Bertin & Arnouts Bertin96 (1996)) to detect objects, to do the photometry and to classify sources as either point like or extended. The colour for objects in the central part of the mosaic are derived from the flux within fixed apertures of 6 pixels (089 diameter). Since the image quality in the central part of the and ISAAC mosaics are very similar, there are no aperture corrections to the colours. The photometric errors were calculated independently, since the error in a fixed aperture is larger than the error that one would derive by multiplying the noise in a single pixel by the square root of the number of pixels in the aperture (Labbé et al. Labbe03 (2003)). The total magnitude was estimated using the “BEST” magnitude in SExtractor (Bertin & Arnouts Bertin96 (1996)).
The independently calibrated SofI images are used to check the photometric accuracy of the ISAAC data. The difference in the absolute calibrations are less than 0.02 magnitudes and the scatter in the colour of relatively bright objects () is 0.02 magnitudes over a region that is within 30″ of the cluster center. The scatter increases to 0.03 magnitudes if all objects within the region covered in Fig. 3 are included. The scatter increases with increasing area because image quality becomes more variable as one moves away from the cluster center and all colour measurements are based on aperture magnitudes. Unless otherwise stated, we restrict the measurement of cluster properties in the analysis that follows to those galaxies that lie within 20″ of the cluster center. This region has been selected as a compromise between maximising the number of cluster galaxies with respect to the number of field galaxies and obtaining a sufficient number of cluster galaxies for analysis.
We also cross checked the photometry of the brightest cluster galaxies. Although there is significant dispersion in the total magnitude, about 0.15 magnitudes, the dispersion in the colour is less than 0.02 magnitudes and the mean difference is less than 0.01 magnitudes. The comparison between the independently calibrated SofI and ISAAC data and the comparison between objects in the SofI data and in the 2MASS catalogue suggest that the systematic error in our colours is no larger than 0.03 magnitudes.
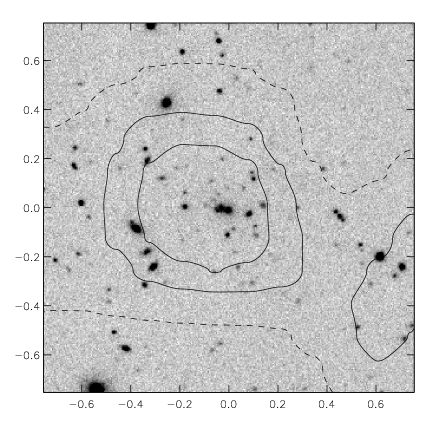
The central 75″ of the ISAAC band image is shown in Fig. 3. This images can be compared to the image taken with SofI (Fig. 1), and it demonstrates the increased depth and spatial resolution of the ISAAC data.
We mark the spectrally confirmed cluster members (Demarco et al. in preparation) that lie fully within Fig. 3 with arrows. With the exception of one cluster galaxy, which has the morphology of an edge on spiral and [OII] emission, the morphologies of the spectrally confirmed cluster members are consistent with the morphologies of early-type galaxies. None of these galaxies show detectable [OII] emission (Demarco et al. in preparation). For comparison, three spectrally confirmed field galaxies that lie with 20″ of the cluster center are circled. The colours and morphologies of these three galaxies are quite different to the colours and morphologies of the spectrally confirmed cluster members. One appears to be slightly disturbed edge-on spiral and the other two have highly irregular morphologies.
There appears to be two relatively red arc-like features about 20″ from the cluster center. Their shape and distance from the cluster are suggestive of giant gravitational arcs. However, higher resolution imaging and spectroscopy would be needed before conclusions could be drawn.
3 Results
3.1 The colour magnitude diagram
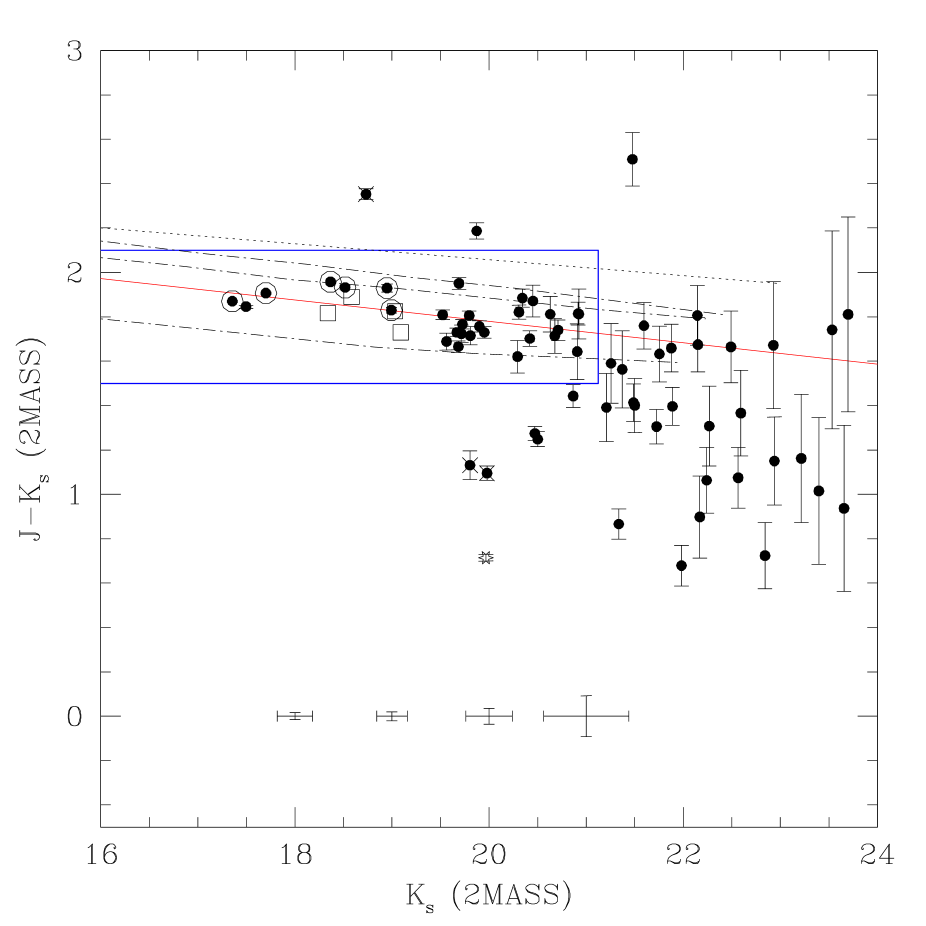
The ISAAC C-M diagram of objects within 20″ of the cluster center is shown in Fig. 4. Objects are plotted as solid symbols if they were classified as extended or as a star if they were classified as a point source. Objects fainter than are not classified and are plotted as solid symbols. Unlike the C-M diagram that was derived from the SofI data (Fig. 2) and for reasons of clarity, objects outside this radius are not plotted. If they were, one would see a similar peak in the colours of stellar-like objects around .
Spectrally confirmed cluster members and field galaxies are marked with circles and crosses respectively. The field galaxies are also marked in Fig. 3, and all of them are morphologically distinct from the spectrally confirmed cluster members.
Galaxies that are within 20″ of the cluster center lie on a well defined C-M relation. The line in Fig. 4 is a fit to the galaxies within the blue rectangle (i.e. galaxies with , and ) and within 20″ of the cluster center. Even thought the fit has been done for galaxies brighter than , the upper envelope in the colour of galaxies that are as faint as is defined by this relation. We also indicate, with boxes in Fig. 4, the location of four spectrally confirmed cluster galaxies that are more than 20″ form the cluster center but within the area bounded by Fig. 3. These cluster galaxies also lie on the C-M relation.
Recently, Labbé et al (Labbe03 (2003)) measured the galaxy number counts to very faint NIR magnitudes. We have used their results to estimate that, to , six field galaxies are expected within 20″ of the cluster center, which is considerably fewer than the 36 galaxies we do observe. We do not separate field and cluster galaxies when fitting the C-M relation, since the three spectrally confirmed field galaxies are already excluded by our colour cuts, i.e. they lie outside the blue rectangle in Fig. 4, and the remaining small number of unidentified field galaxies are unlikely to bias our fit.
The fit to the C-M relation was determined by adjusting the amount of intrinsic scatter that had to be added to the data until the reduced was one. A floor to the error in the colour, as determined by comparing the colours of the brightest galaxies in the ISAAC and SofI data, was set to 0.02 magnitudes. Only those objects within the blue rectangle in Fig. 4 were used in the fit. Separate fits were done for regions of different radii centered on the cluster. In all cases, the dominant source of scatter is the intrinsic scatter. For completeness, we also report the fit to the slope of the C-M relation without adding additional scatter. The fits, the observed scatter and the inferred intrinsic scatter are reported in Table 3.
| Radius | Number of | Slope1 | Slope2 | Observed | Intrinsic | 90% confidence region |
|---|---|---|---|---|---|---|
| (″) | Objects | Scatter | Scatter | for intrinsic scatter | ||
| 10 | 14 | -0.046 | -0.058 0.017 | 0.066 | 0.060 | 0.039 to 0.091 |
| 15 | 19 | -0.052 | -0.055 0.015 | 0.068 | 0.058 | 0.041 to 0.086 |
| 20 | 29 | -0.046 | -0.048 0.015 | 0.082 | 0.070 | 0.052 to 0.093 |
Notes:
1 No added scatter
2 With additional scatter
In measuring the intrinsic scatter, it is imperative that measurement errors are accurately estimated. We checked the accuracy of our measurement errors by adding artificial galaxies directly to the reduced data and by processing the artificial and real data in an identical manner. The errors estimated in this way are in excellent agreement with the errors that are estimated from the image noise. Representative error bars are plotted in lower part of Fig. 4 for galaxies with apparent magnitudes of 18, 19, 20 and 21.
We also used this technique to check for biases in the photometry. There is a tendency for the SExtractor BEST magnitude to miss an increasing fraction of the flux as objects become fainter. However, the error is less than 0.2 magnitudes over the magnitude range in which the fit to the C-M relation is done. Aperture magnitudes and the colours that are derived from them are unbiased.
The slope of the C-M relation is -0.05 magnitudes per magnitude, which is quite similar to the slope measured in clusters with redshifts up to (SED). If the fit is done using aperture magnitudes instead of the total magnitudes, the slope steepens slightly, although the change is within the measurement error. The scatter about the relation is unchanged. If the fit was repeated just for the spectrally confirmed cluster galaxies that are marked in figure 3, the fitted slope and the measured scatter are also similar.
Recent observations of clusters above have pointed to a possible flattening in the slope (van Dokkum et al. vanDokkum01b (2001); Stanford et al. Stanford02 (2002)). We see no evidence for a flattening in the slope of the C-M relation in RDCS J1252.9-2927. The dotted line in Fig. 4 is how the C-M relation of the Coma cluster would appear if it were moved to the redshift of RDCS J1252.9-2927 (Rosati et al. Rosati99 (1999)). Within the measurement uncertainties the slope for RDCS J1252.9-2927 is the same, but the colours of galaxies in RDCS J1252.9-2927 are on average 0.25 magnitudes bluer. This result is consistent with the trend seen in SED.
We estimate the intrinsic scatter to be 0.06 magnitudes with a 90% confidence interval from 0.04 to 0.09 magnitudes. This is similar to the scatter seen in clusters with redshifts up to (SED). Even, if we have grossly overestimated the measurement errors, which is unlikely, the intrinsic scatter cannot be much larger than the measured scatter (0.06-0.08 magnitudes).
Within 20″ (0.16 Mpc) of the cluster center, 90% of galaxies brighter than , which is approximately 2.5 magnitudes fainter than the apparent magnitude of an galaxy in this cluster (Toft et al. in preparation) and 3.5 magnitudes fainter than the brightest cluster members, lie on the C-M relation. Three of the seven galaxies that do not lie on the sequence were found to be non-cluster members from follow-up spectroscopy. Of the other four, one is redder than the C-M relation and the other three are fainter than . There is no progenitor bias in the central regions of this cluster.
The average colour of a galaxy in RDCS J1252.9-2927 is . This is similar to the colours measured for the early-type galaxies in RX J0848.9+4452 at (Rosati et al. Rosati99 (1999)), which have on the UKIRT system. However, the transformation between the UKIRT and 2MASS systems is uncertain, so it is not clear how comparable the average colour of galaxies in these two clusters are. Using the transformation equations in Hawarden et al. (Hawarden01 (2001)), the colours agree very well, but using the transformation equations of Carpenter (Carpenter01 (2001)), one would find that the early-type galaxies RX J0848.9+4452 are 0.1 magnitudes redder.
3.2 The epoch of galaxy formation
We have used the monolithic collapse models of Kodama and Arimoto (Kodama97 (1997)) to illustrate how the C-M relation changes with formation redshift. In these models, star formation occurs during gas infall and terminates when the energy from supernovae ejecta exceeds the binding energy of the gas. Larger galaxies are able to hold onto their gas longer, and, consequently, star formation occurs over a more extended period of time and they have higher mean metallicities. Three models (with = 2,3 and 5, where is the redshift of formation) are plotted in Fig. 4 as the dot-dashed lines. They reproduce the measured slope very well and would suggest that the bulk of the stars in this cluster formed between and .
We have also used the simple stellar population (SSP) synthesis models of Bruzual and Charlot (Bruzual03 (2003)) to estimate the mean age and the age spread of galaxies in the center of RDCS J1252.9-2927. We use , which is the average colour of a galaxy in the cluster, and a spread in colours from to to estimate the mean age and the age spread. If we assume that the spread in colours is entirely due to age difference, then, for instantaneous single-burst models with solar metallicity, a mean age of approximately 2.7 Gyrs and an age spread from 2.2 to 3.2 Gyrs are derived. These correspond to a mean formation redshift of and a spread in formation redshifts from to . The upper limits are highly uncertain. An increase of magnitudes in , which is smaller than our estimate of the systematic error, will move the upper limit beyond . The model colours in these simple models do not get much redder than for solar metallicities.
If these models are allowed to evolve passively to , the corresponding scatter in evolves to less than 0.01 magnitudes, which is considerably less than the scatter measured in SED. However, we caution that there are differences in the way C-M relations in this paper and Stanford et al. have been built. The C-M relation in this paper is created from the central 0.33 Mpc of the cluster, whereas those of SED are created from larger areas. With additional optical and spectroscopic data on RDCS J1252.9-2927, one will be able to extend the area over which the C-M relation is derived so that a more robust comparison can be made.
Since the observed scatter in does not change from to the present day, and since the scatter in SSP and monolithic collapse models should decrease as time goes on, it seems unlikely that the observed scatter in RDCS J1252.9-2927 is solely due to age differences. Alternative reasons for the scatter are metallicity variations at constant luminosity and/or dissipationless merging with little subsequent star formation. Such mergers may have already been identified in both cluster and field environments (vanDokkum et al. vanDokkum99 (1999); van Dokkum et al. vanDokkum01b (2001); van Dokkum et al. vanDokkum03b (2003)).
If most of the scatter is due to metallicity differences, the mean age of formation does not change, but the range of redshifts over which galaxies would have formed narrows. If most of the scatter is due to dissipationless merging, then, in the monolithic collapse models of Kodama and Arimoto (Kodama97 (1997)), the mean age increases and the formation redshift is pushed higher, because galaxies will move left and down in the C-M diagram after the merging has taken place. The directions that galaxies move depend on the relative masses and metallicities of the progenitors.
The derived formation epoch is directly related to the assumed metallicity and the star formation history. If a lower metallicity was assumed, an earlier formation epoch would be derived. This is the well known age-metallicity degeneracy, and the NIR imaging data that are presented here cannot break the degeneracy. An advance in this area will require a comparison between deep spectroscopic data and the most recent stellar population synthesis models (Bruzual & Charlot Bruzual03 (2003)). However, in the SSP models that have been used here, the galaxies in RDCS J1252.9-2927 cannot be much metal poorer than solar, otherwise the formation epoch is pushed beyond the big bang. Additionally, the metallicity of the intra-cluster medium in this cluster is times solar (Rosati et al. Rosati03a (2003)).
4 Conclusions
We have obtained very deep, and -band images of the X-ray luminous galaxy cluster RDCS J1252.9-2927 at with ISAAC on the ESO VLT and with SofI on the ESO NTT. The data enable us to construct a versus C-M diagram to , which is five magnitudes below (Toft et al. in preparation).
Galaxies within 20″ of the cluster center define a tight C-M relation. The slope of the relation is -0.05 magnitudes per magnitude and is similar to the slope measured in clusters at lower redshifts (SED). This strengthens the hypothesis that the slope in the C-M relation is due to metallicity and not age. We see no evidence for a flattening in the slope as predicted in hierarchical models and tentatively observed in clusters at (van Dokkum et al. vanDokkum01b (2001); Stanford et al. Stanford02 (2002)).
More than 90% of the galaxies within 20″ of the cluster center and brighter than lie on the C-M relation. There is no progenitor bias in the centre of this cluster.
The intrinsic scatter in the colour of galaxies about the C-M relation in RDCS J1252.9-2927 is 0.06 magnitudes and is similar to the scatter measured in clusters from to (SED). Hence, the scatter has not evolved from to the present day. This weakens the hypothesis that the scatter in the C-M relation is solely due to age. Dissipationless merging and metallicity variations at constant luminosity could also contribute to the scatter. We also see no evidence for increased scatter in the colours of galaxies at the bright end of the C-M relation.
Our results can be compared to those derived from high-resolution optical images of RDCS J1252.9-2927 that were taken with the Advanced Camera for Surveys on the Hubble Space Telescope in the F775W and F850LP filters. BFP find a tight C-M relation in the versus C-M diagram, and they show that neither the slope of this C-M relation nor the scatter about it have evolved from to . This concurs with the findings of this paper.
Using instantaneous, single-burst, solar-metallicity models, the average age of the bulk of the stars in the center of the cluster is 2.7 Gyrs. This corresponds to a formation redshift of . If the scatter about the CM relation is due to age, most of the galaxies in the center of this cluster were formed between and .
Acknowledgements.
This work would not have been possible without the dedicated efforts of ESO staff, both in Chile and Europe. We are grateful to Dr. Tadayuki Kodama for providing us with a copy of his models. We’d also like to thank Drs. Gustavo Bruzual and Stephane Charlot for providing us with a copy of their stellar evolution models prior to publication. Part of this work was performed under the auspices of the U.S. Department of Energy by University of California, Lawrence Livermore National Laboratory under contract No. W-7405-Eng-48.References
- (1) Aragón-Salamanca, A. et al. 1993, MNRAS, 262, 764
- (2) Bertin, E. & Arnouts, S. 1996, A&AS, 117, 393
- (3) Bouwens. R. J. et al. 2003, ApJ, in press
- (4) Bower, R. G. et al. 1992, MNRAS, 254, 601.
- (5) Bower, R. G. et al. 1998, MNRAS, 299, 1193
- (6) Blakeslee, J. P. et al. 2003, ApJ, in press (astro-ph/0309036) (BFP)
- (7) Bruzual, G. & Charlot, S. 2003, MNRAS, in press
- (8) Carpenter, J. M. 2001, AJ, 121, 2581
- (9) Cole, S. et al. 2000, MNRAS, 319, 168
- (10) Couch, W. J. et al. 1998, ApJ, 497, 188
- (11) De Propris, R. et al. 1998, AJ, 118, 719
- (12) Diaferio, A. et al. 2001, MNRAS, 323, 999.
- (13) Dressler, A. et al. 1997, ApJ, 1997, 490, 577
- (14) Eggen, O. et al. 1962, ApJ, 136, 748
- (15) Ellis, R. S. et al. 1997, ApJ, 483, 582
- (16) Hawarden, T. G. et al. 2001, MNRAS, 325, 563
- (17) Faber, S. M. 1973, ApJ, 179, 731
- (18) Ferreras, I. & Slik, J. 2000, ApJ, 532, 193.
- (19) Kauffmann, G. & Charlot, S. 1998, MNRAS, 294, 705
- (20) Kodama, T. & Arimoto, N. 1997, A&A, 320, 41
- (21) Labbé, I. et al. 2003, ApJ, 125, 1107
- (22) Massarotti, M. et al. 2003, A&A, 404, 75
- (23) Moorwood, A. et al. 1998, ESO Messenger, 91, 9
- (24) Moorwood, A. et al. 1999, ESO Messenger, 95, 1
- (25) Nakata, F. et al. 2001, PASJ, 53, 1139
- (26) Pearce, F. R. et al. 2001, MNRAS, 326, 649
- (27) Persson, S. E. et al. 1998, AJ, 116, 2475
- (28) Rosati, P. et al. 1998, ApJ, 492, L21
- (29) Rosati, P. et al. 1999, AJ, 118, 76
- (30) Rosati, P. et al. 2003, ApJ, in press (astro-ph/0309546)
- (31) Stanford, S. A. et al. 1998, ApJ, 492, 461 (SED)
- (32) Stanford, S. A. et al. 2002, AJ, 123, 619
- (33) Toft, S. et al. 2003, MNRAS, in press (astro-ph/0303066)
- (34) Treu, T. 2003, The Formation of Early-Type Galaxies: Observations to z=1. To appear in Clusters of Galaxies: Probes of Cosmological Structure and Galaxy Evolution, ed. J. S. Mulchaey, A. Dressler, & A. Oemler, Carnegie Observatories Astrophysics Series, vol 3 (astro-ph/0307281)
- (35) Treu, T. et al. 2002, ApJ, 564, L13.
- (36) Treu, T. et al. 2003, ApJ, 591, 53
- (37) van Dokkum, P. G., & Franx, M. 2001, ApJ, 553, 90
- (38) van Dokkum, P. G. & Stanford, S. 2003, ApJ, 585, 78
- (39) van Dokkum, P. G. & Ellis, R. S. 2003, ApJ, 595, L53.
- (40) van Dokkum, P. G. et al. 1998, ApJ, 504, L17
- (41) van Dokkum, P. G. et al. 1999, ApJ, 520, L95
- (42) van Dokkum, P. G. et al. 2000, ApJ, 541, 95
- (43) van Dokkum, P. G. et al. 2001, ApJ, 552, L101
- (44) Willis, J. P. et al. 2002, MNRAS, 337, 953.