00 \Year0000 \Month00 \Pagespan000000 \lhead[0]A.N. Author: Title \rhead[Astron. Nachr./AN XXX (200X) X]0 \headnoteAstron. Nachr./AN 32X (200X) X, XXX–XXX
Science Verification Results from PMAS
Abstract
PMAS, the Potsdam Multi-Aperture Spectrophotometer, is a new integral field instrument which was commissioned at the Calar Alto 3.5m Telescope in May 2001. We report on results obtained from a science verification run in October 2001. We present observations of the low-metallicity blue compact dwarf galaxy SBS0335-052, the ultra-luminous X-ray Source X-1 in the Holmberg II galaxy, the quadruple gravitational lens system Q2237+0305 (the “Einstein Cross”), the Galactic planetary nebula NGC7027, and extragalactic planetary nebulae in M31. PMAS is now available as a common user instrument at Calar Alto Observatory.
keywords:
Integral Field Spectroscopy - Spectrophotometrymmroth@aip.de
1 Introduction
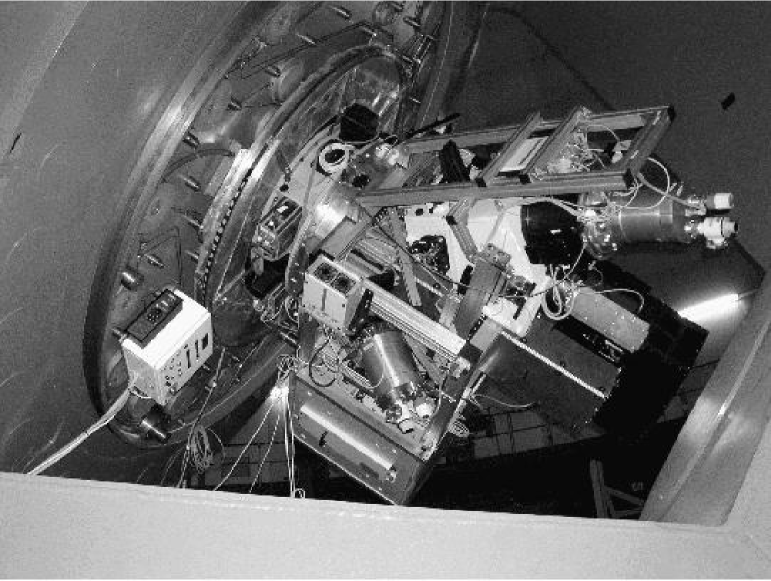
PMAS111http://www.aip.de/groups/opti/pmas/OptI_pmas.html is a dedicated 3D instrument with a 1616 square element IFU (0.5 arcsec pitch), fiber-coupled to a fully refractive fiber spectrograph, which is based on CaF2 lenses and has good response in the blue. It is currently equipped with a 2K4K thinned CCD (SITe ST002A), providing 2048 spectral bins. A 22K4K mosaic CCD, which was commissioned 2003, increases the free spectral range to 4096 spectral bins. The present fiber bundle has been conservatively manufactured with 100m diameter, high OH- doped fibers for good UV transmission. A future upgrade with 50-60m diameter fibers is intended to replace the existing IFU with a 3232 element array. A unique feature of PMAS is the internal A&G camera, equipped with a LN2-cooled, blue-sensitive SITe TK1024 CCD, giving images with a scale of 0.2 arcsec/pixel and a FOV of 3.43.4 arcmin2. The camera can be used with various broad-band and narrow-band filters. For a more detailed description, see Roth et al. 2000a and Kelz et al. 2003. After First Light in May 2001, a Science Verification run was conducted at the Calar Alto 3.5m Telescope in October 2001. Since then the instrument is available at this telescope as a common user instrument. In this paper, we describe our first results from the Science Verification observations. We selected targets with well-known properties from the literature in order to assess whether PMAS is capable of reproducing these data.
2 SBS0335-052
The blue compact dwarf galaxy SBS0335-052 is the second most metal-poor known galaxy after I Zw18, and thus an interesting target for spectrophotometric observations. Its oxygen abundance is 41 times lower than solar. It is thought to contain 6 embedded star clusters with a significant number of supermassive stars of around 100 solar masses (Thuan et al. 1997). The intense far UV radiation of those stars leads to high excitation ionization of the associated H II regions, showing electron temperatures as high as 25000 K. The emission line spectrum of this galaxy has been studied sufficiently well in the literature, providing a good test case for the PMAS science verification observations.
We observed SBS0335-052 on October 25, 2001, using the V600 grating, which yields a reciprocal dispersion of 0.8 Å/pixel. In the 22 binned readout mode of the spectrograph CCD, which was used throughout this campaign, the dispersion was thus 1.6 Å/bin. The spectral resolution was 3.3 Å FWHM. The grating angle was set to cover a wavelength range of 3600–5200 Å. We took 7 exposures of 900sec each over a range in airmass of 1.691.35. The conditions were non-photometric with a seeing of about 1.5arcsec FWHM.
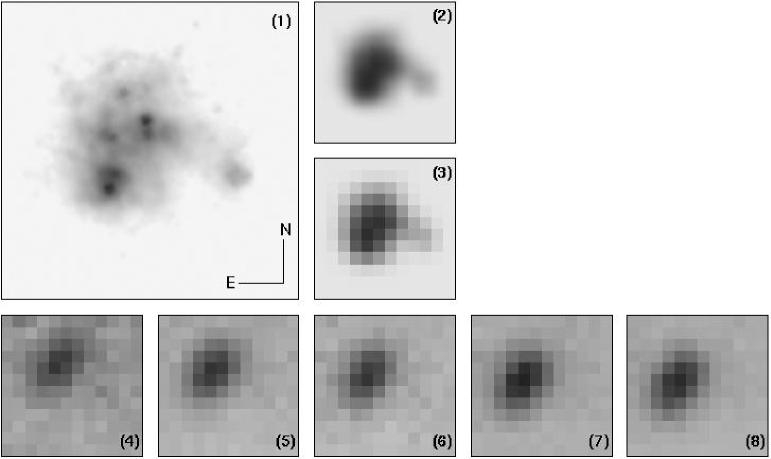
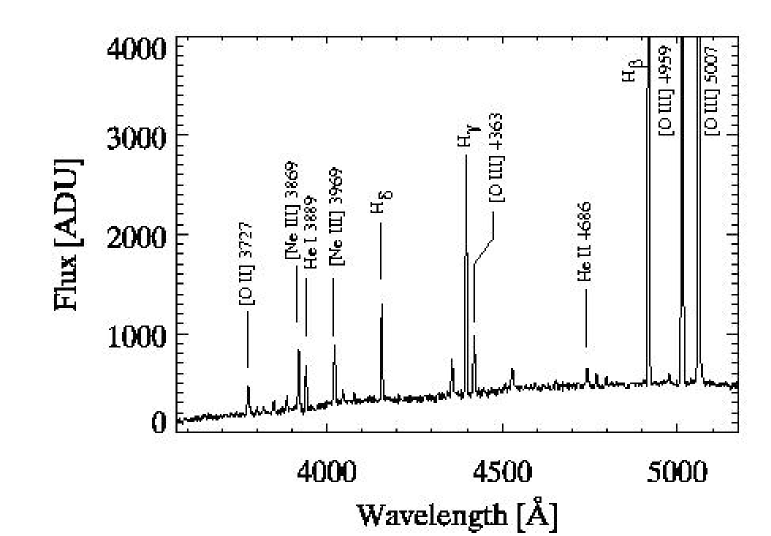
Fig. 2 shows the comparison of a direct HST WFPC2 image with several monochromatic maps and the continuum. The spectrum in Fig. 3 was created from the combined datacube by defining a digital aperture and co-adding a total of 62 spatial elements (”spaxels”) within this aperture, each measuring 0.5 x 0.5 arcsec squared. The roughly elliptical aperture was adapted to the elongated region of significant surface brightness along the NW direction. The spectrum shows a rich emission line spectrum, including the Balmer series, the forbidden lines of [O III] 5007,4959 and [O III] 4363, [O II] 3727,3729, He I 3889, and He II 4686, in good agreement with the spectra published by Melnick et al. (1992).
3 Holmberg II X-1
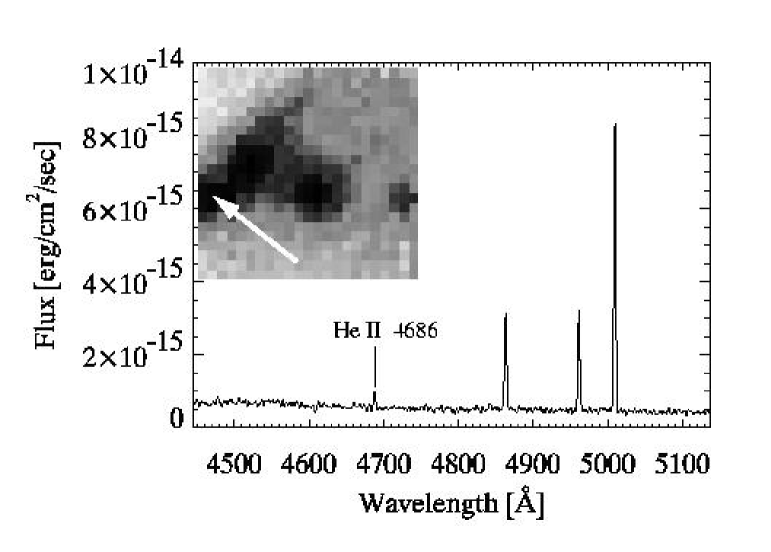
The ultraluminous X-ray source Holmberg II X-1 (1040erg, assuming D=3.2 Mpc) is one of the X-ray brightest objects in the vicinity of the Milky Way. Zezas et al. (1999) have analyzed this source from ROSAT PSPC and HRI data, finding a variable point source near the compact H II region #70 (Hodge et al. 1994). [Pakull & Mirioni (2002)] have reported the discovery of high excitation He II 4686 Å emission which they attributed to the optical counterpart of HoII X-1. We observed this object on October 28, 2001, using the V1200 grating, which provided a spectral resolution of 1.4 Å FWHM and a wavelength coverage of 4450–5150 Å. In accord with the results of [Pakull & Mirioni (2002)], we obtain maps in [O III] 5007 Å, [O III] 4959 Å, and Hβ, and the spectrum is shown in Fig. 4. The He II emission is constrained to a region to the left of the insert map, coinciding with a Chandra detection of Holmberg II X-1 within the error circle . The total flux in this emission line is 610-17erg/cm2/sec. There is also a hint of a faint continuum, increasing towards the blue. A more detailed analysis is presented by Lehmann et al. (in prep.).
4 Q2237+0305, the Einstein Cross
The Einstein Cross, Q2237+0305, is a prominent example for a gravitational lens system of a distant quasar, showing a quadruple appearance with an image separation of 2 arcsec. [Lewis et al. (1998)] used CCD photometry and spectroscopy of 2 epochs, separated by 3 years, to find evidence of microlensing from the foreground galaxy. Images at the WHT were obtained with 0.5 arcsec FWHM seeing, revealing a brightening of component A of 0.4 mag from 1991 to 1994. Data analysis of the spectroscopy presented peculiar problems related to differential atmospheric dispersion, but it was shown that the equivalent widths of C IV 1549 Å, C III] 1909 Å, and Mg II 2798 Å are substantially different between the four components, showing a drop by 30% for the C IV line from 1991 to 1994. [Mediavilla et al. (1998)] observed this object with INTEGRAL at WHT under sub-arcsec seeing conditions and reported the detection of an arc-like feature in C III] 1909 Å.
We observed Q2237+0305 on October 23 and 25, 2001, under less than ideal observing conditions. Unfortunately, the seeing was no better than 1.3-1.5 arcsec, such that the lens components were barely resolved. We used the V600 grating with a dispersion of 1.6 Å/bin, a spectral resolution of 3.3 Å FWHM, and a wavelength range of 3500–5200 Å. We took a total of 61800 sec exposures which turned out to be of varying quality.
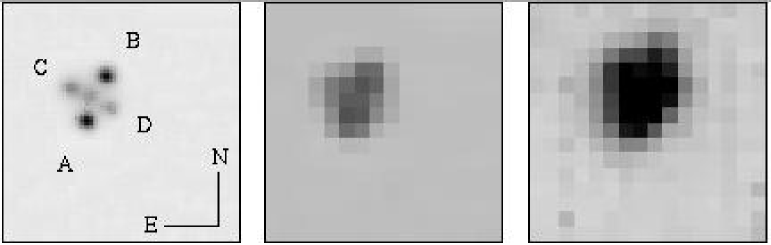
In Fig. 5 and Fig. 6 we show the results of a single 1800 sec exposure, selected for the best seeing conditions among those 6 frames. A map in C IV 1549 Å is shown in the right panel of Fig. 5, compared to the image provided by [Lewis & Irwin (1995)] (left) and the same image after convolution with 1 arcsec seeing and rebinning to the PMAS sampling scale of 0.5 arcsec (middle).
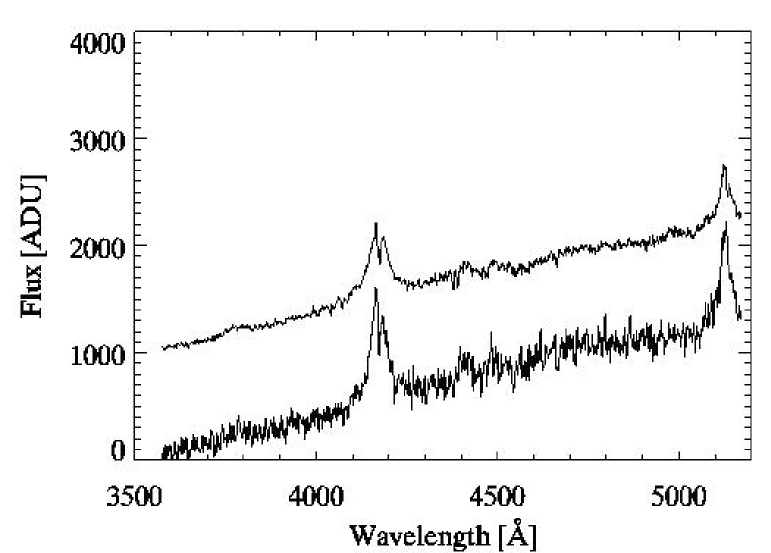
The spectra for components A (upper plot) and B (lower plot) were obtained by co-adding 33 visually selected spaxels around the assumed centroids with no further refinement of PSF fitting techniques. Sky correction was performed by coadding 45 spaxels from an annulus around the target and subtracting a scaled sky spectrum such that the sky lines vanished from the resulting spectrum. Spectra A and B were scaled to match their continuum, but no correction for instrumental response or flux calibration was applied. The plots in Fig. 6 are offset by 1000 ADU for clarity. As visible even to the eye, the equivalent widths of the two components differ as observed by [Lewis et al. (1998)]. Prompted by this result, new PMAS observations were targetted at several new lens systems, see [Wisotzki et al. (2003)], and Wisotzki et al. (these proceedings).
5 NGC7027
NGC7027 is a bright Galactic planetary nebula with a very rich emission line spectrum, and therefore an ideal target for instrumental tests and verification observations. We consulted the catalogue of PN emission line intensities of [Kaler(1976)], [Likkel & Aller (1986)], and [Keyes et al. (1990)] to compare our PMAS results with previously published data.
We observed this object on October 24, 2001, under relatively favourable seeing conditions of about 1 arcsec FWHM. The V600 grating was used (1.6 Å/bin, 3.3 Å FWHM resolution), and tilted to different angles, in order to cover the whole optical wavelength range. Below we show a blue spectrum to obtain a qualitative impression of the blue response, although at the chosen grating angle the efficiency is way down the blaze function, and the choice of one of the UV gratings would have been preferable for more serious work near the atmospheric cutoff. The exposure time for this observation was 120 sec.
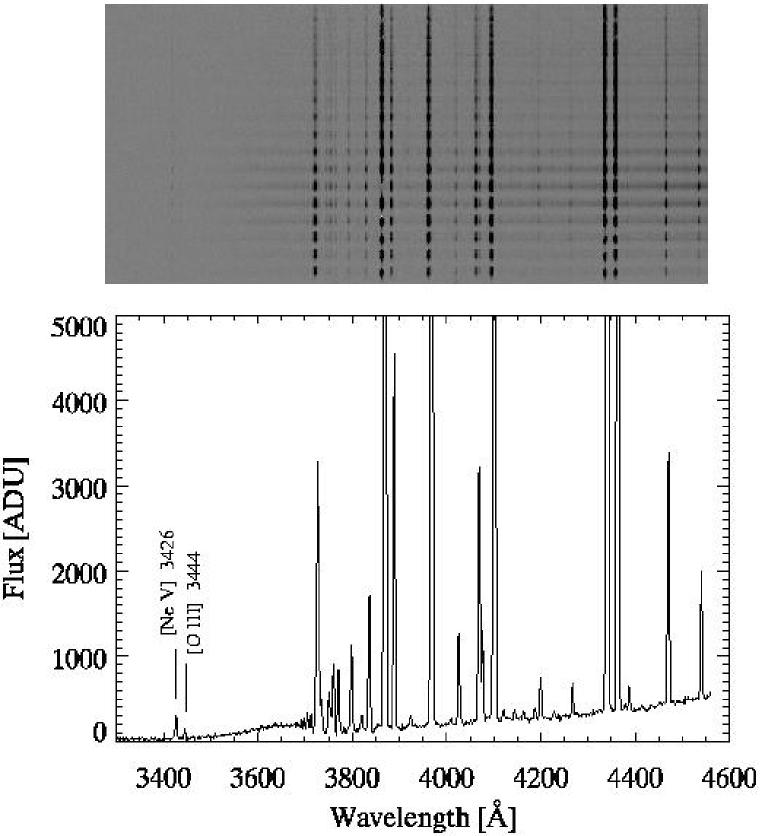
The top panel of Fig. 7 shows the fully reduced 256 spectra in a stacked 2D format, which has some advantages for the purpose of inspection and checking the data quality. The combined spectrum of 33 spaxels from the peak intensity region is plotted in the lower panel over the wavelength range of 3300–4550 Å. Below 3400 Å no useful signal was recorded.
The resulting spectrum shows a wealth of emission lines, superimposed on the very bright nebular continuum. We do not further discuss the spectrophotometry of these lines, but point out that [Ne V] and [O III] are visible at 3426 Å and 3444 Å, respectively, confirming that indeed the system has a non-negligible response in the UV – despite the less than ideal selection and setting of the grating.
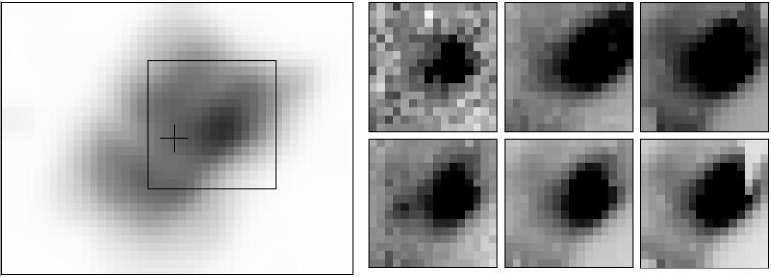
Fig. 8 shows a comparison of a direct image of NGC7027 with various pseudo-monochromatic maps, obtained from the datacube corresponding to Fig. 7. The left frame shows the HST image published by [Ciardullo et al. (1999)], rotated to the equatorial coordinate system and degraded to roughly 1 arcsec resolution as one might expect it from the ground. The square outlines the size of the 88 arcsec2 field-of-view of the PMAS IFU. The cross near the center of the field indicates the position of the central star, which is invisible in this degraded frame, but clearly stands out above the background in the original HST image. The six frames to the right show PMAS maps at the following wavelengths (from left to right, top to bottom): [Ne V] 3425, [O II] 3727, [O III] 4363, continuum 4500-4569 Å, Hβ, and Hγ (the artifact in the Hγ frame is due to saturation). The [Ne V] map is, to our knowledge, the first ground-based map obtained from a 3D datacube in the UV. Note that the continuum image, being uncontaminated from any emission line, clearly reveals the presence of the central star, which has been known to be difficult to detect with direct imaging from the ground (Jacoby 1988).
6 Planetary Nebulae in M31
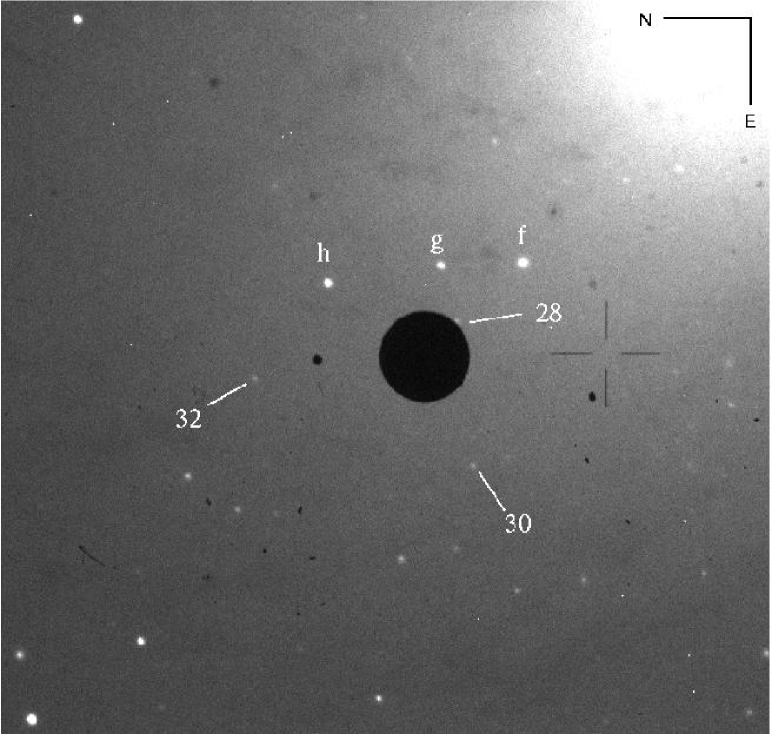
PMAS was designed and built specifically with the goal to develop the technique of crowded field spectroscopy, ana -logous to the now well-established method of crowded field CCD photometry. These techniques make extensive use of the property of images to exhibit a point-spread-function (PSF), which, if known, can be exploited for fitting blended stellar images in severly crowded fields. As a pilot study, we have started at Calar Alto a guaranteed observing time project on the subject of extragalactic planetary nebulae (XPN) in the local group (Roth et al. in prep.). As a peculiar technical detail, Fig. 9 shows the 3.43.4 arcmin2 FOV of the PMAS A&G Camera, equipped with a narrow-band [O III] filter. From a 2 min acquisition exposure, it is easily possible to identify XPN of typically m, which would otherwise be impossible to detect with any standard video TV system.
Acknowledgements.
We are indebted to G. Richter and the late V. Lipovetsky for paving our way into 3D spectroscopy. We were kindly introduced into this fascinating field by V. Afanasiev and S. Dodonov (Special Observatory for Astrophyics, Selentchuk). The development of PMAS would not have become a reality without the help of the ESO Optical Detector Team, allowing us to copy ESO-VLT detector head and CCD controller designs. The extensive support of ESO is gratefully acknowledged. The PMAS Team would like to thank Calar Alto staff for support during commissioning and operation. TB and AK acknowledge financial support of the German Verbundforschung under grants 05AL9BA1/9 and 05AE2BAA/4.References
- [Ciardullo et al. (1999)] Ciardullo, R. et al. 1999, AJ, 118, 488
- [Hodge et al.(1994)] Hodge, P., Strobel, N. V., & Kennicutt, R. C. 1994, PASP, 106, 309
- [Jacoby(1988)] Jacoby, G. H. 1988, ApJ, 333, 193
- [Kaler(1976)] Kaler, J. B. 1976, ApJS, 31, 517
- [Kelz, Roth, & Becker (2003)] Kelz, A. et al. 2003, SPIE, 4841, 1057
- [Keyes et al. (1990)] Keyes, C. D., Aller, L. H., & Feibelman, W. A. 1990, PASP, 102, 59
- [Lewis et al. (1998)] Lewis, G.F. et al. 1998, MNRAS, 295, 573
- [Likkel & Aller (1986)] Likkel, L. & Aller, L. H. 1986, ApJ, 301, 825
- [Mediavilla et al. (1998)] Mediavilla, E. et al. 1998, ApJ, 503, L27
- [Melnick et al. (1992)] Melnick, J. et al. 1992, A&A, 253, 16
- [Pakull & Mirioni (2002)] Pakull, M.W., Mirioni, L. 2002, astro/ph 0202488
- [Roth et al. (2000)] Roth, M. M. et al. 2000a, SPIE, 4008, 277
- [Thuan et al. (1997)] Thuan, T.X., Izotov, Y., Lipovetsky, V. 1997, ApJ, 477, 661
-
[Lewis & Irwin (1995)]
Lewis, G., Irwin,M. 1995,
http://antwrp.gsfc.nasa.gov/apod/ap950711.html - [Wisotzki et al. (2003)] Wisotzki, L. et al. 2003, A&A 408, 455
- [Zezas et al. (1999)] Zezas, A. L. et al. 1999, MNRAS, 308, 302