11email: Cristina.Popescu@mpi-hd.mpg.de
11email: Richard.Tuffs@mpi-hd.mpg.de 22institutetext: Research Associate, The Astronomical Institute of the Romanian Academy, Str. Cuţitul de Argint 5, Bucharest, Romania 33institutetext: University of Crete, Physics Department, P.O. Box 2208, 710 03 Heraklion, Crete, Greece 44institutetext: Foundation for Research and Technology-Hellas, 71110 Heraklion, Crete, Greece 55institutetext: NASA/IPAC Extragalactic Database, 770 S. Wilson Avenue, Pasadena, California 91125, USA 66institutetext: The Observatories of the Carnegie Institution of Washington, 813 Santa Barbara Str., Pasadena, 91101 California, USA
Far Infrared mapping of NGC 891††thanks: Based on observations with the Infrared Space Observatory (ISO), an ESA project with instruments funded by ESA member states (especially the PI countries: France, Germany, the Netherlands, and the United Kingdom) and with the participation of ISAS and NASA.
We present deep maps of dust emission from the edge-on spiral galaxy NGC 891, obtained with the ISOPHOT instrument on board the Infrared Space Observatory in broad band filters with reference wavelengths centered on 170 and 200 m. Using new processing methods to remove the effects of detector transients from the data, we detect cold dust at high dynamic range. The observed surface brightness distribution and colour profile of the far-infrared (FIR) emission are found to be in good agreement with predictions for their counterparts derived from the model of Popescu et al. (2000a). Thus, NGC 891 is the first galaxy for which an intrinsic distribution of dust and stars could be found which simultaneously accounts for both the optical/near-IR and FIR morphologies.
Key Words.:
galaxies: individual: NGC 891, galaxies: spiral, galaxies: structure, ISM: dust, infrared: continuum, radiative transfer1 Introduction
NGC 891 is one of the most extensively observed and studied edge-on spiral galaxy in the nearby universe. At a distance of 9.5 Mpc (van der Kruit & Searle 1981), it has been classified as an Sb galaxy by Sandage (1961) and is often quoted to be very similar to our own Galaxy. However it has also some unusual characteristics. For example NGC 891 contains one of the most spectacular layers of extraplanar diffuse ionised gas (DIG) (Dettmar 1990; Rand et al. 1990; Keppel et al. 1991; Pildis et al. 1994; Rand 1997, 1998; Hoopes et al. 1999; Howk & Savage 2000, Otte et al. 2001). The galaxy also has a radio continuum halo (Allen et al. 1978; Hummel et al. 1991), an HI halo (Swaters et al. 1997) and an X-ray halo (Bregman & Pildis 1994; Bregman & Houck 1997).
The disk of NGC 891 is a strong source of both CO and 13CO emission (Sofue et al. 1987, García-Burillo et al. 1992) and the global distribution and kinematics of molecular gas have been investigated by Handa et al. (1992), Scoville et al. (1993), García-Burillo & Guélin (1995), Sakamoto et al. (1997). The first extragalactic direct detection of large-scale molecular hydrogen was established in the disk of NGC 891 (Valentijn & van der Werf 1999), based on observations with the Short-Wavelength Spectrometer (SWS) instrument aboard the Infrared Space Observatory (ISO). The spectrum of the unidentified infrared (UIR) emission bands between 5.9 and 11.7 m has been also observed for the first time in the disk of an external galaxy in NGC 891 (Mattila et al. 1999), using the low-resolution spectrometer of the ISOPHOT instrument aboard ISO. The mapping of the Unidentified Infrared Bands emitted by NGC 891 was also done with the ISOCAM instrument on board ISO (Le Coupanec et al. 1999).
| Field | Filter | TDT1 | Map Centre (J2000) | PA2 | Map Sampling | Background | |||
|---|---|---|---|---|---|---|---|---|---|
| RA | DEC | Y x Z3 | ISO | COBE | |||||
| deg | arcsec | arcsec | MJy/sr | MJy/sr | |||||
| Centre | C160 | 65600207 | 02 22 33.03 | +42 20 55.5 | 148.82 | 30.66 | 46.00 | - | - |
| South | C160 | 61100404 | 02 22 11.47 | +42 12 04.3 | 168.68 | 30.66 | 31.00 | 11.25 | 9.17 |
| North1 | C160 | 65600403 | 02 22 54.79 | +42 29 48.5 | 148.79 | 30.66 | 91.97 | 11.65 | 8.68 |
| North2 | C160 | 80802313 | 02 22 54.79 | +42 29 48.5 | 341.63 | 30.66 | 91.99 | 12.75 | 10.26 |
| Centre | C200 | 65600207 | 02 22 33.03 | +42 20 55.5 | 148.83 | 30.66 | 46.00 | - | - |
| South | C200 | 61100404 | 02 22 11.47 | +42 12 04.4 | 168.73 | 30.67 | 31.00 | 4.87 | 8.13 |
| North1 | C200 | 65600403 | 02 22 54.79 | +42 29 48.5 | 148.79 | 30.67 | 91.99 | 6.54 | 7.72 |
| North2 | C200 | 80802313 | 02 22 54.79 | +42 29 48.5 | 341.64 | 30.66 | 92.00 | 7.45 | 9.01 |
1 Target Dedicated Time identifier. The first three digits give the
orbit identifier, which is also the epoch of the observation in days after
November 17th 1995.
2 positive Y direction (the direction of the chopper sweep), degrees E
from N
3 spacecraft coordinates
The distribution of the cold dust in NGC 891 has been observed at submillimeter(submm)/millimeter(mm) wavelengths using the IRAM 30 m telescope (Guélin et al. 1993) and the Submillimeter Common-User Bolometer Array (SCUBA) at the James Clerk Maxwell Telescope (JCMT)(Alton et al. 1998; Israel et al. 1999). The deep SCUBA maps revealed dust emission over 2/3 of the optical disk, but did not shed light on the existence of an extraplanar dust emission (Alton et al. 2000). Large amount of cold dust ( K) was found in the disk (Alton et al. 1998) - an order of magnitude more than the amount of warm dust detected by Wainscoat et al. (1987) using the Infrared Astronomical Satellite (IRAS).
However, the peak of the spectral energy distribution (SED) from cold dust, lying at the long far-infrared (FIR) wavelengths, is outside the wavelength coverage of IRAS, and thus has not been readily accessible until recently. With a wavelength coverage extending to 240 m and a superior intrinsic sensitivity as compared to IRAS, the ISOPHOT instrument (Lemke et al. 1996) on board ISO (Kessler et al. 1996) was the first to directly measure the peak of the FIR SED for a number of nearby galaxies (Tuffs et al. 1996 for NGC 6946, Haas et al. 1998 for M 31, Wilke et al. 2003 for the SMC, Hippelein et al. 2003 for M 33), for smaller statistical samples (Krügel et al. 1998; Siebenmorgen et al. 1999; Contursi et al. 2001), for the ISOPHOT Virgo Cluster Deep Sample (Tuffs et al. 2002a,b; Popescu et al. 2002; Popescu & Tuffs 2002a) and for the sample of Bright Revised Shapley Ames galaxies (Bendo et al. 2002, 2003).
Here we used the dedicated mapping mode P32 (Tuffs & Gabriel 2003) of ISOPHOT to obtain deep maps of NGC 891 at 170 and 200 m wavelengths. These data, taken at the peak of the SED from cold dust, provide a precise measurement of the stellar light re-radiated by grains in NGC 891. They also allow cold dust to be probed in regions of low surface brightness, such as the disk periphery and halo of NGC 891, regions which are currently inaccessible to submm facilities. When combined with the higher column density presented by the edge-on orientation, the ISOPHOT observations of NGC 891 have the capability of tracing cold dust to higher galactic radii. Thus, the goals of this study are: 1) to derive flux densities at longer FIR wavelengths, and thereby to directly measure the peak of the FIR SED in NGC 891; 2) to measure the physical extent of the dust disk and in particular to search deep for a cold dust counterpart to the extended HI disk; 3) to search for cold extraplanar FIR emission; 4) to compare the brightness and colour profile of the dust disk with predictions from the three dimensional model of stellar and dust distributions in NGC 891 proposed by Popescu et al. (2000a). This paper concentrates on the 1st, 2nd, and 4th goals, while the search for a dust counterpart to the extended HI disk is presented in Popescu & Tuffs (2003). In Sect. 2 we present the observations and data reduction, including the derivation of the integrated flux densities from the maps. In Sect. 3 we give a detailed comparison between the data and the model predictions for NGC 891. Some implications of this comparison are discussed in Sect. 4. A summary is given in Sect. 5.
2 Observations and data reduction
The observations were made using the ISOPHOT-C200 2 pixel array in the C160 and C200 filters111We warn the reader that the name of the C160 filter does not correspond to the central wavelength, unlike the case of the C200 filter., which respectively cover passbands of and and have central wavelengths of 170 and 200 m. The “P32” mapping mode was used to provide near Nyquist sampling over a large area encompassing the optical galaxy and the extended HI disk, as well as the surrounding background. The HI disk extends arcmin from the nucleus in the southern half of the galaxy and arcmin in the northern half (Swaters et al. 1997). In order to cover the whole southern field, and also to have a symmetrical map, a field of radius arcmin ( kpc) was mapped along the major axis of the galaxy.
A total of 19,000 seconds were spent in three overlapping fields: north, south and central. Due to scheduling constraints, the coverage of the northern field was made in two shorter overlapping observations at each wavelength. Thus, 4 maps were made at each wavelength. The parameters of each of these observations are summarised in Table 1. Part of these data sets have been presented by Popescu & Tuffs (2002b), Tuffs & Popescu (2003) and by Dupac et al. (2003).
The data for each observation were separately processed using the latest P32 reduction package (Tuffs & Gabriel 2003), which corrects for the transient response of the detector pixels. This allowed high dynamic range maps to be constructed to levels of 1 percent of the peak disk brightness. A time-dependent flat-field correction was made for each map, by fitting a cubic function to the response of the detector pixels to the background. Calibration was made using V8.1 of the PHOT Interactive Analysis (PIA) Package (Gabriel et al. 1997). We emphasise that although the maps are oversampled, independent data contribute to each map pixel.
Finally, the maps were combined into a mosaic spanning half a degree parallel to the plane of the galaxy. To achieve a common photometric scale over all the fields, the northern and southern fields were first scaled to the background brightness found from colour-corrected COBE/DIRBE maps within a 1.5 degree radius circle of NGC 891, taking into account the temporal variation of the zodiacal light component of the background. Values of the observed ISO backgrounds and the COBE/DIRBE backgrounds to which they were scaled are given in Table 1. Scaling factors between the central field and the southern and northern fields were then calculated from source structure in the overlapping regions of the maps, and applied to the data of the central field as a linear interpolation in position between the overlapping regions. Finally, backgrounds were subtracted from the southern and northern fields, and a constant background from the central field such that the absolute rms discrepancy in the overlap regions was minimised.
Overall, the self consistency of the pixel responses to the backgrounds suggests a systematic uncertainty of 5 and 10 percent in the C160 and C200 filters, respectively. The random noise variations in the southern and northern regions of the mosaic are 0.1 and 0.2 MJy/sterad, respectively, some 1000 times fainter than the peak emission. Thus the maps are dynamic-range limited by the sidelobes of the beam response to the bright disk emission.
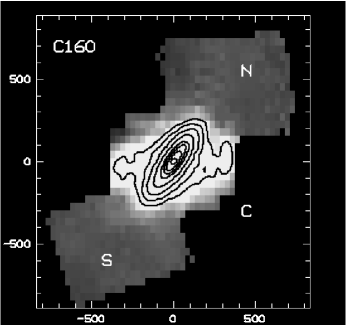
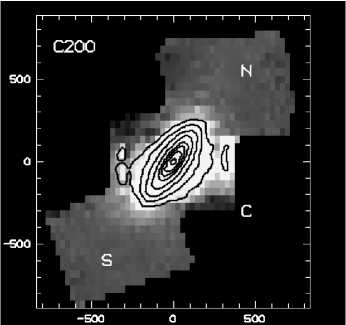
The derived mosaic maps at 170 and 200 m are shown in Fig. 1. The central field is dominated by the FIR emission from the optical disk of the galaxy. Fainter emission is seen out to at least the edge of the optical disk (360′′ from the nucleus). A detailed investigation of the FIR emission beyond the optical disk is presented in Popescu & Tuffs (2003). Another feature seen in the maps is a pair of wings (highlighted by the outer contours in Fig 1) separated from the nucleus by arcsec in the scan direction. The feature is more prominent at 170 m than at 200 m. The alignment of this feature with the scan direction points to an instrumental origin. However a specific cause could not be identified and it cannot be completely ruled out that extraplanar emission has not been detected.
The integrated fluxes are given in Table 2, together with their uncertainties (), peak brightness () and the corresponding uncertainties () for both C160 and C200 maps. The last column represents an estimate of the systematic uncertainty in the detector responsivity derived from scatter of the response of the individual detector pixels to the background.
| filter | |||||
|---|---|---|---|---|---|
| Jy | Jy | MJy/sr | MJy/sr | ||
| C160 | 193 | 15 | 238.7 | 0.7 | 5 |
| C200 | 165 | 6 | 195.1 | 1.3 | 10 |
3 Comparison between the data and the model for the FIR emission of NGC 891
Especially because it is so well observed, but also because of its edge-on geometry, which allows the study of the vertical structure of the different stellar, dust and gas components, NGC 891 was chosen as a prototype since the study of van der Kruit & Searle (1981), Bahcall & Kylafis (1985) and Kylafis & Bahcall (1987). More recently, Xilouris et al. (1998, 1999) fitted the optical and NIR images of NGC 891 with simulated maps produced by radiative transfer calculations, in an attempt to derive the scale lengths and heights of the stellar and dust distributions. All these studies concentrated on modelling the optical appearance of NGC 891.
Popescu et al. (2000a) developed a modelling technique for the whole spectral energy distribution, from the UV to FIR and sub-mm, which was tested and also first applied to NGC 891. This model successfully reproduced the observed IRAS and sub-mm flux densities of NGC 891. Furthermore, it is the only model which makes direct predictions for the spatial distribution of the FIR emission. Before comparing the predictions of this model with the new ISOPHOT data, we review the main characteristics of the dust and stellar distributions in NGC 891, as derived from this model.
Both a diffuse component and a clumpy component associated with the star forming regions are calculated. The model for the diffuse component includes a consistent treatment of grain heating and emission, solves the radiation transfer problem for a finite disk and bulge, and self-consistently calculates the stochastic heating of grains placed in the resulting radiation field. Compared with the other self-consistent treatments of the UV/optical–FIR/submm SEDs our model is unique in that it analyses the surface brightness distribution of optical and NIR images to constrain the intrinsic distributions of the old stellar populations and associated dust (see also Misiriotis et al. 2001). The appearance of the optical/NIR images was produced in an iterative optimisation procedure using the technique for solving the radiation transfer equation for direct and multiply scattered light for arbitrary geometries by Kylafis & Bachall (1987). The calculation was done independently for a number of optical and NIR images, thus determining the extinction law for diffuse dust empirically.
The “young” stellar population was then determined primarily from the FIR/submm data. The emissivity of the “young stellar disk” was parameterised in terms of the current star formation rate (). A second dust disk of grain mass was associated with the young stellar population. For the clumpy component a third primary parameter, , was introduced to denote the fraction of non-ionising UV which is locally absorbed in HII regions around the massive stars. These three parameters -, and - are sufficient to fully determine the FIR-submm SED, due to the precise constraints on the distribution of stellar emissivity in the optical-NIR and on the distribution and opacity of dust in the “old dust disk” yielded by the radiation transfer analysis of the highly resolved optical-NIR images, coupled with the simple treatment of the young stellar population and associated dust.
Comparison with IRAS and submm data yielded a best solution for NGC 891 with /yr, and . This corresponds to a disk central face-on opacity in the V band of and a non-ionising UV luminosity of W. The luminosity of the diffuse dust emission is W, which accounts for 69 of the total FIR luminosity, and the luminosity of dust in the clumpy component is W, making up the remaining 31 of the FIR luminosity.

3.1 The integrated FIR flux densities
The predicted FIR SED of NGC 891 is presented in Fig. 2, together with the IRAS, SCUBA (Alton et al. 1998), IRAM (Guélin et al. 1993) and our ISOPHOT data. Both the model and the data were integrated only within , in order to match the SCUBA and the IRAS flux densities derived by Alton et al. (1998). At 170 and 200 m the integrated flux densities within are 166 and 144 Jy, respectively. Our model SED, derived and checked on IRAS and submm data by Popescu et al. (2000a), is found to be in excellent agreement with the ISOPHOT flux densities as well.
3.2 The FIR maps
A more stringent test of the model is to compare its predictions for the morphology of the dust emission with the observed morphology. For this purpose simulated FIR maps were produced using the actual pointing data to scan the diffuse disk model. The model map was then convolved with empirical PSFs derived from point source measurements. The comparison between the observed maps at 170 and 200 m (Fig. 3a and 3b, respectively) and the simulated maps at the same wavelengths (Fig. 3c and 3d, respectively) show a remarkable agreement. To search for small differences between the model and the observations, not detectable in the maps due to the high dynamical range of the displayed data, we present in Fig. 3e and 3f the residual maps of the difference between the observed and the simulated maps at 170 and 200 m, respectively.
At 170 m, the main feature in the residuals is a localised, unresolved source in the northern side of the disk, with a peak of 52.3 MJy/sr. This localised source is probably a giant molecular cloud complex - associated with one of the spiral arms, and not considered in the simulated map, which only includes the diffuse component of the model. At this FIR wavelength our model predicts an contribution from the star-forming complexes. The integration of the unresolved source gives a flux density of 13.6 Jy, which is of the total flux density. Furthermore a faint extended source is seen in the southern side of the galaxy, of 9.5 Jy integrated flux density. This makes another of the total integrated emission. Thus the faint localised sources seen in the residual maps sum up to of the total FIR emission. This is in reasonable agreement with the prediction of our model, which reassures us that the template used in our model and scaled according to our model parameters ( and the factor), is indeed a good representation for the galaxy. Apart from the two sources, a faint extended halo (at brightness level) is seen extending at large heights perpendicular to the disk.
At 200 m, the residual map (Fig. 3f) shows the same localised sources present at 170 . This time the northern localised source has a flux density of 8.4 Jy (5.1 of the total emission) and the southern localised source has a flux density of 6.9 Jy (4.2). Overall the percentage contribution of both localised sources to the total flux density is smaller at 200 m than it is at 170 m, which means that the localised sources are warmer than the diffuse component. This is to be expected if we consider that the localised sources are associated with the HII regions, and thus consistent with the model of Popescu et al. (2000a).


3.3 The FIR averaged profiles


Another way to compare the predictions of the model with the data is to look at the averaged profiles, both in the radial and vertical direction. Firstly, profiles were produced from the observed maps and from the maps of the predicted diffuse emission (Fig. 3a,b,c,d), by integrating the flux parallel to the minor axis of the galaxy for each bin along the major axis. The resulting profiles, which we refer to as “radial profiles”, are given in Fig. 4a and 4b in the 170 and 200 m bands, respectively. Again, a good agreement between the data points and the model prediction is apparent at both wavelengths. Centred at +100 arcsec there is an excess emission in the observed profile with respect to the predicted one, which is due to the localised source in the northern half of the galaxy, already identified in the residual maps (Fig. 3e,f). This asymmetry is also seen in the 850 m map of Alton et al. (1998) and in the 1300 m map of Guélin et al. (1993). Likewise, the fainter localised source in the southern half of the galaxy manifests itself through the excess observed emission seen around -150 arcsec radius. At both wavelengths there is some faint emission apparent in the observed profile extending beyond the edge of the optical disk (360 arcsec). This emission is considered in Popescu & Tuffs (2003).
Similar to the construction of the radial profiles, profiles perpendicular to the major axis of the galaxy were calculated by integrating the flux parallel to the major axis of the galaxy for each bin along the minor axis. The resulting profiles, which we refer to as “vertical profiles”, are given in Fig. 4c,d. As expected, the predicted disk emission is unresolved by ISOPHOT, and therefore the predicted profile coincides with the beam profile. The observed profile is also unresolved up to arcsec, which corresponds to a factor of 10 in dynamic range. At larger heights above the disk there is some faint diffuse emission (at a level of a few percent of the peak brightness) in excess of the model predictions for the disk. We have already discussed in Sect. 2 that this emission may be of an instrumental nature, although a detection of extraplanar emission cannot be discounted completely. Such an emission may be expected to arise from dust grains carried out by a gentle wind, as described in Popescu et al. (2000b).
The measured and predicted radial colour profiles 200/170 are plotted in Fig. 4e. The predicted profile has a smooth progression towards colder emission with increasing radial distance. The measured profile broadly follows this prediction, although there may be evidence for a tendency for a flatter profile within . The larger error bars on the data points beyond +200 arcsec are due to the lower brightness of the 170 m outer disk on the northern side.
4 Discussion
At the wavelength of the ISOPHOT measurements presented here the model for NGC 891 predicts that the bulk of the FIR dust emission is from the diffuse component. The close agreement between the data and the model predictions, both in integrated flux densities, but especially in terms of the spatial distribution, constitutes a strong evidence that the large scale distribution of stellar emissivity and dust predicted by the model is in fact a good representation of NGC 891. In turn, this supports the prediction of the model that the dust emission in NGC 891 is predominantly powered by UV photons.
Depending on the FIR/submm wavelength, the UV powered dust emission arises in different proportions from within the clumpy component and from the diffuse component. For example at 60 m, 61 of the FIR emission is powered by UV photons locally absorbed in star forming complexes, 19 by diffuse UV photons in the weak radiation fields in the outer disk (where stochastic emission predominates), and 20 by diffuse optical photons in high energy densities in the inner part of the disk and bulge. At 100 m there are approximately equal contributions from the diffuse UV, diffuse optical and locally absorbed UV photons. At 170, 200 m and submm wavelengths, most of the dust emission in NGC 891 is powered by the diffuse UV photons. So our analysis does not support the preconception that the weakly heated cold dust (including the dust emitting near the peak of the SED sampled by the ISOPHOT measurements presented here) should be predominantly powered by optical rather than UV photons. The reason is as follows: the coldest grains are those which are in weaker radiation fields, either in the outer optically thin regions of the disk, or because they are shielded from radiation by optical depth effects. In the first situation the absorption probabilities of photons are controlled by the optical properties of the grains, so the UV photons will dominate the heating. The second situation arises for dust associated with the young stellar population, where the UV emissivity far exceeds the optical emissivity.
5 Summary
Here we have presented deep FIR maps of the edge-on spiral galaxy NGC 891, obtained with the ISOPHOT instrument on board ISO. The observations were done near the peak of the FIR SED, namely at 170 and 200 m. Both the integrated flux densities and the surface brightness distributions obtained from our ISOPHOT maps were found to be in excellent agreement with the predictions of the model for the optical/FIR/submm SED of NGC 891 of Popescu et al. (2000a). Furthermore, the model distribution of emitters and absorbers in NGC 891 is able to reproduce both the observed optical/NIR images and the FIR maps. NGC 891 is the first galaxy for which an intrinsic distribution of dust and stars was derived under such strong observational constraints.
Acknowledgements.
We would like to thank the anonymous referee for his useful comments and suggestions.References
- (1) Allen R.J., Baldwin J.E., Sancisi R., 1978, A&A 62, 397
- (2) Alton P.B., Bianchi S., Rand R. J., Xilouris, E. M., Davies, J. I. et al. 1998, ApJ 507, L125
- (3) Alton P.B., Xilouris E.M., Bianchi S., Davies, J. & Kylafis, N. 2000, A&A 356, 795
- (4) Bahcall, J. N. & Kylafis, N. D. 1985, ApJ, 288, 252
- (5) Bendo, G. J., Joseph, R. D., Wells, M., Gallais, P., Haas, M. et al. 2002, AJ 123, 3067
- (6) Bendo, G. J., Joseph, R. D., Wells, M., Gallais, P., Haas, M. et al. 2003, AJ 125, 2361
- (7) Bregman, J. N. & Pildis, R. A. 1994, ApJ, 420, 570
- (8) Bregman, J. N. & Houck, J. C. 1997, ApJ, 485, 159
- (9) Bruzual & Charlot 1993, ApJ, 405, 538
- (10) Contursi, A., Boselli, A., Gavazzi, G., Bertagna, E., Tuffs, R., et al. 2001, A&A, 365, 11
- (11) Dettmar R.-J., 1990, A&A 232, L15
- (12) Dupac, X., del Burgo, C., Bernard, J.-P, Giard, M., Lamarre, J.-M. et al. 2003, MNRAS 344, 105
- (13) Gabriel, C., Acosta-Pulido, J., Heinrichsen, I., Morris, H., & Tai, W.-M. in: Astronomical Data Analysis Software and Systems VI, A.S.P. Conference Series, Vol. 125, 1997, Gareth Hunt and H. E. Payne, eds., p. 108
- (14) García-Burillo, S. & Guélin, M. 1995, A&A, 299, 657
- (15) García-Burillo, S., Guélin, M, Cernicharo, J. & Dahlem, M. 1992, A&A 266, 21
- (16) Guélin M., Zylka R., Mezger P. G., Haslam C. G. T., Kreysa E., et al. 1993, A&A, 279, L37
- (17) Haas, M., Lemke, D., Stickel, M., Hippelein, H., Kunkel, M., et al. 1998, A&A, 338, L33
- (18) Handa, T., Sofue, Y., Ikeuchi, S., Kawabe, R., & Ishizuki, S. 1992, PASJ, 44, L227
- (19) Hippelein, H., Haas, M., Tuffs, R.J., Lemke, D., Stickel, M. et al. 2003, A&A 407, 137
- (20) Hoopes C.G., Walterbos R.A.M., Rand R.J., 1999, ApJ 522, 669
- (21) Howk J.C., Savage, B.D., 2000, AJ, 119, 644
- (22) Hummel E., Dahlem E., van der Hulst J.M., Sukumar S., 1991, A&A 246, 10
- (23) Israel, F. P., van der Werf, P P. & Tilanus, R. P. -J. 1999, A&A, 344, L83
- (24) Keppel, J W., Dettmar, R.-J, Gallagher, J. S., & Roberts, M. S. 1991, ApJ, 374, 507
- (25) Kessler, M. F., Steinz, J. A., Anderegg, M. E., Clavel, J., Drechsel, G., et al. 1996, A&A, 315, 27
- (26) Kylafis, N. D., & Bahcall, J. N. 1987, ApJ, 317, 637
- (27) Krügel, E., Siebenmorgen, R., Zota, V., & Chini, R. 1998, A&A, 331, L9
- (28) Lemke, D., Klaas, U., Abolins, J., Ábráham, P., Acosta-Pulido, J., et al. 1996, A&A, 315, L64
- (29) Le Coupanec, P., Rouan, D., Gallais, P., Léger, A., Giard, M. et al. 1999, in “The Universe as seen by ISO”, Eds. P. Cox & M. F. Kessler, ESA-SP 427
- (30) Mattila, K., Lehtinen, K. & Lemke, D. 1999, A&A 342, 643
- (31) Misiriotis A., Popescu, C. C., Tuffs, R. J., & Kylafis, N. D. 2000, A&A, 372, 775
- (32) Otte, B., Reynolds, R. J., Gallagher III, J. S. & Ferguson, A. M. N. 2001, ApJ 560, 207
- (33) Pildis, R. A., Bregman, J. N., & Schombert, J. M. 1994, ApJ 423, 190
- (34) Popescu, C.C., & Tuffs, R.J. 2002a, MNRAS 335, L41
- (35) Popescu, C.C., & Tuffs, R.J. 2002b, in Reviews in Modern Astronomy, vol. 15, Edited by Reinhard E. Schielicke. Wiley, ISBN 352640404X, p. 239
- (36) Popescu, C.C & Tuffs, R.J. 2003, A&A Letters, in press
- (37) Popescu, C. C., Misiriotis A., Kylafis, N. D., Tuffs, R. J., Fischera, J., 2000a, A&A, 362, 138
- (38) Popescu, C. C., Tuffs, R. J., Fischera, J., & Völk, H. 2000b, A&A, 354, 480
- (39) Popescu, C.C., Tuffs, R.J., Völk, H.J., Pierini, D., Madore, B.F. 2002, ApJ, 567, 221
- (40) Rand, R. J. 1997, ApJ, 474, 129
- (41) Rand, R. J. 1998, ApJ, 501, 137
- (42) Rand R.J., Kulkarni S.R., Hester J.J., 1990, ApJ 352, 1
- (43) Sakamoto, S., Handa, T., Sofue, Y., Honma, M. & Sorai, K. 1997, ApJ, 475, 134
- (44) Sandage, A. 1961, The Hubble Atlas of Galaxies, p.25
- (45) Scoville, N. Z., Thakkar, D., Carlstrom, J. E. & Sargent, A. I. 1993, ApJ, 404, L59
- (46) Siebenmorgen, R., Krügel, E., & Chini, R. 1999, A&A, 351, 495
- (47) Sofue, Y., Nakai, N. & Handa, T. 1987, PASJ, 39, 47
- (48) Swaters, R. A., Sancisi, R. & van der Hulst, J. M. 1997, ApJ, 491, 140
- (49) Tuffs, R. J. & Popescu, C. C. 2003, in Proceedings of the Symposium “Exploiting the ISO Data Archive. Infrared Astronomy in the Internet Age”, held in Siguenza, Spain 24-27 June, 2002. Edited by C. Gry, S. Peschke, J. Matagne, P. Garcia-Lario, R. Lorente, & A. Salama. ESA SP-511. European Space Agency, p. 239.
- (50) Tuffs, R. J. & Gabriel, C. 2003, A&A, in press
- (51) Tuffs, R.J., Lemke, D., Xu, C., Davies, J. I., Gabriel, C., et al. 1996, A&A, 315, L149
- (52) Tuffs, R. J., Popescu, C. C., Pierini, D., Völk, H. J., Hippelein, H., et al. 2002a, ApJS, 139, 37
- (53) Tuffs, R. J., Popescu, C. C., Pierini, D., Völk, H. J., Hippelein, H., et al. 2002b, ApJS, 140, 609
- (54) Valentijn, E. A. & van der Werf, P. P. 1999, ApJ 522, L29
- (55) van der Kruit P.C., Searle L., 1981, A&A 95, 116
- (56) Wainscoat, R. J., de Jong, T., & Wesselius, P. R. 1987, A&A 181, 225
- (57) Wilke, K., Stickel, M., Haas, M., Herbstmeier, U., Klaas, U., et al. 2003, A&A 401, 873
- (58) Xilouris, E. M., Alton, P. B., Davies, J. I., Kylafis, N. D., Papamastorakis, J., et al., 1998, A&A, 331, 894
- (59) Xilouris, E. M., Byun, Y. I., Kylafis, N. D., Paleologou, E. V., Papamastorakis, J., 1999, A&A, 344, 868