An HST Search for Lyman Continuum Emission
From Galaxies at 1.1 z 1.4
Abstract
If enough of their Lyman limit continuum escapes, star-forming galaxies could be significant contributors to the cosmic background of ionizing photons. To investigate this possibility, we obtained the first deep imaging in the far ultraviolet of eleven bright blue galaxies at intermediate redshift (1.1 z 1.4) with the STIS FUV MAMA detector on the Hubble Space Telescope. No Lyman continuum emission was detected. Sensitive, model-independent, upper limits of typically 210-19 ergs cm-2 sec-1 Å-1 were obtained for the ionizing flux escaping from these normal galaxies. This corresponds to lower limits on the observed ratio of 1500 to 700 flux of 150 up to 1000. Based on a wide range of stellar synthesis models, this suggests that less than 6%, down to less than 1%, of the available ionizing flux emitted by hot stars is escaping these galaxies. The magnitude of this spectral break at the Lyman limit confirms that the basic premise of “Lyman break” searches for galaxies at high redshift can also be applied at intermediate redshifts. This implies that the integrated contribution of galaxies to the UV cosmic background at z 1.2 is less than 15%, and may be less than 2%.
Revised 4 August 2003
To Appear 1 December 2003
1 THE DIFFUSE IONIZING BACKGROUND
Blueward of the Lyman limit lies a wavelength region of great observational uncertainty and astrophysical significance. These far-UV photons control ionization of the interstellar and intergalactic media today, and at all times since recombination (Madau et al., 1999).
The origin of this UV radiation field that re-ionized the early Universe was considered by Sargent, Young, Boksenberg and Tytler (1980). Quasars are known to be strong contributors to the cosmic UV background, as their spectra show little intrinsic fall-off across the Lyman limit (e.g., Sun and Malkan (1989)). Bechtold, Weymann, Lin and Malkan (1987) calculated the diffuse ultraviolet radiation field using assumptions about the quasar luminosity function and the shape of the intrinsic UV spectrum of quasars. They also discussed the possibility that young galaxies could be significant contributors to the UV background.
In addition to measuring the Lyman continuum from sources directly, the strength of the UV background may be inferred using the “proximity effect” – the trend toward smaller number densities of Ly lines in a quasar absorption spectrum as one approaches the redshift of a background quasar. Using this method Bajtlik, Duncan and Ostriker (1988) calculated a larger UV background than the integrated emission of known quasars at z 3, requiring “appreciable sources of ionizing photons other than quasars”. Since quasars have a lower space density than galaxies, the ionizing photons from more uniformly distributed normal galaxies would set a floor on the fluctuations in the ionizing background radiation from one location to another.
A related method of estimating the UV background is by measurement of the Ly forest decrement as a function of redshift (Madau, 1995). Haardt and Madau (1996) pointed out that re-radiation from intergalactic absorption systems acts as sources, as well as sinks, of ionizing photons which affect the amplitude, shape, and fluctuations of the UV background. They find this stochastic reprocessing of quasar light appears to provide enough ionizing photons to account for the proximity effect at high redshifts.
1.1 Predicted Escape of Ionizing Photons from Normal Galaxies
Redward of the Lyman limit most of the diffuse cosmic UV radiation comes from the numerous normal galaxies, particularly those with high instantaneous star formation rates, e.g., Giallongo et al. (1997); Freyer and Hensler (1999). Blueward of the Lyman limit, the amount of ionizing photons from hot stars that escape normal galaxies is not well known on either theoretical or observational grounds. Locally it is poorly measured because of our inability to detect it through the HI absorption of the Milky Way. The intrinsic spectra of hot stars around the Lyman limit are also not accurately measured (Lanz and Hubeny, 2003). If even small amounts of radiation blueward of the Lyman limit escape from normal galaxies (e.g., 10% of their mid-UV flux), then (in aggregate) galaxies could still be the dominant source of the UV background (Sethi and Nath, 1997; Deharveng, Faisse, Milliard and Le Brun, 1997)
Researchers use the term “escape fraction” in several model-dependent ways. The most conceptually straightforward definition is the number of ionizing photons escaping the galaxy divided by the total number of ionizing photons emitted by stars within it, i.e., fesc = Nesc/Nemit. However, to avoid any dependence on models, the observed limit of 1500 to 900 Å flux is sometimes quoted, for comparison with the value which would be expected if all ionizing photons escaped.
Castellanos and Diaz (2002) used photoionization models of well studied extragalactic giant H II regions and predicted escape fractions of ionizing photons 10% fesc 73%. Ciardi, Bianchi and Ferrara (2002) used 3-D numerical simulations to predict escape fractions to be as high as 60% from Milky Way-like galaxies with high star formation rates. In a recent study of the influence of supershells and galactic outflows, Fujita et al. (2002) conclude that dwarf starburst galaxies may have played an important role in ionizing the universe at z 5 with total escape fractions fesc 20%.
The simple theoretical picture of a calm, uniform disk galaxy, fully shrouded in H I and opaque to ionizing photons, is unlikely to be realistic, particularly in the younger Universe. In the Milky Way, radio maps reveal large-scale bubbles and chimneys that appear to have been blasted through the interstellar gas of the disk by the combined effects of many supernovae and vigorous stellar winds (Heiles 1987; also in M82 Devine & Bally 1999). These evacuated or ionized holes may open up escape paths for ionizing photons heading out of the disk (Rozas, Zurita, Heller and Beckman, 1999; Kunth, Mas-Hesse, Terlevich, Terlevich, LeQueux and Fall, 1998). Detection of ionized gas well above the plane of the Milky Way (the “Reynolds layer” and the Magellanic Stream) has been interpreted as meaning that 5 - 10% of hydrogen ionizing photons escape from our own galaxy (Reynolds, 1985; Bland-Hawthorn and Maloney, 1999). It is also possible that the detection of strong ionized calcium absorption along most lines of sight through the Milky Way halo requires the escape of a substantial number of ionizing photons from the disk (Savage, 1988).
1.2 Previous FUV Observations of Galaxies
HUT obtained strong upper limits on the Lyman continuum escaping from 3 low-luminosity, low-redshift galaxies (and less sensitive observations of a fourth galaxy) (Leitherer, Ferguson, Heckman and Lowenthal, 1995). After correction for Milky way absorption, these observations translate into five- flux upper limits of F 410-15 ergs sec-1 cm-2 (Hurwitz, Jelinsky and Dixon, 1997; Ferguson, 2001). Based on models, the implied fraction of escaping Lyman continuum photons fesc 8 — 28% (five- upper limits). FUSE has produced a similarly strict flux upper limit (Deharveng, Buat, Le Brun, Milliard, Kunth, Shull and Gry, 2001), for Mkn 54 (z = 0.0448) with F 110-15 ergs sec-1 cm-2 . This can be converted into a five- upper limit to the ionizing escape fraction of 10%.
These results at low redshifts may not apply to earlier times when galaxies may have had higher UV luminosities and lower UV extinction. At higher redshifts, galaxies appear to be bluer and more disturbed (e.g., Williams et al. (1996)) suggesting the possibility that more of their Lyman continuum photons may have escaped at earlier cosmic times. Given the effects of intergalactic absorption, detecting these photons may become more difficult above . With the new generation of 10-meter class ground based telescopes one can now observe the rest frame Lyman continuum of galaxies at redshifts 3. Steidel, Pettini and Adelberger (2001, SPA) reported the detection of Lyman continuum flux in the composite spectrum of 29 Lyman break galaxies (LBGs) with = 3.4. Since the galaxies in their sample were drawn from the bluest quartile of LBG spectral energy distributions, they are likely to be younger and less dusty than their contemporaries. Nevertheless, if their measured ratio of rest frame flux density at 1500 to that in the Lyman continuum, Fν1500Å/Fν900Å = 4.6 1.0 were typical, then galaxies at z = 3 would produce about five times more H-ionizing photons per co-moving volume than would quasars. Given the difficulties of the observation and the uncertainties in the intervening medium, SPA describe these results as preliminary. Contradicting this result are the observations of Giallongo, Cristiani, D’Odorico and Fontana (2002) who failed to detect the Lyman continuuum in deep VLT observations of several of Steidel’s brightest Lyman break galaxies. In addition, Fernandez-Soto, Lanzetta and Chen (2003) observed 27 HDF galaxies at 1.9 z 3.5, and concluded that no more than 15% of the ionizing photons escaped. Whether or not one accepts the tentative Steidel detection of Lyman continnuum light from the brightest bluest galaxies at z 3, that does not settle the question of the emission of ionizing radiation from other types of galaxies, at other redshifts.
2 THE OBSERVATIONS
2.1 Object Selection
We searched the literature and the NASA/IPAC Extragalactic Database (NED) for all known (as of 1997) bright (B 23.0), non-active galaxies at spectroscopically confirmed redshifts in the range 1.1 z 1.7. The lower redshift bound was selected to put all emission redward of 912 out of our detection passband. The upper redshift limit was chosen to minimize the effects of intergalactic absorption. We further selected among the candidates based upon colors, choosing the bluest, brightest, galaxies, since the sensitivity of our search is directly proportional to the strength of the flux emitted just longward of the Lyman limit. We avoided all targets that might be active galaxies based upon the presence of high-ionization emission lines (e.g., other than [O II] at 3727). Because of the sharply decreasing numbers of spectroscopically confirmed galaxies as z increases towards 2, our brightest candidates were found in the redshift interval 1.1 z 1.4. Given the limited photometry available for most of these galaxies, they were in effect selected based upon their brightness in the shortest observed passband, be that U or B. Four CFRS galaxies were selected for their brightness in V, combined with their extremely blue V-I colors.
Our sample size of eleven was a compromise between examining a large enough number of sources to account for possible line-of-sight (LOS) variations and integrating long enough on each object to set very significant flux limits. Several different geometric possibilities exist by which normal galaxies could be significant cosmic contributors of ionizing photons: a) most galaxies emit Lyman continuum isotropically, but at a low level; b) most of them emit virtually no Lyman continuum photons except along a few, unusually clear lines-of-sight; or c) most of them emit virtually no Lyman continuum photons whatsoever, but a minority of special galaxies (e.g., irregular or disturbed galaxies) do emit. Deep integrations on only a few objects are required to detect the Lyman continuum in hypothesis a), while a broad survey of many galaxies, each of which samples one line-of-sight from Earth, is needed for testing hypotheses b) and c). Hence, we employed a combination of both “deep” and multiple “broad” observations, to test each of these possibilities. The targets we selected, their redshifts, our pointing coordinates, dates of observation, foreground 100 cirrus brightness, and exposure times are given in Table 1.
2.2 Description of the Observations
Observations were conducted with HST between October 2000 and October 2001. The targets were imaged with the Hubble Space Telescope (HST) using STIS with its FUV MAMA detector, under Guest Observer Program 8561. The field of view consists of 1024 x 1024 pixels of 0.0247 arcseconds each, spanning a total of 25 arcseconds. The longpass F25SRF2 filter was chosen to provide high throughput and strict rejection of sky background photons. Transmission is characterized by a sharp turn-on peak just short of 1300, which tapers off steadily until just past 1900, with a central wavelength of 1480. The CsI photocathode will not detect any light redward of the Lyman limit, in the target’s rest frame, because of the instrument’s steep cutoff at . Red leak is not a problem at the flux levels we are observing.
In measuring these faint sources it was important to account for and minimize the sources of background. The count rate from the MAMA dark current was predicted in the instrument handbook (www.stsci.edu/hst/stis/documents/handbooks/currentIHB/) to be 5 – 10 x 10-6 counts sec-1 pixel-1. The sky background we observed was small, typically 0.1 counts per 3000 seconds (somewhat higher than the dark current). Photon noise dominated the uncertainty in our measurements. Comparisons of the mean and standard deviations of counts per pixel in large and small blank sky regions were fully consistent with Poisson statistics, (N) = where N is the total number of background photons detected in an aperture.
Earthshine provided the dominant background. The background from the Earth in shadow was roughly two orders of magnitude less than the average background from the illuminated Earth. Observations were primarily conducted in the Earth’s shadow. Ten of the eleven galaxies were observed in “TIME-TAG” mode which records the arrival times of each individual photon. This information allowed us to optimize signal to noise ratio by excluding any data taken during periods of high background brightness (e.g., observations in the presence of the illuminated Earth). In TIME-TAG, the recorded photons are binned in high spatial resolution mode, where 2048 x 2048 pixels are each 0.01237 arcseconds wide. One galaxy, SSA 22-16, was observed in the ACCUM mode, in which all the photons over the entire 5598-second night-time portion of the orbits were included in the final image.
3 DATA ANALYSIS PROCEDURES AND PRODUCTS
3.1 Data Reduction
We identified the time periods of each exposure with the darkest backgrounds by first averaging the count rates (over the entire field-of-view) in intervals of 100 seconds. Typically, the period of minimum sky count rates, during the night-time portions of each orbit, persisted for about 2000 seconds. We then summed all the photons measured during those dark periods, using the inttag task in Version 2.11.3b of IRAF. These total “dark” integration times, listed in Table 1, ranged from 3500 up to 6300 seconds for different objects. The average count rates for dark sky background ranged from 0.032 to 0.15 counts second-1 pixel-1. On average, exclusion of the data taken with earthshine background, which was typically 25 - 40% of the total exposure time, improved the flux limit slightly (lowering it by approximately 25%).
Sensitivity variations across the FOV were corrected by dividing the images by standard flatfield calibration frames. As noted in the STIS manual, there are smooth but reproducible variations across the field. In our case those peaked at roughly a 15% increase in sensitivity near the upper left edge of the field. Photometry of possible sources was performed in circular apertures of different radii with standard sky subtraction. Counts were converted to fluxes as specified in the STIS instrument handbook at the rate of 1 count sec-1 corresponding to a flux of 4 x 10-17 ergs cm-2 sec-1.
As viewed at intermediate redshifts, the small angular size of galaxies concentrates their light on only a small number of FUV MAMA pixels. Available WFPC2 imagery for several of the normal galaxy targets indicates the typical FWHM 0.5 arc seconds (Lubin et al. 1998) or 21 FUV MAMA pixels in radius. To estimate the angular size of compact galaxies at redshift z 1, we used an archived WFPC2 image of the SSA22 field. Measurements of SSA22-16, SSA22-10 (a compact galaxy), and SSA22-20 (a relatively isolated object in the upper left of the image) gave us a half radius for compact galaxies of 5 FUV MAMA pixels, appropriate for marginally resolved objects close in angular size to the PSF of the camera. In what follows, we quote some results for the smaller angular size compact galaxies but, conservatively, our tables and flux limits are specified for normal-size galaxies at these redshifts.
3.2 Effects of the Intervening Medium on the Intrinsic Spectra
Unlike at higher-redshifts, the opacity of the intergalactic medium (IGM) is not significant at the redshifts we are observing. Quasar absorption features can be used to estimate the decrement due to H I absorption as a function of wavelength and redshift (Weymann et al., 1998; Impey et al., 1996; Madau, 1995). At z = 1.2 the Ly line density per unit redshift, normalized for rest EW = 0.24, is 35. Integrating over line equivalent width produces EW(integrated) 10 of absorption at a wavelength of 1200. Thus the resulting continuum flux decrement is 1%, negligible compared to our other sources of error, with Ly being the major opacity source. We note that the corresponding uncertainty in correcting for IGM absorption at a redshift of 3 is far larger, and seriously affects conclusions about escape of ionizing photons from galaxies at that high a redshift.
Corrections were made for the effects of Milky Way extinction. Using the IRSKY tool (www.ipac.caltech.edu/ipac/services/irsky.html) we computed the IR sky backgrounds for our target fields, and applied the scaling EB-V = 0.018 x I100μ(mJy/Sr) (Schlegel et al., 1998). The reddening for our target fields was then estimated based upon a standard Seaton Milky Way reddening law (Seaton, 1979) with a ratio of total to selective extinction, AV/EB-V = 3.
4 RESULTS
4.1 Inspection of the Final Images – Two Sources
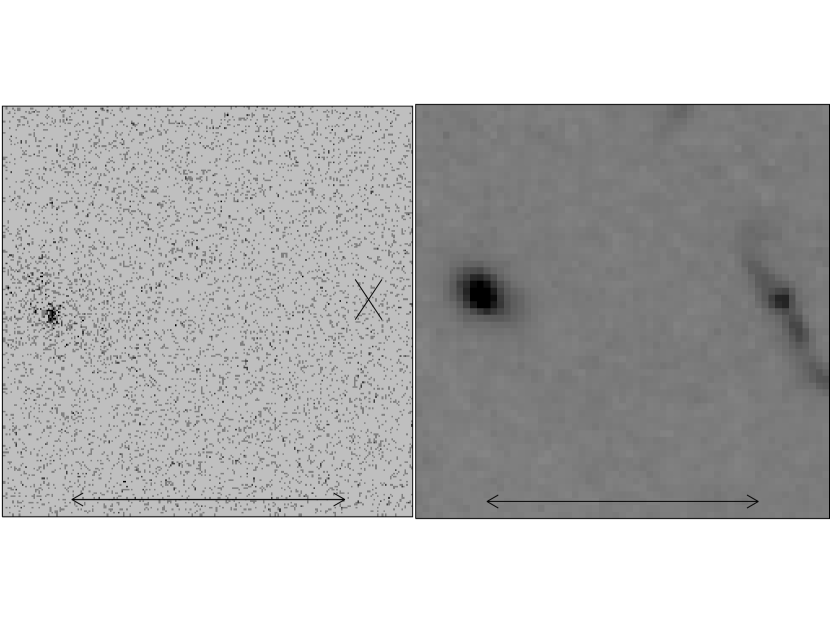
Examination of the eleven final images revealed that only two sources were detected – and neither was a target galaxy. Both were identified as lower-redshift galaxies in the fields of view of the higher-redshift galaxies. The first of these detections was in the ACCUM mode exposure targeted at SSA22-16, and appears to be SSA 22-10 at z = 0.132, located 4.5 arcseconds east (left in our image) of SSA 22-16. Figure 1 compares a WFPC2 visible image of SSA 22-16 and SSA 22-10 (right) with our STIS ultraviolet exposure of the same field (left). The images have a common plate scale (the arrows are 4.5 arcseconds long) and are both oriented with north at top. The lower redshift galaxy SSA 22-10 is visible in the UV but our targeted galaxy SSA 22-16 is not. After subtraction of a sky value of 0.1241 counts pixel-1, the image of SSA 22-10 contained 720 counts within an aperture of radius of 65 pixels. This corresponds to a flux level of 5 x 10-18 ergs cm-2 sec-1 -1 at 1650. This is about ten times brighter than its I-band measured flux of 5.4 x 10⁻¹⁹, making SSA 22-10 a bluish galaxy with Fλ -1.4.
A second source was detected in the image targeted at HDF-IW4-1002.1353. The source appeared in the lower left corner of the frame, and is believed to be the optically faint, X-ray source J123627.2 +621308, and is located 0.3 arcseconds east and 12.8 arcseconds north of the target. The net counts from this object were determined to be 293 at a radius of 50 pixels and a sky value of 0.15. This corresponds to 3 x 10-18 ergs cm-2 sec-1 -1, or about 30 times its I-band flux of 10-19. This suggests an inverse wavelength squared dependence in Fλ, or a flat spectrum in Fν, probably from a quasar.
We compared the radial growth of the number of counts in the two detected sources with each other and with WFPC2 images we had on hand of our targeted intermediate-redshift galaxies. We used these observed profiles to estimate how the FUV light from our target galaxies should have been distributed spatially to better estimate our upper limits. The two sources had quite similar curves of growth, with half of the counts contained within a radius of 20 pixels. Not unexpectedly, the light is less concentrated in the centers of our detected sources than it is in the WFPC2 images of our targeted intermediate-redshift galaxies.
4.2 New Lyman Continuum Flux Upper Limits for Galaxies
No Lyman continuum light was detected from any of our eleven targeted sources, setting new flux upper limits on the potential contributions to the UV background from normal galaxies at 1.1 z 1.4. The first column of Table 2 contains our dereddened (first row) and observed (second row) upper bounds on the Lyman continuum flux for normal-size galaxies at these intermediate redshifts. Sizing the apertures accordingly (the flux limit scales linearly with the aperture diameter), those flux upper limits are .005 - .015 10-30 ergs cm-2 sec-1 Hz-1 for compact galaxies and .03 - .10 10-30 ergs cm-2 sec-1 Hz-1 for normal-size galaxies. These findings apply to the observed flux levels, and are independent of model assumptions that predict the actual fraction of Lyman limit photons that escape from normal galaxies.
4.3 Co-Adding the Images to Lower the Detection Threshold
If one assumes that all the candidate sources are similar and that they are emitting isotropically, one can combine our measured upper limits into a single statistical result for these intermediate-redshift blue galaxies. For this test, all 10 TIME-TAG images were added together to search for weak flux from the composite of all target measurements. Information on pointing error for STIS was not available, but was determined for WFPC2 to be 0.86 arc seconds. This error, combined with the uncertainty in the positional coordinates, means one can only coregister these images to on the order of a typical normal galaxy diameter at these redshifts. In fact, a couple of marginally significant signals were detected in the co-added image, but these were not at the center of the FOV where the galaxies were targeted. They were off-center and appear to be low-level blemishes in the STIS camera. One of the apparent peaks in counts, centered around pixel [476,718], is present in the same location in about half of the TIME-TAG images (of different sources), and is therefore clearly not a cosmic source. Closer to the center of the FOV, where the targets were centered, at pixel [506,576] is another blemish. It appears at the same pixel location on several different target frames, and subsequent photometry showed the signal, even in a generously sized aperture, to be less than a three-sigma departure from the sky level. Assuming adequate co-registration of these 10 frames, the upper limit on FUV flux from the targets in this composite image, with total integration time of 42,400 seconds, is about 2.3 times as sensitive as in individual fields and produces a flux upper limit 10-20 ergs cm-2 sec-1 -1.
4.4 Observed Spectral Energy Distributions - The Fλ<912Å / Fλ>912Å Lyman Break
Internal to the galaxy, O and B stars produce a flux of Lyman continuum photons, only a small fraction of which are likely to escape into the IGM. At the edge of the galaxy, we refer to the flux immediately shortward of the Lyman continuum, as F, and immediately longward of the Lyman continuum, as F. In the spectra of galaxies, the discontinuity or “break” between these values is caused by the enormous optical depth of neutral hydrogen in the interstellar medium. Fluxes on both sides of the Lyman continuum limit are reddened to the observer, by dust internal to the source galaxy, our Milky Way, and by passage through the IGM, resulting in observed fluxes, immediately above and below the Lyman continuum, of Fλ<912Å and Fλ>912Å. Published UBVRI-band photometry of the galaxies observed here establishes their baseline continuum strength and shape (in the rest frame mid-UV). Photometric errors are not quoted in the literature for these objects (Tamura et al, 2001; Lilly, Cowie and Garner, 1991; Cowie, Songaila and Hu, 1996). We have assumed 10% photometric errors, and made the height of the symbols in Figure 2 equal to this range of uncertainty. The strength of the dereddened F/F break is shown in the spectral energy distributions (SEDs) of these objects (Figure 2).
The actual escape fraction of photons that leak out of a galaxy is dependent upon, among other not well-determined things, the spectral shapes and internal reddenings of the sources. One previous formulation (e.g., SPA) is in terms of observed quantities as a relative escape fraction, f 3. x Fν,1500Å/Fν,900Å. One then uses observations of the Fν,1500Å/Fν,900Å ratio, in a model-independent way, to specify the relative escape fraction. At high redshift, one should also include any flux decrement from 1500 to 900 due to the IGM. The factor of 3 arises in the definition from the anticipated intrinsic drop in flux from 1500 to 900, which depends upon assumptions about the IMF and stellar ages. We investigated this dependence over a range of Bruzual-Charlot stellar synthesis models (Bruzual and Charlot, 1993), in which the galaxy originally formed at z 10. The simulations included cases with both older (z 1.8), and more recent but smaller, starbursts (z 1.4 - 1.7). These starbursts, of duration one gigayear, produced all the O and B stars. Figure 2 includes two of these models, one blue and red, at two flux levels which bracket most of our data. They provide a reasonable match to the published photometry for most of our target galaxies, and demonstrate the insensitivity of the Lyman continuum levels to model choices. Two extreme stellar population models were generated, using the Bruzual Charlot 1995 code. In both models, the original stellar population is assumed to have formed early, at a redshift of 10. Then a second burst of star formation starts at z=1.6. Both bursts are described by the BC95 1 Gyr constant star formation rate model, with an assumed Salpeter IMF. No internal reddening has been added. Adding any reddening to the model would have resulted in an even younger intrinsic stellar population, which would have relatively stronger Lyman limit emission than in the models in Figure 2.
The galaxy model is observed at our typical redshift of 1.3. For the H=75 open cosmology assumed, this means that the starburst has been going on for about 0.6 Gyr at the time of the observation. Models without ongoing star formation do not reproduce the relatively strong, flat UV continua of these luminous blue galaxies. Aside from arbitrary vertical luminosity normalizations, the two models we plot differ in the fraction of the galaxy mass incorporated into the second, more recent star formation episode. The redder model has 2% of the total galaxy mass in the z=1.6 starburst. The bluer model (heavier line) has equal mass in the young and the old stellar components. For clarity, two plots of each model are shown, separated by 0.4 dex. This approximately brackets the range of brightnesses and colors of our target galaxies. These two models do not provide a complete search of all the possible range of parameter space for stellar synthesis models. Nonetheless, they cover wide enough extremes to give a good idea of what the far-UV slope in our program galaxies is likely to be. Note that in spite of enormous differences between the weak- and strong-burst models at visible wavelengths, they are very similar in the far-UV. This is because in both cases the observed far-UV continuum is dominated by the same population of the hottest, youngest main sequence stars.
If one assumes an intrinsic flux density drop Fν,1500Å/Fν,900Å 3, and given that we have no flux decrement from the IGM at these redshifts, our typical observed limits would imply a relative escape fraction f 0.3%. While the intrinsic flux density ratio Fν,1500Å/Fν,900Å is typically a factor of 3, it can range from 2.5 to 5.5 and beyond. The first column of Table 2 contains our dereddened measurements of the upper bounds on Lyman continuum flux (detection limits) for normal size galaxies at these intermediate redshifts. To match the observed SED’s of our target galaxies, we conservatively chose an intrinsic flux density ratio Fν,1500Å/Fν,900Å 10, in the middle of the range recommended by Leitherer and Heckman (1995), resulting in a typical limit of f 1%.
5 DISCUSSION
5.1 Validation of the Lyman Break Method
The Lyman break technique is the most powerful photometric method known for identifying galaxies at high-redshift. It is based on the absorption of their Lyman limit emission as the unique identifying signature which separates them from the much larger foreground population of galaxies (Steidel and Hamilton, 1992). Especially at the lower redshifts, intergalactic absorption is not the only source of this effect. One also assumes that the intrinsic spectrum of the star-forming galaxy drops substantially blueward of its Lyman limit, due to heavy internal H I absorption (Madau, 1995). Even with near zero IGM absorption, our observations confirm that the intrinsic Lyman limit drop in the spectra of blue galaxies is at least 3 to 4 magnitudes. Even if the Lyman break occupies only a small part of the total filter bandwidth (e.g., objects at z 2 observed in the U filter), it will be detectable in typical Lyman break photometric color searches.
5.2 The Contribution of Galaxies at 1.1 z 1.4 to the UV Radiation Field
We used our observed flux upper limits and the Bruzual Charlot models111The intrinsic spectra of hot stars around the Lyman limit are not well measured. The recent EUVE detection of CMa at 500-700 (Cassinelli, J. P. et al., 1996) revealed a factor of 20 times more ionizing luminosity than had been predicted by current stellar atmosphere models (which underestimated the importance of non-LTE effects). to estimate a co-moving emissivity, following Madau (1995; 1997). In this intermediate redshift range, where the cosmic emissivity from galaxies is peaking, one predicts an intrinsic emissivity from all galaxies of 6.26 x 1025 ergs sec-1 Hz-1 Mpc-3 at our measurement rest wavelength of approximately 700. Since less than 1 to 6% of this luminosity escapes the galaxy at this wavelength, we find the co-moving emissivity from galaxies at intermediate redshfits (z 1.2) to be less than 4 x 1024 down to 6 x 10²³ erg sec-1 Hz-1 Mpc-3, depending on which end of the escape limit range applies.
Haardt and Madau (1996) quote a volume emissivity from quasars near the H I ionization edge of 3 x 1025 ergs sec-1 Hz-1 Mpc-3 at z 1.2. At intermediate redshifts, our new Lyman continuum upper limits suggests that galaxies make up less than 15%, and possibly less than 2%, of the cosmic ultraviolet background. While less than 1–6% of the ionizing flux escaped from these bluest of galaxies, it is possible that this upper limit will be even lower for the general population of galaxies at 1.1 z 1.4.
5.3 Comparison of Our Flux Upper Limits with the Literature
SPA remains the only reported detection of Lyman continuum from galaxies, albeit at z 3 - 4, with f 50%. We do not detect the same effect for intermediate redshift galaxies, where we find f 1%. It remains possible that at higher redshifts, higher star formation rates occuring on global scales produce interstellar media that may leak ionizing radiation. In addition, as was pointed out by Heckman et al. (2001), the Lyman Break Galaxy composite spectrum employed by SPA showed signs of outflow in the 400 to 500 km sec-1 blueshifted interstellar absorption lines. Such outflows may be a necessary signature of galaxies leaking ionizing radiation, but we do not know how strong such a signature is in our target galaxies.
Giallongo, Cristiani, D’Odorico and Fontana (2002) point out that the escape fraction for ionizing photons reported by SPA would allow the galaxies alone to produce a cosmic ultraviolet background flux which exceeds the predictions of the proximity effect from the Ly forests of quasars. If, however, galaxies at redshifts of 2 or 3 behave similarly to the galaxies we measured at z 1.2, galaxies would contribute less than 20% as much ultraviolet light as would quasars, and the flux estimates from both sources would be consistent with the predictions of the proximity effect.
6 CONCLUSIONS
Based on observations of eleven bright blue galaxies with redshifts 1.1 z 1.4, no Lyman continuum was detected. A stringent, model-independent, upper limit 210-19 ergs cm-2 sec-1 was obtained for the FUV flux escaping from eleven normal galaxies at redshifts of 1.1 z 1.4. Given reasonable assumptions about the FUV flux from these galaxies, based on Bruzual-Charlot models, this represents less than 6%, down to less than 1%, of their intrinsic ionizing flux. This corresponds to a relative escape fraction, f 1%. The magnitude of this decline confirms the basic premise of “Lyman break” searches for galaxies at intermediate redshifts. The integrated contribution of galaxies to the total UV radiation field at z 1.2 is inferred to be less than 20%, and may well be less than 2%.
References
- Bajtlik, Duncan and Ostriker (1988) Bajtlik, S., Duncan, R., and Ostriker, J. 1988, ApJ, 327, 570
- Bechtold, Weymann, Lin and Malkan (1987) Bechtold, J., Weymann, R.J., Lin, Z., and Malkan, M.A. 1987, ApJ, 315, 180
- Bland-Hawthorn and Maloney (1999) Bland-Hawthorn, J. and Maloney, P. R. 1999, ApJ, 510, 33
- Brinchmann et al. (1998) Brinchmann, J. and 11 co-authors 1998, ApJ, 499, 112
- Bruzual and Charlot (1993) Bruzual, A. G. and Charlot, S. 1993, ApJ, 405, 538
- Cassinelli, J. P. et al. (1996) Cassinelli, J.P et al. 1996, ApJ, 460, 949
- Castellanos and Diaz (2002) Castellanos, M. and Diaz, A. 2002, ApJ, 565, L79
- Ciardi, Bianchi and Ferrara (2002) Ciardi, B., Bianchi, S. and Ferrara, A. 2002, MNRAS, 331, 463
- Cowie, Songaila and Hu (1996) Cowie, L., Songaila, A. and Hu, E. 1996, AJ112, 839
- Deharveng, Faisse, Milliard and Le Brun (1997) Deharveng, J.-M., Faisse, S., Milliard, B. and Le Brun, V. 1997, A&A, 325, 1263
- Deharveng, Buat, Le Brun, Milliard, Kunth, Shull and Gry (2001) Deharveng, J.-M., Buat, V., Le Brun, B., Milliard, B., Kunth, D., Shull, J. M. and Gry, C. 2001, A&A, 375, 805
- Devine and Bally (1999) Devine, D. and Bally, J. 1999, ApJ, 510, 197
- Fernandez-Soto, Lanzetta and Chen (2003) Fernandez-Soto, A., Lanzetta, K. M. and Chen, H. -W. 2003, MNRAS, 342, 1215
- Ferguson (2001) Ferguson, H.C. 2001, private communication
- Freyer and Hensler (1999) Freyer, T. and Hensler, G. 1999, AGM 15, 51
- Fujita et al. (2002) Fujita, A., Martin, C., Low, M. and Abel, T. 2002, astro-ph/0208278
- Giallongo, Cristiani, D’Odorico and Fontana (2002) Giallongo, E., Cristiani, S., D’Odorico, S. and Fontana, A. 2002, ApJ, 568, L9
- Giallongo et al. (1997) Giallongo, E., Fontana, A., and Madau, P. 1997, MNRAS, 289, 629
- Glazebrook, Ellis, Colless, Broadhurst, Allington-Smith and Tanvir (1995) Glazebrook, K., Ellis, R., Colless, M., Broadhurst, T., Allington-Smith, J. and Tanvir, N. 1995, MNRAS, 273, 157
- Guzman et al. (1997) Guzman, R., Gallego, J., Koo, D., Phillips, A., Lowenthal, J., Faber, S., Illingworth, G. and Vogt., N. 1997, ApJ, 489, 559
- Haardt and Madau (1996) Haardt, F. and Madau, P. 1996, ApJ, 461, 20
- Hammer, Crampton, Le Fevre and Lilly (1995) Hammer, F., Crampton, D., Le Fevre, O. and Lilly, S. 1995, ApJ, 455, 88
- Hammer et al. (1997) Hammer, F., Flores, H., Lilly, S., Crampton, D., Le Fevre, O., Rola, C., Mallen-Ornelas, G., Schade, D. and Tresse, L. 1997, ApJ, 481, 49
- Heckman et al. (2001) Heckman, T. et al. 2001, ApJ, 558, 56
- Heiles (1987) Heiles, C. 1987, ApJ, 315, 555
- Hurwitz, Jelinsky and Dixon (1997) Hurwitz, M., Jelinksy, P. and Dixon, W. 1997, ApJ, 481, L31
- Impey et al. (1996) Impey, C., Malkan, M., Webb, W. and Petry, C. 1996, ApJ, 463, 473
- Kunth, Mas-Hesse, Terlevich, Terlevich, LeQueux and Fall (1998) Kunth, D., Mas-Hesse, J. M., Terlevich, E., Terlevich, R., LeQueux, J. and Fall, S. M. 1998, A&A, 334, 11
- Lanz and Hubeny (2003) Lanz, T. and Hubeny, I. 2003, ApJS, 146, 417
- Le Fevre, Crampton, Lilly, Hammer and Tresse (1995) Le Fevre, O., Crampton, D., Lilly, S., Hammer, F. and Tresse, L. 1995, ApJ, 455, 60
- Leitherer, Ferguson, Heckman and Lowenthal (1995) Leitherer, C., Ferguson, H.C., Heckman, T.M., and Lowenthal, J.D. 1995, ApJ, 454, 19
- Leitherer and Heckman (1995) Leitherer, C. and Heckman, T. M. 1995, ApJS, 96, 9
- Lilly, Cowie and Garner (1991) Lilly, S., Cowie, L. and Gardner, J. 1991 ApJ369, 79 (LCG)
- Lilly, Hammer, Le Fevre and Crampton (1995) Lilly, S., Hammer, F., Le Fevre, O. and Crampton, D. 1995, ApJ, 455, 75
- Lubin et al. (1998) Lubin, L. et al. 1998, AJ, 116, 584L
- Madau et al. (1999) Madau, P. et al. 1999, ApJ, 514, 648
- Madau et al. (1996) Madau, P., Ferguson, H.C., Dickinson, M.E., Giavalisco, M., Steidel, C.C. and Fruchter, A. 1996, MNRAS, 283, 1388
- Madau (1995) Madau, P. 1995, ApJ, 441, 18
- Madau (1997) Madau, P. 1997, in Star Formation Near and Far: Seventh Astrophysics Conference, eds. S. Holt and L. Mundy; Woodbury, NY AIP Press, p. 481
- Postman, Lubin, and Oke (1998) Postman, M., Lubin, L. and Oke, J. 1998, AJ, 116, 560
- Reynolds (1985) Reynolds, R.J. 1985 in Gaseous Halos of Galaxies, ed J. Bregman and F. Lockman (Green Bank: NRAO) p. 53
- Rozas, Zurita, Heller and Beckman (1999) Rozas, M., Zurita, A., Heller, C. H. and Beckman, J. E. 1999, A&A, 135, 145
- Sargent, Young, Boksenberg and Tytler (1980) Sargent, W., Young, P., Boksenberg, A. and Tytler, D. 1980, ApJS, 42, 41
- Savage (1988) Savage, B. 1988 in QSO Absorption Lines: Probing the Universe; Proceedings of the QSO Absorption Line Meeting, Baltimore, MD, May 19-21, 1987,eds. J Blades, D. Turnshek and C. Norman, Cambridge and New York, Cambridge University Press, 1988, p. 195-223
- Seaton (1979) Seaton, M. 1979, MNRAS, 187, 73
- Schlegel et al. (1998) Schlegel, D., Finkbeiner, D. and Davis, M. 1998, ApJ, 500, 525
- Sethi and Nath (1997) Sethi, S. and Nath, B. 1997, MNRAS, 289, 634
- Steidel and Hamilton (1992) Steidel, C.C. and Hamilton, D. 1992, AJ, 104, 941
- Steidel et al. (2001) Steidel, C.C., Pettini, M. and Adelberger, K. L. 2001, ApJ, 546, 665 (SPA)
- Steidel (2002) Steidel, C.C. 2002, private communication
- Sun and Malkan (1989) Sun, W. and Malkan, M. 1989, ApJ, 346, 68
- Tamura et al (2001) Tamura, N., Ohta, K., Maihara, T., Iwamuro, F., Motohara, K., Takata, T., and Iye, M. 2001, PASJ, 53, 653
- Weymann et al. (1998) Weymann, R. et al. 1998, ApJ, 506, 1
- Williams et al. (1996) Williams, R. and 16 co-authors 1996, AJ, 112, 1335

| Galaxy | Redshift | Observation | Exposure | Galactic Bckgnd. | |
|---|---|---|---|---|---|
| z | Date | Time | @ 100 | ||
| 2000 | (MJD) aaDates are given in Modified Julian Days (MJD, the Julian Date minus 2400000.5). | (seconds) | (MegaJy/Sr) | ||
| Cl J0023+0423: | 1.10740 | 00 23 51.00 | 51861.22 | 4000 | 2.5 |
| [LPO98a] 022 | 04 23 00.00 bbPosition is known to within 5 arcseconds – well within the field of view of the FUV MAMA detecrtors. | ||||
| CFRS 03.1140 | 1.18180 | 03 02 53.85 | 52199.04 | 6300 | 5.7 |
| 00 13 04.00 | |||||
| CFRS 10.1887 | 1.2370 | 10 00 23.89 | 51970.04 | 5700 | 2.8 |
| 25 18 12.00 | |||||
| CFRS 10.0239 | 1.29190 | 10 00 40.24 | 51970.98 | 3700 | 2.8 |
| 25 11 05.00 | |||||
| CFRS 10.1168 | 1.15920 | 10 00 42.09 | 51972.65 | 3500 | 2.8 |
| 25 14 41.00 | |||||
| LDSS2 10.288 | 1.108 | 10 46 32.85 | 52022.91 | 3900 | 3.7 |
| -00 11 41.60 | |||||
| HDF:iw4 | 1.221 | 12 36 27.24 | 51928.87 | 3700 | 0. |
| 1002 1353 | 62 12 58.90 | ||||
| CFRS 14.0547 | 1.160 | 14 18 03.47 | 52025.79 | 4100 | 0. |
| 52 30 21.70 | |||||
| CFRS 14.0154 | 1.1583 | 14 18 17.80 | 51975.60 | 3700 | 0. |
| 52 26 31.00 | |||||
| SSA 22-16 | 1.36 | 22 17 36.60 | 51834.49 | 5598 | 4.7 |
| +00 14 41.00 | (ACCUM) | ||||
| CFRS 22.1153 | 1.31180 | 22 17 40.60 | 51828.66 | 3800 | 4.7 |
| +00 18 21.80 |
| Galaxy | FLyco | U | Bo | Go | Vo | Ro | R | Io | Ko |
|---|---|---|---|---|---|---|---|---|---|
| FLyc | Un | B | G | V | R | Rs | I | K | |
| Cl J0023+0423: bbPostman, Lubin, and Oke (1998) | .0540 | 30.3 | 34.1 | 61.4 | |||||
| [LPO98a] 022 | .0394 | 27.9 | 32.0 | 59.2 | |||||
| CFRS 03.1140 ccHammer, Crampton, Le Fevre and Lilly (1995) | .0766 | 70.7 | 48.8 | ||||||
| .0370 | 52.6 | 41.0 | |||||||
| CFRS 10.1887 d,hd,hfootnotemark: | .0688 | 24.5 | 30.5 | 18.4 | |||||
| .0478 | 21.7 | 28.3 | 17.8 | ||||||
| CFRS 10.0239 d,hd,hfootnotemark: | .0778 | 53.1 | 57.6 | 425. | |||||
| .0541 | 47.1 | 53.5 | 411. | ||||||
| CFRS 10.1168 ddLe Fevre, Crampton, Lilly, Hammer and Tresse (1995) | .0470 | 23.0 | 31.4 | ||||||
| .0327 | 20.4 | 29.1 | |||||||
| LDSS2 10.288 iiGlazebrook, Ellis, Colless, Broadhurst, Allington-Smith and Tanvir (1995) | .0879 | 26.9 | 15.7 | ||||||
| .0547 | 23.0 | 14.2 | |||||||
| HDF:iw4 f,jf,jfootnotemark: | .0654 | 13.3 | 18.9 | 21.5 | 35.0 | 21.7 | |||
| 1002 1353 | .0654 | 13.3 | 18.9 | 21.5 | 35.0 | 21.7 | |||
| CFRS 14.0547 e,g,je,g,jfootnotemark: | .0426 | 44.5 | 59.2 | 73.3 | 92.9 | 85.6 | |||
| .0426 | 44.5 | 59.2 | 73.3 | 92.9 | 85.6 | ||||
| CFRS 14.0154 e,je,jfootnotemark: | .0304 | 17.5 | 25.8 | 53.6 | 40.9 | ||||
| .0304 | 17.5 | 25.8 | 53.6 | 40.9 | |||||
| SSA 22-16 jjSteidel (2002) | .0447 | 22.1 | 32.0 | 21.3 | 16.5 | 24.8 | 13.4 | 21.4 | |
| .0245 | 15.6 | 24.5 | 16.3 | 13.5 | 21.4 | 11.9 | 21.0 | ||
| CFRS 22.1153 e,h,je,h,jfootnotemark: | .0606 | 22.7 | 27.3 | 41.8 | 71.1 | 27.1 | 98.2 | ||
| .0332 | 16.0 | 20.9 | 34.5 | 61.4 | 24.2 | 96.3 |
Note. — For each object, photometry in the first row is dereddened (symbolized in the column headings by the subscript o), while that in the second row is observed. Un, G, and Rs have central wavelengths of 3650, 4730, and 6830, respectively. B, V, I and K are standard Johnson filters. Although error bars were not published, we assume that they are approximately 10% for most of these measurements.