A Low Frequency Survey of the Galactic Plane Near : Discovery of Three New Supernova Remnants
Abstract
We have imaged a deg2 field centered on the known Galactic supernova remnant (SNR) G11.20.3 at 74, 330, and 1465 MHz with the Very Large Array radio telescope (VLA) and 235 MHz with the Giant Metrewave Radio Telescope (GMRT). The 235, 330, and 1465 MHz data have a resolution of , while the 74 MHz data have a resolution of . The addition of this low frequency data has allowed us to confirm the previously reported low frequency turnover in the radio continuum spectra of the two known SNRs in the field: G11.20.3 and G11.40.1 with unprecedented precision. Such low frequency turnovers are believed to arise from free-free absorption in ionized thermal gas along the lines of site to the SNRs. Our data suggest that the 74 MHz optical depths of the absorbing gas is 0.56 and 1.1 for G11.20.3 and G11.40.1, respectively. In addition to adding much needed low frequency integrated flux measurements for two known SNRs, we have also detected three new SNRs: G11.150.71, G11.030.05, and G11.18+0.11. These new SNRs have integrated spectral indices between and . Because of confusion with thermal sources, the high resolution (compared to previous Galactic radio frequency surveys) and surface brightness sensitivity of our observations have been essential to the identification of these new SNRs. With this study we have more than doubled the number of SNRs within just a deg2 field of view in the inner Galactic plane. This result suggests that future low frequency observations of the Galactic plane of similar quality may go a long way toward alleviating the long recognized incompleteness of Galactic SNR catalogs.
1 INTRODUCTION
Supernova explosions have a profound effect on the morphology, kinematics, and ionization balance of galaxies, and possibly trigger new generations of star formation. However, based on statistical studies of the incompleteness of Galactic SNR catalogs and predictions of the Galactic SNR rate, there should be many more SNRs in our Galaxy (; Li et al., 1991; Tammann, Loeffler, & Schroeder, 1994; Case & Bhattacharya, 1998) than are currently known (; Green, 2002). This paucity is likely due in part to selection effects acting against the discovery of the more mature, faint, extended remnants, as well as, the very young, small remnants due to poor sensitivity and spatial resolution at low frequencies where SNRs are brightest (c.f. Green, 1991). These missing remnants are thought to be concentrated toward the inner Galaxy where the diffuse nonthermal Galactic plane emission coupled with the thermal emission from H ii regions causes the most confusion. A complete census of Galactic SNRs is essential to understand the star formation history of our Galaxy.
Recent advances in both the instrumentation and software for low radio frequency observations make sensitive, high resolution imaging in this relatively unexplored waveband possible for the first time (see e.g. LaRosa et al., 2000). As a test case for a larger fully sampled mosaic of the inner Galactic plane from to we imaged the region around the known SNR G11.20.3 with the NRAO111The National Radio Astronomy Observatory (NRAO) is a facility of the National Science Foundation operated under a cooperative agreement by Associated Universities, Inc. Very Large Array (VLA) at 74 and 330 MHz using data from multiple configurations. We have also obtained a VLA mosaic at 1465 MHz of this region along with 235 MHz data from the Giant Metrewave Radio Telescope (GMRT). The final region of overlap of these different data sets covers a deg2 field of view, in which we detect two known SNRs: G11.20.3 and G11.4-0.1 and identify three new SNRs. The results from these observations are presented below.
2 OBSERVATIONS
We have carried out observations of the Galactic plane centered on the known SNR G11.20.3 at four frequencies: 1465, 330, 235, and 74 MHz. The 1465, 330, and 74 MHz data were obtained with the VLA in multiple configurations, while the 235 MHz data were obtained from the GMRT. The FWHP primary beams of the single pointing 330, 235, and 74 MHz data are , and , respectively. Data at all four frequencies were acquired in spectral line mode in order to aid in radio frequency interference (RFI) excision and minimize bandwidth smearing. The parameters for these observations are listed in Table 1. The data from all four frequencies were reduced and imaged using the wide-field imaging capabilities within the NRAO AIPS (Astronomical Image Processing Software) package. More information on wide-field imaging techniques can be found in Cornwell & Perley (1992). Some additional details of wide-field Galactic plane imaging can be found in LaRosa et al. (2000).
The initial antenna based gain and phase corrections for the 235, 330, and 1465 MHz data were calculated in the usual way from observations of the phase calibrator 1833210 and either 3C286 or 3C48 for flux calibration. Unfortunately, there are no point like calibrators at 74 MHz that are strong enough to dominate the total flux in the large 74 MHz primary beam (). For this reason, the flux scale and a single instrumental phase at 74 MHz were estimated from observations of Cygnus A using a publicly available model of its source structure. Since Cygnus A is far from the target field, initial estimates for the phase as a function of time, as well as positional information for the target field were obtained by using the VLA 330 MHz image as the model in the first round of 74 MHz phase only self-calibration (see Kassim et al., 2003, for further details specific to 74 MHz VLA data reduction). At all four frequencies, following the initial calibrat-based corrections, several iterations of self-calibration were applied to data from each configuration or observation listed in Table 1 in order to improve the dynamic range. The calibrated visibility data from all of the available observations for each frequency were then concatenated into a single - data set, after which one further amplitude and phase calibration was performed.
The 1465 MHz VLA image is composed of a three pointing mosaic, with the pointings arranged in a triangle with G11.20.3 near its center. The FWHP primary beam of each pointing is . The three pointings were calibrated and imaged separately and then combined with the linear mosaicing task FLATN within AIPS. During the FLATN process, the individual pointings were corrected for the response of the primary beam and then masked at the 25% power point. The final 1465 MHz image covers a deg2 area. After correction for the primary beam response, the 330, 235, and 74 MHz images were subimaged to the same field of view.
To correct for the gain compression that the GMRT suffers when observing toward bright sources (i.e. the inner Galactic plane), an additional gain correction factor must be applied to the 235 MHz data after imaging. This factor can be estimated at the time of the observations by comparing the total power data for the calibrators with and without the automatic level attenuators on for each antenna. At the time of the second GMRT 235 MHz observation (see Table 1), this empirical factor had an average value of 4 (this factor is not available for the first GMRT observation). However, the integrated flux density measurements of the known SNRs (G11.20.3 and G11.40.1) after multiplying the final image by this correction factor were excessively high given their known spectral indices. This discrepancy may be due in part to the amplitude self-calibrations that were applied to the 235 MHz data before the gain correction factor, or it is possible that the correction factor for the first observing run may be different from that of the second. In order to better calibrate the 235 MHz gain, we have used the spectral index between 330 and 1465 MHz at each pixel for G11.20.3 and G11.40.1 to create an image of the expected flux density at 235 MHz for each pixel. This approach is justified since the continuum spectra of SNRs above 150 MHz are well characterized by a constant power-law spectrum (see e.g. Kassim, 1989a). Comparison of the expected 235 MHz image with the observed (uncorrected) image yielded an average correction factor of 2.7. The final 235 MHz image was multiplied by 2.7, before primary beam correction. The corrected 235 MHz image was then convolved to a resolution of .
For the 1465 and 330 MHz VLA data, care was taken to match the - coverage so that each composite data set had an intrinsic resolution of approximately . The images were then convolved to exactly , but the convolution was minimal. The 1465 and 330 MHz data are not sensitive to structures larger than . The VLA 74 MHz data have a resolution of . The 74 MHz image does not include A-configuration data because exceptionally poor ionospheric conditions rendered them uncalibratable. Since the 74 MHz resolution only marginally resolves the SNRs, and as described above, the amplitude calibration of the 235 MHz data is a bit uncertain, data from these two frequencies were only used for integrated flux measurements.
3 RESULTS
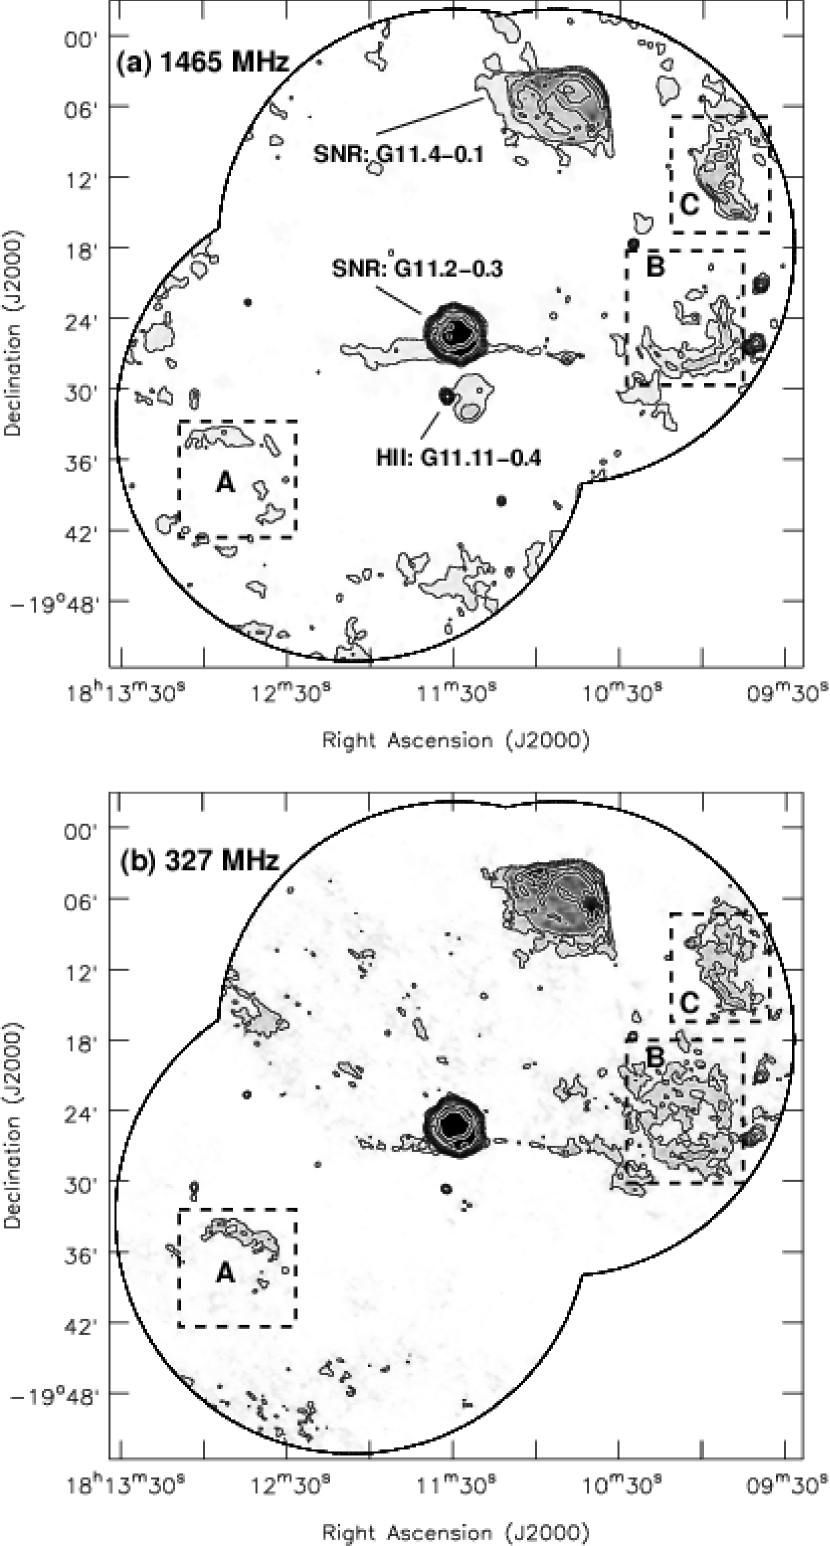
Figures 1a and 1b show our VLA 1465 MHz and 330 MHz images with resolution of a deg2 area centered at G11.20.3. The rms noise levels in these two images are mJy beam-1 at 1465 MHz and mJy beam-1 at 330 MHz, while the dynamic range in these two images are 470 and 340, respectively. The known SNRs G11.20.3 and G11.40.1 are labeled on Figure 1a for reference along with the locations of the three new SNR candidates designated A, B, and C. The Galactic coordinates for the new SNR candidates are A: G11.150.71, B: G11.030.05, and C: G11.18+0.11. These positions have been taken from the approximate center of the SNR shells, and for the purpose of this paper two significant digits (instead of the usual one) are used to help distinguish the new candidate SNRs from the two known remnants. Given the strong morphological and spectral evidence presented below, we will henceforth refer to these sources as “new SNRs”, rather than SNR candidates.
Integrated flux density measurements were made for the four frequencies in our study for all five SNRs. Since the images have different noise levels, and several of the sources have regions of “breakout” morphology that tend to gradually fade into the noise (i.e. not sharp shells) it was difficult to determine where the boundaries of the SNRs should be drawn. Therefore, in order to get comparable flux density estimates, the (12 mJy beam-1) contour of the 330 MHz image (see Figure 1b) was used to define the SNRs for all of the integrated flux measurements. The errors on these flux density measurements were estimated by at each frequency. Upper limits for nondetections were estimated by . The rms noise of the 235 MHz and 74 MHz data are 8 mJy beam-1 and 150 mJy beam-1, respectively. When necessary, an extra contribution from the background was subtracted from the integrated flux density. This contribution was estimated by integrating the flux in a nearby source free region with the same approximate area as the source. The background level correction was only necessary for the 74 and 235 MHz images. In addition, the error estimates for the 235 MHz flux densities have had an additional error added to account for the extra uncertainty in the 235 MHz gain calibration described above.
Flux densities from the literature have also been included in our analysis for all cases in which an error estimate is available and the error is less than 20%. Figures 2 and 3 show the integrated radio continuum spectra for the two known SNRs in our field, G11.20.3 and G11.40.1. Figures 4-6 show the integrated radio continuum spectra for the new SNRs A (G11.150.71), B (G11.030.05), and C (G11.18+0.11). Further details for each SNR are described below in §3.1.
For each SNR, the integrated spectral index was calculated using a weighted least squares fit using the data points shown in Figures 2-6 (except for the 74 MHz upper limits). Due to the method described above to calibrate the 235 MHz gain, the data points at 235 MHz were not used to fit the spectral index for G11.20.3 and G11.40.1 (i.e. since these 235 MHz flux densities were used to set the 235 MHz gain scale). The data for G11.20.3 and G11.40.1 were fit to the equation
| (1) |
where and are the flux density and optical depth at a fiducial frequency of 1000 MHz, respectively, and is the integrated spectral index (Dulk & Slee, 1975; Kassim, 1989a). This equation assumes a standard nonthermal constant power law spectrum and allows for a thermal absorption turnover at lower frequencies (see e.g. Dulk & Slee, 1975; Kassim, 1989a). The free-free continuum optical depth at other frequencies can be estimated from . The new SNRs were deemed to have too few data points to adequately constrain Eq. 1, instead they were fit with a pure power law (i.e. ). The solid lines in Figures 2-6 show the best fits for each SNR.
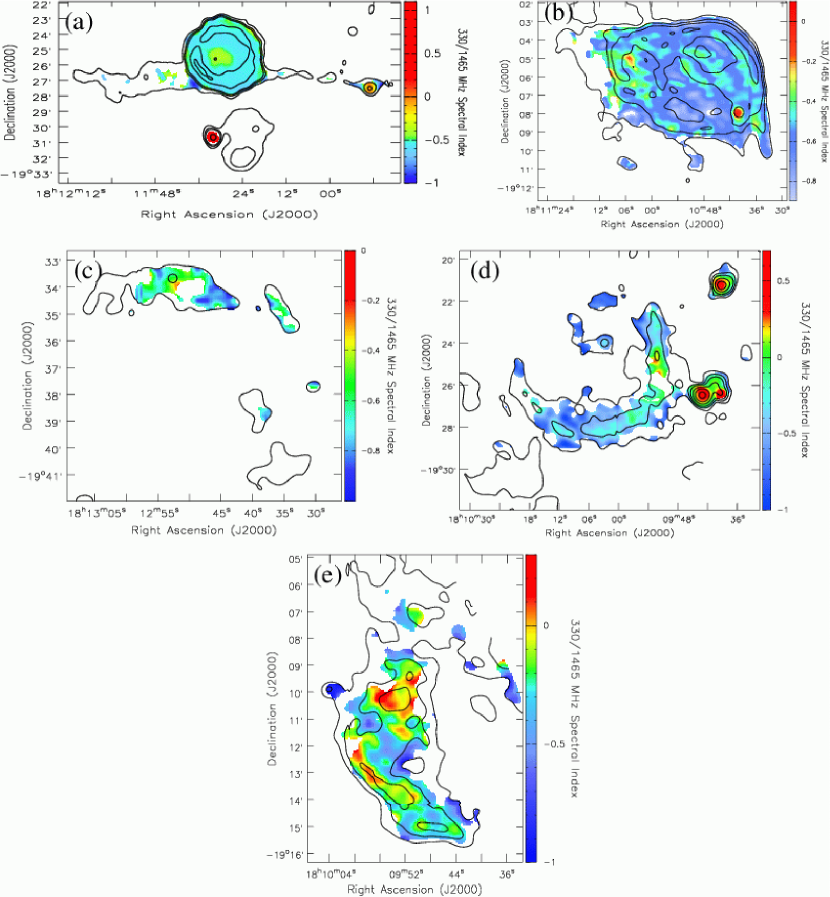
Figures 7a-e show spatially resolved spectral index maps toward the five SNRs between 330 and 1465 MHz. Before calculating the spectral index, the two images were masked at the level (12 and 4 mJy beam-1, respectively). Due to the low level calibration and positional errors that are inherent in these low frequency images, small scale spectral index variations less than should be viewed skeptically. However, these maps are quite useful for identifying regions of thermal (positive ) vs. nonthermal emission (negative ).
3.1 Individual Sources
3.1.1 SNR G11.20.3
The SNR G11.20.3 is thought to be coincident with the historical supernova of A.D. 386 (Clark & Stephenson, 1977). Although there is still some ongoing debate over the reality of this association, it is clear that G11.20.3 is quite young (Roberts et al., 2003). The distance to this remnant has been estimated from H i absorption measurements to be kpc (Radhakrishnan et al., 1972; Green et al., 1988). In the radio, G11.20.3 has a steep spectrum radio shell with a significantly flatter spectrum central core (see Figure 7a; Tam, Roberts, & Kaspi, 2002; Morsi & Reich, 1987; Kothes & Reich, 2001). The soft X-ray morphology of G11.20.3 follows that of the radio shell while there is a nonthermal, hard X-ray core consistent with a pulsar wind nebula (Vasisht et al., 1996, PWN;). Subsequent X-ray observations have confirmed the presence of a 65 ms X-ray pulsar near the center of the remnant (Torii et al., 1997; Kaspi et al., 2001; Roberts et al., 2003).
Kothes & Reich (2001) have studied the morphology of G11.20.3 between 10 and 32 GHz using the Effelsberg radio telescope and find that the data are consistent with a radio shell spectral index of and a PWN spectral index of , with the PWN contributing about 1 Jy of flux to the integrated flux density of the remnant ( at 1.4 GHz). A higher resolution study of the spectral index variations of G11.20.3 between 1465 and 4865 MHz using archival VLA data has been carried out by Tam, Roberts, & Kaspi (2002) in order to study the interaction of the PWN with the shell. These authors find that and that the PWN region has and contributes about 1 Jy of flux density at 1465 MHz. However, this analysis may suffer from missing short spacings, along with confusion from the SNR shell emission.
In order to account for the flatter spectrum of the core, 1 Jy has been subtracted from the integrated flux measurements shown in Figure 2 for data with MHz, assuming that . We have not subtracted 1 Jy below 200 MHz under the assumption that the PWN could suffer from self-absorption at some frequency, as well as the extrinsic free-free absorption observed for the SNR as a whole. However, without more information about the spectral properties of the PWN, this choice of cutoff frequency is somewhat arbitrary. It is clear from the fit shown in Figure 2 that there is still a small excess of flux at higher frequencies, suggesting that is actually somewhat inverted (i.e. ). A more detailed study of the spectral characteristics of the PWN will be presented in Tam et al., in prep. based on the new VLA 330 MHz image and 1465 MHz mosaiced image presented here, along with new 4835 and 8600 MHz mosaics of this region.
The integrated continuum spectrum shown in Figure 2 for G11.20.3 shows a sharp down turn for MHz. This spectral behavior was also noted by Kassim (1989a) in a survey to determine the spectral properties of SNR at low frequencies, and will be discussed further in §4.2. The best fit parameters to the data shown in Figure 2 (after subtracting 1 Jy as described above) are for the shell and an optical depth at 74 MHz of . The spatially resolved spectral index of G11.20.3 is shown in Figure 7a. The flatter spectrum of the PWN is clearly visible in this image.
The nature of the weak, extended () linear feature that lies tangent to the southern edge of G11.20.3 (see Figures 1a, b, and 7a) is unkown. The radio spectrum of this extended emission is fairly steep with spectral indicies of . Moreover, there are no extended infrared sources near this linear structure (see §4.1). Together, these facts suggest that the emission is nonthermal in origin.
3.1.2 SNR G11.40.1
G11.40.1 was first identified as an SNR by Caswell et al. (1975). The distance to this SNR is currently unknown. The best fit parameters for the integrated continuum spectrum shown in Figure 3 are and an optical depth at 74 MHz of . The spatially resolved spectral index map for G11.40.1 shown in Figure 7b suggests the presence of a number of flatter () than average () spectral index filaments running through the SNR. Similar spectral flattening toward filamentary structures has recently been observed toward a number of mature SNRs including W28 and W49B (Dubner et al., 2000; Moffett & Reynolds, 1994). Such flattening may be indicative of first order Fermi shock acceleration at the sites of strong shocks (see e.g. Jun & Jones, 1999).
Dubner et al. (1993) suggested that this SNR could be composed of two superposed remnants due to its morphology in resolution 1465 GHz VLA images. From the 330/1465 MHz spectral index map shown in Figure 7b, it seems likely that G11.40.1 is composed of a single nonthermal structure. The point source near RA , DEC (J2000) in Figs 1a, b and 7b has a flat radio spectrum (), and since it does not have an infrared counterpart, it is unlikely to be thermal in origin (see §4.1) and is most likely an unrelated extragalactic source. It could also be a pulsar, but since this region of the plane was observed in the Parkes Multibeam pulsar survey (Morris et al., 2002) it seems unlikely that a pulsar with such a strong radio continuum would have gone undetected. While strong to be a heretofore undetected pulsar, the point source only contributes a few tens of mJy to the integrated SNR flux density so no effort was made to subtract it from the integrated flux measurements.
3.1.3 New SNR A: G11.150.71
The integrated continuum spectrum for the new SNR A located at G11.150.71 is shown in Figure 4, while a map of its spatially resolved spectral index between 330 MHz and 1465 MHz is shown in Figure 7c. At 330 and 1465 MHz G11.150.71 appears as a rim brightened partial shell on its northern end. G11.150.71 has also been weakly detected in the 2695 MHz Bonn survey (Reich et al., 2001, this data point is included on Figure 4) but has not previously been spatially resolved or recognized as a nonthermal source. Its integrated spectral index is quite steep with .
3.1.4 New SNR B: G11.030.05
New SNR B at G11.030.05 appears as a complete shell at 330 MHz and a partial shell at 1465 MHz (see Figures 1a, b). A plot of its integrated continuum spectrum is shown in Figure 5, while the morphology of its spatially resolved 330/1465 MHz spectral index is shown in Figure 7d. G11.030.05 has an integrated spectral index of . The double source at RA , DEC (J2000) (just west of the SNR shell structure) with a positive spectral index has also been detected in a 3cm radio recombination line (RRL) survey by Lockman (1989) with the NRAO 140 ft telescope with a beam. This RRL has a velocity of 18.5 km s-1 and km s-1. Other tracers of star formation have also been detected in this region with similar velocities including a molecular cloud in CS and methanol masers (Bronfman, Nyman, & May, 1996; Walsh et al., 1998). Confusion from the associated H ii region likely explains why this SNR has not been discovered in lower resolution surveys.
3.1.5 New SNR C: G11.18+0.11
Figure 6 shows the integrated continuum spectrum for SNR C at G11.18+0.11, while Figure 7e shows the morphology of the spatially resolved 330/1465 MHz spectral index. The integrated spectral index for this SNR candidate is . The region of positive spectral index near the northern end of candidate C (J2000 RA, DEC ) is coincident with a RRL detected by Lockman (1989) with a velocity of 7.3 km s-1 and km s-1 using the NRAO 140 ft at 3 cm (to within their beam). It is difficult to estimate the contribution of this thermal component to the integrated SNR flux due to the absence of spatially resolved data at a higher frequency. For example, an unresolved source is apparent at the position of the SNR candidate in the 2695 MHz Bonn survey images but it is confused with both the H ii region traced by the RRL, as well as, the steep spectrum point source just east of the SNR shell that is likely extragalactic (see Figure 7e). For this reason, no effort was made to remove this thermal component from the integrated flux densities, and the reported should be viewed as a lower limit.
4 DISCUSSION
4.1 The G11.20.3 Field at Other Wavelengths
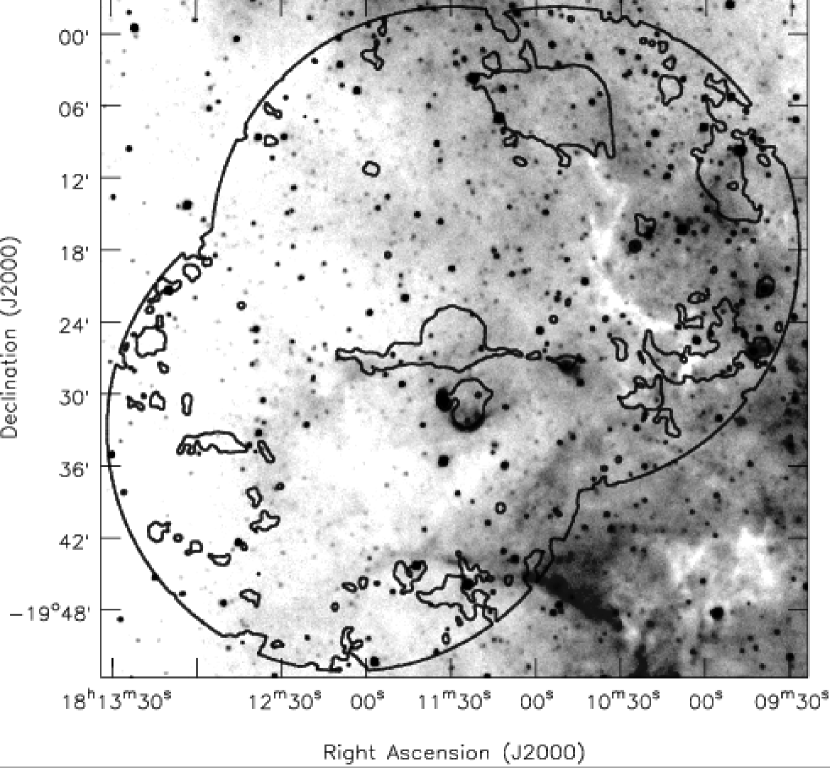
Comparisons of high resolution radio and infrared Galactic plane images are quite useful in distinguishing different components of the ISM (see for example Cohen & Green, 2001). Figure 8 shows a resolution mid-infrared 8.28 m image from the Midcourse Space Experiment Satellite (MSX) Galactic Plane Survey of the G11.20.3 field with the 4 mJy beam-1 1465 MHz contour superposed (see Price et al., 2001, for details about the MSX image processing). In the Galactic plane, the 8.28 m emission is dominated by contributions from PAH molecular line emission, and thermal emission from warm dust around evolved stars, and regions of star formation (normal, and ultracompact H ii regions). The details of the origin of the diffuse mid-IR emission is less certain but may be associated with the diffuse warm ionized medium (WIM). The 1465 MHz radio continuum image has contributions from both nonthermal, as well as, ionized thermal sources. In Figure 8 sources with both strong infrared and radio detections are likely to be normal or ultracompact H ii regions; unresolved sources with radio but no infrared emission are nonthermal and are most likely extragalactic but could also be very young SNRs, pulsars, or unresolved PWNe; unresolved sources with infrared, but no radio continuum emission are most likely normal and evolved stars; extended infrared sources without radio continuum emission trace the very youngest stages of star formation where the surrounding medium has not yet been ionized (regions that are optically thick even at 8.28 m can appear as mid-IR voids with no radio emission, e.g. in the SW corner of Figure 8); and finally, extended radio continuum emission without strong infrared emission must be nonthermal and may be SNRs (see Cohen & Green, 2001, for a more detailed discussion of these classifications and some caveats). There are a few cases where extended infrared emission has been detected toward SNRs, but this only seems to occur when an SNR shocks a nearby molecular cloud (i.e. 3C 391, Reach et al., 2002).
A low ratio of infrared to radio continuum flux has been used for some time as a tool to identify SNR candidates in Galactic plane surveys (Whiteoak & Green, 1996). However, at the comparatively poorer resolutions used in past surveys () application of this test could be ambiguous in confused regions of both thermal and nonthermal emission. The high resolution images shown in Figure 8 dramatically demonstrate the location of the Galactic plane running through the eastern half of the image, as well as, the confusion associated with star formation in this region, particularly near the new SNRs B: G11.030.05 and C: G11.18+0.11. Many of the sources in our 330/1465 MHz spectral index maps (Figures 7a-e) with have counterparts at 8.28 m and are likely to be H ii regions. The radio point sources located toward the SW corner of G11.40.1 and to the east of SNR C (see §3.1.2 and §3.1.5) are not coincident with infrared emission and therefore, are statistically likely to be extragalactic although as mentioned above they could also be pulsars. No extended infrared features (above the diffuse Galactic infrared background) are detected toward the five SNRs discussed here. There is also no evidence for an infrared counterpart to the extended linear radio continuum feature that lies tangent to the southern edge of G11.20.3 (§3.1.1).
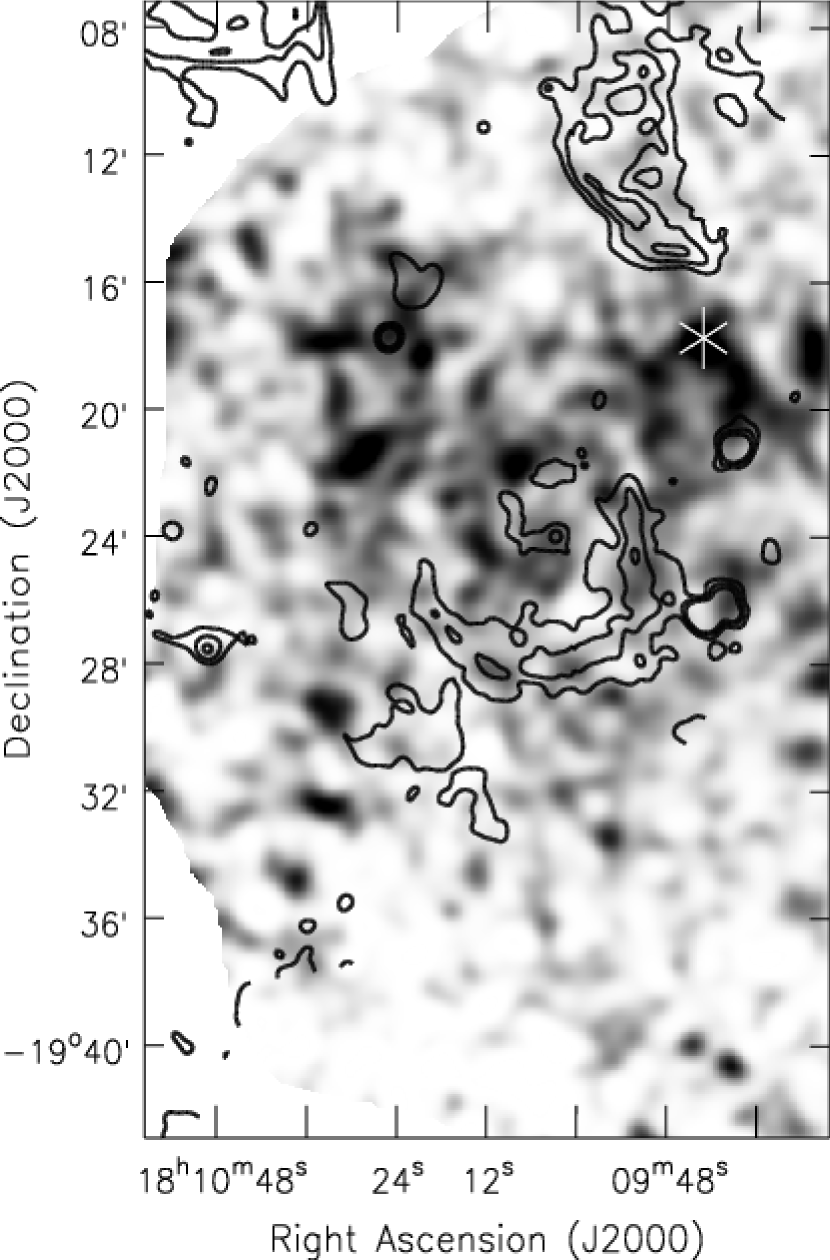
The ASCA and ROSAT X-ray archives were also searched for possible correlations with the SNRs in the G11.20.3 field. With the exception of G11.20.3 itself, whose X-ray properties have been discussed by a number of authors (see e.g. Vasisht et al., 1996), none of the other SNRs in the field were detected by either ASCA or ROSAT. However, there is a region of diffuse X-ray emission in between SNRs B: G11.030.05 and C: G11.18+0.11 in an image from the ASCA Galactic plane survey (47 ks exposure with the GIS instrument). An ASCA X-ray image spanning the energy range 2-10 keV in the region of SNRs B and C is shown in Figure 9. The X-ray data were processed using the technique described in Roberts, Romani, & Kawai (2001). The origin of the diffuse X-ray emission near the center of Figure 9 is uncertain, however, the radio pulsar PSR J18091917 described in §4.3 is coincident with a peak in the X-ray emission (see Figure 9). Low signal to noise diffuse emission is also coincident with the middle and northern parts of G11.030.05. The X-ray spectra derived from the ASCA data lack sufficient counts to adequately fit their spectra. It would be interesting to investigate this region in the X-ray with higher sensitivity in order to determine the nature of the diffuse emission.
4.2 Distances from the relation
The relation (surface brightness vs. diameter) has long been used to assign distances to SNRs without alternative distance estimates, based on the observed properties of SNRs at known distances. Such relations rely on the assumption that supernova explosion energies, ambient densities, and the strength and evolutionary state of their magnetic fields are similar. It remains unclear to what extent these assumptions are true, particularly in regard to the ambient density. Indeed, while relations often provide a fairly tight correlation for a statistical sample, their application to individual SNRs is fairly dubious (see Case & Bhattacharya, 1998, for further discussion). Despite this caveat, we have used the most recent determination of the Galactic relation derived by Case & Bhattacharya (1998):
| (2) |
to estimate the distances to the five SNRs discussed in this paper (see Table 2). The sample used to derive the fit in Eq. 2 includes data from 36 Galactic shell type SNRs. Case & Bhattacharya (1998) find that the average fractional deviation of an individual SNRs distance in their sample from that calculated from Eq. 2 is .
Table 2 shows the parameters used to derive the SNR distances. The distance to G11.20.3 estimated from Eq. 2: 6 kpc, is fairly close to that estimated from H i absorption (see §3.1.1). Note that G11.20.3 was not included in the Case & Bhattacharya derivation of the relation. The estimated distances to the other SNRs are G11.40.1: 9 kpc, G11.150.71: 24 kpc, G11.030.05: 16 kpc, and G11.18+0.11: 17 kpc. The range of these values assuming a fractional error are also listed in Table 2. It is notable that the fraction of low surface brightness compared to high surface brightness shell type remnants among the known SNRs is much higher than the fraction used to derive Eq. 2 (i.e. few SNRs with low surface brightness have known distances; Case & Bhattacharya, 1998). Hence, Eq. 2 is significantly biased toward high surface brightness shell type SNRs. The effect of this bias on Eq. 2, and hence our three new low surface brightness shell type remnants is uncertain. It is interesting that the high end of the distance ranges presented in Table 2 (assuming a fractional error), would unrealistically place all three of the new SNRs outside the bounds of the Galaxy, perhaps suggesting that the distance to these SNRs are not well fit by Eq. 2. Also, note that the cases of G11.150.71 and G11.18+0.11 are particularly uncertain (independent of the accuracy of Eq. 2) since the angular size () of these two SNRs are difficult to estimate since they only appear as partial shells in the current images. This analysis suggests that the three new SNRs may lie on the far side of the Galaxy, but H i absorption measurements are needed to better constrain their distances.
4.3 Pulsar Association?
In addition to the pulsar associated with G11.20.3 described in §3.1.1, one other pulsar has been discovered within the confines our low frequency field of view. PSR J18091917 was discovered in the Parkes Multibeam Pulsar Survey by Morris et al. (2002) and is located at RA, DEC (J2000). The position of the pulsar is indicated on Figure 9. It has a pulse period of 83 ms, a flux density at 1400 MHz of 2.5 mJy, dispersion measure DM= 197 pc cm-3, a dispersion measure distance of kpc, and a characteristic age of 50 kyr. We do not detect the pulsar at either 330 or 1465 MHz. This is not surprising for the 1465 MHz data because the noise rises to mJy beam-1 near the edge of the image (due to the primary beam correction). However, if we assume a typical pulsar spectral index of the predicted 330 MHz flux density is 45 mJy beam-1 which should be easily detectable in our 330 MHz image (rms noise 3 mJy beam-1). Alternatively, the pulsar’s spectral index could be lower than average ( predicts mJy beam-1). In the current ATNF pulsar catalog222http://www.atnf.csiro.au/research/pulsar/psrcat/, of of the 283 pulsars with a measured spectral index have .
The characteristic age estimate (50 kyr) assumes that the birth spin period is negligible compared to the current spin period. However, recent studies on a small number of pulsars, for which an independent age estimate can be made, suggest that the birth period is actually between 20 to 130 ms (see e.g. Kaspi et al., 2001; Kramer et al., 2003). Thus for young pulsars that currently have short spin periods (i.e. little spin down has yet occurred), a fundamental assumption of the characteristic age calculation is violated. This implies that the true ages of these pulsars could be significantly younger than suggested by the characteristic age. For example, if the birth period of PSR J18091917 was ms, and we assume that the spin down is dominated by dipole radiation with a braking index of 3, then the true age of the pulsar is kyr, half the characteristic age (see Kramer et al., 2003).
PSR J18091917 is located about from the center of G11.030.05 (new SNR B) and from the center of G11.18+0.11 (new SNR C). If these SNRs are located kpc away (see Table 2) compared to the kpc distance estimated for the pulsar, then obviously there can be no association. However, as described in §4.2 the uncertainty in distances derived from the relation are considerable. Also, given that the pulsar is fairly young and the notorious difficulty with establishing SNR/pulsar associations, it is worthwhile to determine whether the pulsar could have reasonably moved to its current location from the center of either remnant (assuming they are at the same distance). No independent distance has yet been obtained for PSR J18091917, so we will assume the dispersion measure pulsar distance of 4 kpc. This distance is based on a model for the electron distribution along the line of sight to the pulsar and is probably good to within (Taylor & Cordes, 1993). Assuming that the pulsar is 50 kyr old, the pulsar’s transverse speed would need to be km s-1 to originate from G11.030.05 and km s-1 for G11.18+0.11. Such transverse velocities are quite reasonable for pulsars, and would still be plausible if the true age of the pulsar is younger than the characteristic age as described above, or the pulsar is more distant. For example, from analysis of the velocity distributions of a large sample of pulsars, Arzoumanian, Chernoff, & Cordes (2002) predict that of pulsars have velocities km s-1. Further assessment of the reality of a possible association with either remnant will have to await more reliable distance estimates for the SNRs.
4.4 Low Frequency Turnovers for G11.20.3 and G11.40.1
The integrated continuum spectra shown in Figures 2 and 3 for G11.20.3 and G11.40.1 show clear signs of a low frequency turnover. Their optical depths at 74 MHz of 0.56 and 1.1, respectively, are higher than those found by Kassim (1989a) by about . Because our new spectra include critical new data points at 74 and 330 MHz and we have chosen to only use integrated flux densities from the literature with error estimates that are less than , our estimated optical depths are more accurate. The three new SNRs also show indications of a low frequency turnover based on their 74 MHz upper limits, which we hope to confirm with future higher resolution 74 MHz data. From a survey of the integrated continuum spectra of 47 Galactic SNRs, Kassim (1989a) found that of the observed remnants show a low frequency turnover below MHz. This turnover is thought to be due to free-free absorption by intermediate temperature ( K) and density ( cm-3) ionized thermal gas along the line of sight to the SNRs (see e.g. Kassim, 1989a, and references therein). Based on the fact that such absorption is not seen toward all SNRs, and does not seem to depend on distance, it is unlikely that the absorbing medium is a distributed component of the ISM, but is more likely associated with discrete sources. Kassim estimates that the filling factor of ionized material with the required electron densities and temperatures is .
A number of origins for the absorbing medium have been suggested. Two obvious sources of Galactic ionized gas: the warm ionized medium (WIM) and H ii regions do not provide the appropriate physical conditions. The WIM has electron densities that are too low by a factor of to 100 and its filling factor is too high (; Kulkarni & Heiles, 1987). Normal H ii regions have electron densities and temperatures that are far too high to account for the moderate low frequency optical depths that are observed, and they would be easily detected in higher frequency continuum observations. One reasonable suggestion is that the extended envelopes of normal H ii regions (EHEs) might well provide the requisite temperatures and densities (Anantharamaiah, 1985, 1986). It is unclear whether such envelopes extend far enough into the ISM to account for a large fraction of the SNRs showing low frequency absorption.
Alternatively, Heiles, Reach, & Koo (1996) suggest that Galactic “worms” may cause absorption toward some sources. Worms are thought to be created after the first generations of an OB star cluster explode as supernovae, blowing a large evacuated superbubble, the walls of which are then ionized by later generations of OB stars. The spatial extent of such worms can be several degrees across. Koo, Heiles, & Reach (1992) have cataloged 118 Galactic worm candidates from single dish H i and radio continuum data plus correlations with IRAS infrared data. All of the worm candidates lie toward the inner Galaxy. Heiles, Reach, & Koo (1996) find that in some cases worms also emit RRLs and that the electron densities and temperatures expected for worms are commiserate with those needed to produce free-free absorption at low radio frequencies.
The low frequency absorption observed toward the SNR W49 B (G43.30.2) by Lacey et al. (2001) could be a case of absorption by a worm. An early identification of the existence of ionized thermal gas toward W49 B came from the detection of RRL lines at km s-1 (Pankonin & Downes, 1976). Lacey et al. (2001) subsequently found excellent agreement between the spatially resolved morphology of the free-free absorption at 74 MHz and that of H i absorption at km s-1. There are no obvious H ii regions near W49B (in the plane of the sky) with a velocity of km s-1 that could be a candidate for producing an EHE. Lacey et al. suggest that the absorption is due to a few compact H ii regions (and their envelopes) along the line of sight to W49 B itself, but it is difficult to see how the cores of such H ii regions could escape detection at higher frequencies (Moffett & Reynolds, 1994). Interestingly, one of the worms cataloged by Koo, Heiles, & Reach (1992) is in this general direction (GW 44.81.8) has an extent of and velocities between 43 to 66 km s-1. Future RRL observations may determine whether the physical conditions in the worm are in agreement with those needed to produce the free-free absorption.
It also possible that some SNRs could create their own absorbing medium if they happen to run into a nearby molecular cloud, assuming that the shock is a fast, ionizing J-type shock. Evidence for this case has recently been discovered for the SNR 3C 391 which is known to be interacting with a nearby molecular cloud (see e.g. Reach & Rho, 1999). The spatially resolved morphology of the 74 MHz free-free absorption toward 3C 391 matches very well with that of mid-infrared fine structure atomic lines that are known to be good tracers of ionic shocks (Brogan et al., in prep.; Reach et al., 2002). Since all of these phenomena exist, it is likely that each of them are responsible for at least some fraction of the observed free-free absorption and only by studying a number of sources in detail can the dominant process be determined.
The emission measures implied by our newly derived optical depths for G11.20.3 and G11.40.1 can be calculated from:
| (3) |
where EM is the emission measure, is the electron temperature, and is the Gaunt factor and is at the temperatures and densities discussed here (Dulk & Slee, 1975). Assuming an electron temperature of 5000 K, the average emission measure (EM) for absorbing gas toward G11.20.3 and G11.40.1 at 74 MHz are cm-6 pc and cm-6 pc, respectively. Accounting for the lower used here, 5,000 K instead of 10,000 K, these emission measures are similar to those found toward the SNR W49 B (Lacey et al., 2001).
There are no indications in the spectral index maps of G11.20.3 and G11.40.1 between 330 and 1465 MHz of the morphology of the absorbing medium. This is not surprising given that the 330 MHz optical depths are only 0.02 and 0.05 for G11.20.3 and G11.40.1, respectively. There is some indication in our resolution 74 MHz image that G11.20.3 suffers from more absorption on its eastern side than the western side, but this will need to be confirmed by higher resolution 74 MHz data. The H ii region G11.110.4 located just south of G11.20.3 (see Figure 1a), is a potential candidate to provide an absorbing EHE if its distance along the line of site is closer to us than that of the remnant. The kinematics of the molecular gas associated with this H ii region are consistent with a location in the 3 kpc arm of the Galaxy, suggesting that the distance to the H ii region is kpc, similar to that of the SNR (Solomon et al., 1987; Kurtz, Churchwell, & Wood, 1994). A detailed comparison of H i absorption toward both G11.20.3 and G11.110.4 will be needed to better determine their relative distances. No known H ii regions are in close enough proximity (in the plane of the sky) to G11.40.1 (see Figure 1a) to provide an EHE candidate for this SNR.
Spatially resolved 74 MHz images have been crucial in determining the nature of the absorbing medium for W49 B (Lacey et al., 2001) and 3C 391 (Brogan et al. in prep.). Future spatially resolved 74 MHz images are likely to be equally important in identifying the source of ionized thermal gas toward G11.20.3 and G11.40.1.
4.5 Implications for the Number of Galactic SNRs
A number of recent studies that range from analyzing the rate of historical Galactic supernovae, the rate of supernovae in the Local Group of galaxies, to the birth rate of OB stars within 1 kpc of the sun suggest that the rate of Galactic supernovae is about 1 per 50 years (see e.g. Tammann, Loeffler, & Schroeder, 1994). If we assume that supernova remnants can be distinguished from the Galactic background nonthermal emission for about 50,000 to 100,000 yrs then there should be on the order of 1000 to 2000 SNRs in our galaxy today. This number is far below the number of currently known Galactic SNRs, (Green, 2002).
For some time, observational selection effects have been thought to be the responsible for the low number of Galactic SNRs currently known (see e.g. Green, 1991). These selection effects include (1) the difficulties associated with detecting the more mature, large, faint remnants in the inner Galaxy due to confusion with the Galactic synchrotron background radiation; (2) the challenges involved with identifying small, young shell type SNRs that can be easily confused with steep spectrum extragalactic sources; (3) difficulties with distinguishing young and older shell type remnants when they are confused with H ii regions that lie along the line of sight; and (4) about of SNRs known as plerions have no identifiable shell, and have flat spectra so that they are difficult to distinguish from H ii regions, even in high resolution images (see e.g. Helfand et al., 1989). The solution to the first problem is obviously to make high surface brightness sensitivity observations, while the second requires high spatial resolution in the hopes of resolving a candidate SNRs shell morphology. The solution to number (3) is to obtain equally sensitive, high resolution multi-wavelength data so that sources of thermal emission can be separated from nonthermal emission. The solutions to number (4) include looking for strong linear polarization, or an associated pulsar.
In the deg2 field centered on G11.20.3 we have overcome the first three of the above mentioned problems by obtaining high surface brightness sensitivity, high resolution, multi-wavelength data. These data have resulted in the discovery of three new SNRs. All three new remnants appear fairly old and at least based on the somewhat dubious relation, are located on the other side of the Galaxy (16 to 24 kpc). We have not identified any new young SNRs in this field. However, statistically this is not surprising since this field also contains the historical remnant G11.20.3 from A.D. 386, and we have only sampled a small fraction of the inner Galactic plane. If we define “young” SNRs as having ages less than 2,000 years, then assuming one SNR every 50 years implies that there are such “young” remnants in the Galaxy. There are only six known historical remnants (meaning that sightings of their optical emission were recorded in historical documents): the Crab, SN1006, 3C 58, Tycho, Kepler, and G11.20.3, plus a handful of suspected “young” SNRs including CasA. Thus there are on the order of 30 “young” SNRs that have yet to be discovered. These SNRs are presumably missing from the historical records because the optical emission from their initial explosions were obscured by intervening material. Indeed, five of the six historical SNRs described above, are a degree or more off the plane.
Extrapolating from this approximately 1 deg2 field of view, we can estimate how many SNRs should be detected in our planned 330 MHz survey of the inner Galaxy, from with . For this estimate, we make the simplifying assumption that the distribution of SNRs within this strip of the Galactic plane is fairly uniform. However, this assumption could be violated if some lines of site pass through more spiral arms than others. Cordes & Lazio (2003) have recently completed a new analysis of the Galactic free electron distribution determined from pulsar dispersion measurements (this work extends and improves upon the original study by Taylor & Cordes, 1993). From the Galactic electron distribution and many other lines of evidence, these authors have also developed a an updated model for the Galactic spiral arm structure. The Cordes & Lazio (2003) spiral arm model suggests that there are two potential disparities in the total number of spiral arms in the longitude range . These include the fact that (1) the Norma arm does not appear to extend beyond on the near side of the Galactic center; and (2) the Crux-Scutum Arm does not appear to extend to longitudes smaller than on the far side of the Galactic center. An even greater discrepancy is possible if a line of site passes through a tangent point of a spiral arm where gas, H ii regions, and presumably SNRs tend to pile up. This may well be the true for lines of site near . In any case, the region near does not appear to be a particularly special one within the range, suggesting that this field of view should not be overdense with SNRs compared to the rest of the survey region.
The above caveats aside, the results from our deg2 field toward G11.20.3 suggest that near , the density of SNRs in this part of the Galactic plane could be as high as 5 per deg2. We will sample approximately 32 deg2 in our survey, but we assume that only the deg2 near (i.e. ) has an SNR density of 5 per deg2, with the extra area accounting somewhat for density variations. These assumptions imply a total SNR count in the and region of . This number is in reasonable agreement with that predicted by Helfand et al. (1989) for this region of the Galactic plane (63) based on a Galaxy wide treatment of SNR densities (also see Case & Bhattacharya, 1998, and references therein). Within the bounds of our future survey region, only 14 SNRs are currently known (Green, 2002)! Only the actual results from our more extensive survey will determine whether this estimate is realistic, but in any case it will go along way toward determining the true distribution of Galactic SNRs.
5 CONCLUSIONS
In a deg2 field of view centered on the known Galactic SNR G11.20.3, we have identified three new SNRs. Previously, this field was thought to contain only two SNRs. The integrated spectral indices of the new SNRs: A: G11.150.71, B: G11.030.05, and C: G11.18+0.11 range from to . Two of the new SNRs (G11.030.05 and G11.18+0.11) have confusing H ii regions nearby (along the line of sight) that are not spatially resolved from the SNRs at the resolution of the Bonn 2695 MHz survey, and this fact is likely responsible for their not having been previously identified. We have also confirmed the low frequency spectral turnover in the integrated radio continuum spectra of G11.20.3 and G11.40.1 previously observed by Kassim (1989a) that is due to free-free absorption along the line of sight. The addition of our new data suggest that the optical depths toward these SNRs at 74 MHz are 0.56 for G11.20.3 and 1.1 for G11.40.1. The upper limits for the 74 MHz integrated flux densities for the three new SNRs also suggest that these remnants suffer from absorption. While quite uncertain, a recent formulation of the relation predicts a nearly correct distance to G11.20.3 (6 kpc) and distances of 9, 24, 16, and 17, kpc for G11.40.1, G11.150.71, G11.030.05, and G11.18+0.11, respectively.
Based on this “test field” we can say with confidence that high surface brightness sensitivity combined with high spatial resolution low frequency radio observations are an effective tool in the quest to find the “missing” Galactic SNRs – at least the more evolved ones. While single dish surveys have been invaluable for finding the majority of SNRs known today, they are ineffective at finding faint, older remnants due to confusion with the Galactic background synchrotron emission, SNRs that are confused with thermal sources, and young small SNRs due to insufficient resolution. Interferometers overcome these problems by resolving out the Galactic background while providing high surface brightness sensitivity (assuming the inclusion of short spacing data) and high spatial resolution. Indeed, with the VLA data presented here we have more than doubled the number of SNRs in a deg2 field of view.
However, the addition of new SNRs in a single deg2 field is insufficient to determine whether the selection effects mentioned above can, in fact, account for all the missing remnants, or whether there is a significant missing link in our understanding of the SNR production rate. In order to obtain a better statistical sample we are currently carrying out a wider survey from to along the Galactic plane at 330 MHz using the VLA in its B, C, and D configurations. The resulting images will have mJy beam-1 sensitivity and resolution. In combination with the planned extension of the FIRST survey at 1465 MHz to this region of the Galactic plane (R. Becker, private communication), we should be able to go a long way towards answering this question.
References
- Anantharamaiah (1985) Anantharamaiah, K. R. 1985, Journal of Astrophysics and Astronomy, 6, 203
- Anantharamaiah (1986) Anantharamaiah, K. R. 1986, Journal of Astrophysics and Astronomy, 7, 131
- Arzoumanian, Chernoff, & Cordes (2002) Arzoumanian, Z., Chernoff, D. F., & Cordes, J. M. 2002, ApJ, 568, 289
- Bronfman, Nyman, & May (1996) Bronfman, L., Nyman, L.-A., & May, J. 1996, A&AS, 115, 81
- Case & Bhattacharya (1998) Case, G. L. & Bhattacharya, D. 1998, ApJ, 504, 761
- Caswell et al. (1975) Caswell, J. L., Clark, D. H., Crawford, D. F., & Green, A. J. 1975, Australian Journal of Physics Astrophysical Supplement, 37, 1
- Clark & Stephenson (1977) Clark, D. H. & Stephenson, F. R. 1977, Oxford [Eng.] ; New York : Pergamon Press, 1977. 1st ed.,
- Cohen & Green (2001) Cohen, M. & Green, A. J. 2001, MNRAS, 325, 531
- Cordes & Lazio (2003) Cordes, J. M. & Lazio, T. J. 2003, ASTRO-PH/0301598v1
- Cornwell & Perley (1992) Cornwell, T. J. & Perley, R. A. 1992, A&A, 261, 353
- Dubner et al. (1993) Dubner, G. M., Moffett, D. A., Goss, W. M., & Winkler, P. F. 1993, AJ, 105, 2251
- Dubner et al. (2000) Dubner, G. M., Velázquez, P. F., Goss, W. M., & Holdaway, M. A. 2000, AJ, 120, 1933
- Dulk & Slee (1975) Dulk, G. A. & Slee, O. B. 1975, ApJ, 199, 61
- Green (1991) Green, D. A. 1991, PASP, 103, 209
- Green (2002) Green, D. A. 2002, VizieR Online Data Catalog, 7227
- Green et al. (1988) Green, D. A., Gull, S. F., Tan, S. M., & Simon, A. J. B. 1988, MNRAS, 231, 735
- Heiles, Reach, & Koo (1996) Heiles, C., Reach, W. T., & Koo, B. 1996, ApJ, 466, 191
- Helfand et al. (1989) Helfand, D. J., Velusamy, T., Becker, R. H., & Lockman, F. J. 1989, ApJ, 341, 151
- Jun & Jones (1999) Jun, B. & Jones, T. W. 1999, ApJ, 511, 774
- Kaspi et al. (2001) Kaspi, V. M., Roberts, M. E., Vasisht, G., Gotthelf, E. V., Pivovaroff, M., & Kawai, N. 2001, ApJ, 560, 371
- Kassim (1989a) Kassim, N. E. 1989, ApJ, 347, 915
- Kassim (1989b) Kassim, N. E. 1989, ApJS, 71, 799
- Kassim (1992) Kassim, N. E. 1992, ApJ, 103, 943
- Kassim et al. (2003) Kassim, N. E. 2003, in prep.
- Kassim & Weiler (1990) Kassim, N. E. & Weiler, K. W. 1990, ApJ, 360, 184
- Koo, Heiles, & Reach (1992) Koo, B., Heiles, C., & Reach, W. T. 1992, ApJ, 390, 108
- Kothes & Reich (2001) Kothes, R. & Reich, W. 2001, A&A, 372, 627
- Kovalenko, Pynzar’, & Udal’Tsov (1994) Kovalenko, A. V., Pynzar’, A. V., & Udal’Tsov, V. A. 1994, Astronomy Reports, 38, 95
- Kramer et al. (2003) Kramer, M., Lyne, A. G., Hobbs, G., Löhmer, O., Carr, P., Jordan, C., & Woszczan, A. 2003, ApJ, 593, L31
- Kulkarni & Heiles (1987) Kulkarni, S. R. & Heiles, C. 1987, ASSL Vol. 134: Interstellar Processes, 87
- Kurtz, Churchwell, & Wood (1994) Kurtz, S., Churchwell, E., & Wood, D. O. S. 1994, ApJS, 91, 659
- Lacey et al. (2001) Lacey, C. K., Lazio, T. J. W., Kassim, N. E., Duric, N., Briggs, D. S., & Dyer, K. K. 2001, ApJ, 559, 954
- LaRosa et al. (2000) LaRosa, T. N., Kassim, N. E., Lazio, T. J. W., & Hyman, S. D. 2000, AJ, 119, 207
- Li et al. (1991) Li, Z., Wheeler, J. C., Bash, F. N., & Jefferys, W. H. 1991, ApJ, 378, 93
- Lockman (1989) Lockman, F. J. 1989, ApJS, 71, 469
- Moffett & Reynolds (1994) Moffett, D. A. & Reynolds, S. P. 1994, ApJ, 437, 705
- Morris et al. (2002) Morris, D. J. et al. 2002, MNRAS, 335, 275
- Morsi & Reich (1987) Morsi, H. W. & Reich, W. 1987, A&AS, 71, 189
- Pankonin & Downes (1976) Pankonin, V. & Downes, D. 1976, A&A, 47, 303
- Price et al. (2001) Price, S. D., Egan, M. P., Carey, S. J., Mizuno, D. R., & Kuchar, T. A. 2001, AJ, 121, 2819
- Radhakrishnan et al. (1972) Radhakrishnan, V., Goss, W. M., Murray, J. D., & Brooks, J. W. 1972, ApJS, 24, 49
- Reach & Rho (1999) Reach, W. T. & Rho, J. 1999, ApJ, 511, 836
- Reach et al. (2002) Reach, W. T., Rho, J., Jarrett, T. H., & Lagage, P. 2002, ApJ, 564, 302
- Reich et al. (2001) Reich, W., Furst, E., Steffen, P., Reif, K., & Haslam, C. G. T. 2001, VizieR Online Data Catalog, 405, 80197
- Reich, Reich, & Furst (1997) Reich, W., Reich, P., & Furst, E. 1997, VizieR Online Data Catalog, 408, 30539
- Roberts, Romani, & Kawai (2001) Roberts, M. S. E., Romani, R. W., & Kawai, N. 2001, ApJS, 133, 451
- Roberts et al. (2003) Roberts, M. S. E., Tam, C. R., Kaspi, V. M., Lyutikov, M., Vasisht, G., Pivovaroff, M., Gotthelf, E. V., & Kawai, N. 2003, ApJ, 588, 992
- Solomon et al. (1987) Solomon, P. M., Rivolo, A. R., Barrett, J., & Yahil, A. 1987, ApJ, 319, 730
- Tam, Roberts, & Kaspi (2002) Tam, C., Roberts, M. S. E., & Kaspi, V. M. 2002, ApJ, 572, 202
- Tammann, Loeffler, & Schroeder (1994) Tammann, G. A., Loeffler, W., & Schroeder, A. 1994, ApJS, 92, 487
- Taylor & Cordes (1993) Taylor, J. H. & Cordes, J. M. 1993, ApJ, 411, 674
- Torii et al. (1997) Torii, K., Tsunemi, H., Dotani, T., & Mitsuda, K. 1997, ApJ, 489, L145
- Vasisht et al. (1996) Vasisht, G., Aoki, T., Dotani, T., Kulkarni, S. R., & Nagase, F. 1996, ApJ, 456, L59
- Walsh et al. (1998) Walsh, A. J., Burton, M. G., Hyland, A. R., & Robinson, G. 1998, MNRAS, 301, 640
- Whiteoak & Green (1996) Whiteoak, J. B. Z. & Green, A. J. 1996, A&AS, 118, 329


| Date | Instrument | Config. | Bandwidth | Time a |
|---|---|---|---|---|
| (MHz) | (Hours) | |||
| 74/330 MHz parameters | ||||
| 2001 Jan 13 | VLA | A | — /3 | 4.4 |
| 2001 Mar 1 | VLA | B | 1.5/3 | 1.7 |
| 2002 Aug 20 | VLA | B | — /12 | 1.5 |
| 2001 Aug 28 | VLA | C | 1.5/3 | 0.75 |
| 2001 Sep 28 | VLA | D | 1.5/3 | 1.7 |
| 235 MHz parameters | ||||
| 2001 Sep 23 b | GRMT | - | 16 | 1.5 |
| 2002 May 05 | GMRT | - | 8 | 0.5 |
| 1465 MHz parameters | ||||
| 2001 Jun 27 | VLA | CnB | 25 | 0.3 |
| 2001 Aug 03 | VLA | C | 25 | 0.3 |
| 2001 Sep 24 | VLA | DnC | 25 | 0.3 |
| Source Name | a | distanceb | rangec | |||
|---|---|---|---|---|---|---|
| Jy | (arcmin) | (W m-2 Hz Sr-1) | (kpc) | (kpc) | ||
| G11.20.3 | 19.3d | 4.5 | 6 | 410 | ||
| G11.40.1 | 7.0 | 9 | 614 | |||
| G11.150.71 (A) | 0.6 | 24 | 1740 | |||
| G11.030.05 (B) | 1.6 | 16 | 1227 | |||
| G11.18+0.11 (C) | 1.5 | 17 | 1228 |