The three spectral regimes found in the stellar black hole XTE J1550–564 in its high/soft state
Abstract
The present paper describes the analysis of multiple RXTE/PCA data of the black hole binary with superluminal jet, XTE J, acquired during its 1999–2000 outburst. The X-ray spectra show features typical of the high/soft spectral state, and can approximately be described by an optically thick disk spectrum plus a power-law tail. Three distinct spectral regimes, named standard regime, anomalous regime, and apparently standard regime, have been found from the entire set of the observed spectra. When the X-ray luminosity is well below (assuming a distance of 5 kpc), XTE J resides in the standard regime, where the soft spectral component dominates the power-law component and the observed disk inner radius is kept constant. When the luminosity exceeds the critical luminosity, the apparently standard regime is realized, where luminosity of the optically thick disk rises less steeply with the temperature, and the spectral shape is moderately distorted from that of the standard accretion disk. In this regime, radial temperature gradient of the disk has been found to be flatter than that of the standard accretion disk. The results of the apparently standard regime are suggestive of a slim disk (e.g., Abramowicz et al. 1988, Watarai et al. 2000) which is a solution predicted under high mass accretion rate. In the intermediate anomalous regime, the spectrum becomes much harder, and the disk inner radius derived using a simple disk model spectrum apparently varies significantly with time. These properties can be explained as a result of significant thermal inverse Comptonization of the disk photons, as was found from GRO J in its anomalous regime by Kubota, Makishima and Ebisawa (2001).
1 Introduction
In a close binary consisting of a mass accreting stellar-mass black hole and a mass donating normal star, the accreting matter releases its gravitational energy as X-ray radiation. When the mass accretion rate is high, such a black hole binary is usually found in a so-called high/soft state, of which X-ray spectrum is characterized by a very soft component accompanied by a power-law tail. As described, e.g., by Makishima et al. (1986), the soft spectral component is interpreted as thermal emission from an optically thick accretion disk around the black hole, as it can be well reproduced by a multi-color disk model (MCD model; Mitsuda et al. 1984). This model approximates a spectrum from a standard accretion disk (Shakura & Sunyaev 1973). The MCD model has two spectral parameters; the maximum disk color temperature, , and the apparent disk inner radius, ; the latter can be related to the true inner radius, , via a correction for spectral hardening (Shimura & Takahara 1997) and a boundary condition (Kubota et al. 1998). As the disk luminosity changes significantly, the value of is usually observed to remain constant at the innermost Keplerian orbit for the black hole, where is the gravitational radius (e.g., Ebisawa et al. 1993).
Although this “standard picture” is successful for many of the high/soft-state black hole binaries (e.g., Tanaka & Lewin 1995; McClintock & Remillard 2003), it has been pointed out theoretically that the standard disk can be stable only over a limited range of . Actually, a series of new solutions to the accretion flow have been discovered, including a slim disk solution, which takes advective cooling into account (Abramowicz et al. 1988; Watarai et al. 2000). In addition, a “very high state” has been observationally found as a derivative state from the soft state (Miyamoto et al. 1991; van der Klis 1994). Characterized by an enhanced hard component and significant variations in both and , the very high state is regarded as a possible violation of the simple-minded standard-disk picture.
A clue to this problem has been recently given by Kubota, Makishima, & Ebisawa (2001; hereafter Paper I) from an analysis of the multiple RXTE/PCA data of the black hole transient with superluminal jet, GRO J. While the source behavior was described adequately by the standard-disk picture over some period (called standard regime) of the entire PCA data span, the other period was characterized by the previously suggested deviation from such a standard behavior (called anomalous regime). The enhanced hard X-ray spectrum in the anomalous regime has been interpreted successfully as a result of significant inverse Compton scattering of the disk photons by some high energy electrons. The inner radius of the underlying optically thick disk has been found to be kept constant, when the effect of the Comptonization is taken into account. This result has been reinforced by Kobayashi et al. (2003).
In order to reinforce the view obtained from GRO J, and to deepen our understanding of the physics of accretion under high values of , the RXTE data of the X-ray transient XTE J is analyzed in this paper. This transient source was discovered on 1998 September 7 by RXTE/ASM and CGRO/BATSE (Wilson et al. 1998, Smith 1998), and now confirmed as a superluminal jet source (Hannikainen et al. 2001). Figure 1 shows a lightcurve of this source, obtained with the RXTE/ASM. As indicated with down-arrows in this figure, this outburst was continuously monitored by the RXTE pointing observations through 1999 May 20. Optical observations have established that the system consists of a late type sub giant (G8IV to K4III) and a black hole, the latter having a dynamical mass of –11.2 (Orosz et al. 2002). The binary inclination angle and the distance to the source are estimated to be – and –7.6 kpc, respectively. In this paper, is used as a crude estimate, and its distance is denoted as kpc.
In §2, the observation and data reduction are briefly described. In §3, the PCA spectra are analyzed using the canonical MCD plus power-law model, leading to the identification of three characteristic regimes; standard regime, anomalous regime, and apparently standard regime, in the increasing order of the luminosity. It is confirmed in §4 that the spectra in the anomalous regime can be well explained by the strong inverse Compton scattering, as found in Paper I. In §5, the apparently standard regime spectra are characterized in terms of the radial temperature gradient of the optically-thick disk, with a conclusion that a slim disk is probably realized.
2 Observation and data reduction
As indicated with down-arrows in Fig. 1, the entire outburst was covered by 184 pointing observations with RXTE; the obtained data was analyzed in a standard way by Sobczak et al. (2000). By analyzing the outburst rise phase (40 days in Fig .1) covered by 14 pointing observations, Wilson & Done (2001) reported that this source experienced a significant spectral evolution. Figure 1 in their paper shows that the power-law photon index describing the PCA spectra below keV switched from 1.4–1.7 to 2–3, which are typical of the low/hard state (e.g., Tanaka 1997), and the high/soft or very high state (e.g., Grove et al. 1998), respectively. Meanwhile, the 20–100 keV portion of the spectrum maintained a convex shape. Therefore, the source is inferred to have made a spectral transition from the low/hard state into the very high state (Wilson & Done 2001), or into the anomalous regime defined in Paper I, rather than into the canonical high/soft state wherein the spectrum above 20 keV would not exhibit any cutoff.
These published results indicate that the spectra acquired during the first days of the outburst is possibly related to development of the optically thick accretion disk; in response to a sudden increase in , an optically thick accretion disk developed inward and reached the last stable orbit. Also the data after day 225 (1999 April 20) shows characteristics of the low/hard state. Therefore, the present paper focuses on the data taken from 128 PCA pointing observations between day 43 (1998 October 20) and 224 (1999 April 19), which are thought to represent relatively steady states with high . For the systematic analyses of all the data set, the HEXTE data is not analyzed here because of poor statistics in some pointings.
Following the standard procedure for bright sources, good PCA data was selected and processed. The data was excluded when the target elevation angle was less than above the Earth’s Limb, or when the actual pointing direction was more than away from the pointed direction. In particular, the data was discarded if it was acquired within 30 minutes after the spacecraft passage through South Atlantic Anomaly. The selected data from the individual proportional counter units was co-added and used for spectral analyses. The standard dead time correction procedure was applied to the data. The PCA background was estimated for each observation, using the software package pcabackest (version 2.1e), supplied by the RXTE Guest Observer’s Facility at NASA/GSFC. Sometimes, the use of pcabackest resulted in an overestimate of the PCA background up to . Such a systematic over-estimate was corrected in the same way as in Paper I. That is, the on-source spectra were compared to the predicted model background spectra in the hardest energy band (80 keV), where the signal flux is usually negligible. If necessary, the normalization factor of the background spectrum was changed. The PCA response matrix was made for each observation by utilizing the software package pcarsp (version 7.10). In order to take into account the calibration uncertainties, 1% systematic errors are added to the data. Over the 20–35 keV range, the systematic errors are increased to 10%, to cope with the response uncertainties associated with the Xe-K edge at keV. Although this could be an overestimate, the 20–35 keV data is utilized only in §4, and the results remain essentially unchanged even if it is reduced to 2 %.
3 Standard modeling of the PCA spectra
3.1 Characterization of the observed spectra
The 3–20 keV PCA spectra of XTE J were analyzed by employing the canonical MCD plus power-law model. The two constituent continuum components were subjected to common photoelectric absorption, with the column fixed at , which is reasonable for the source distance of 5 kpc and its Galactic position of . The following results are not affected by changing the value of to . The data requires additionally an absorption edge to the power-law component around 7–9 keV in terms of a smeared edge model (Ebisawa et al. 1994) and a narrow Gaussian line around 6.5–6.7 keV for the Fe-K line.
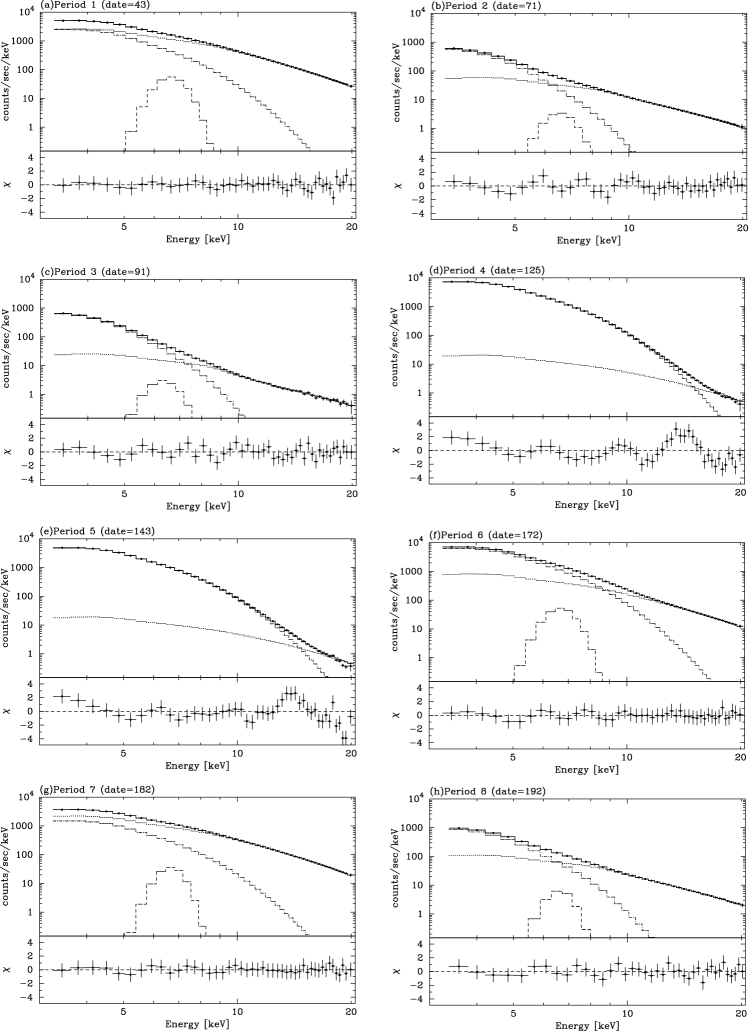
Figure 2 shows time histories of the best-fit model parameters, including the disk bolometric luminosity (Mitsuda et al. 1984; Makishima et al. 1986), the 1–100 keV power-law luminosity calculated assuming an isotropic emission and their sum, . Along the time history, the entire observational span can be divided into the following eight periods (Periods 1–8 denoted in Fig. 2a) of relatively distinct properties, by mainly referring to the behavior of and .
-
•
Periods 1 and 7 are characterized by dominance of and significant reductions in .
-
•
In Periods 2 and 8, decreases keeping rather low, while remains rather large and constant.
-
•
In Period 3, gradually increases, but remains negligible. The power-law component is too weak to constrain its photon index . It is therefore fixed at .
-
•
In Periods 4 and 5, is negligible (hence being still fixed at 2.0), while saturates at ; this is about of the Eddington limit, , for a black hole of .
-
•
Period 6 may be intermediate between Periods 5 and 7.
Typical spectra representing these periods are shown in Fig. 3, and their best-fit parameters are given in Table 1. The fits are acceptable for the data in Periods 1, 2, and 6–8, but sometimes unacceptable in Periods 3–5 (Fig. 2e). This problem is considered again in §5.
3.2 Observed three spectral regimes
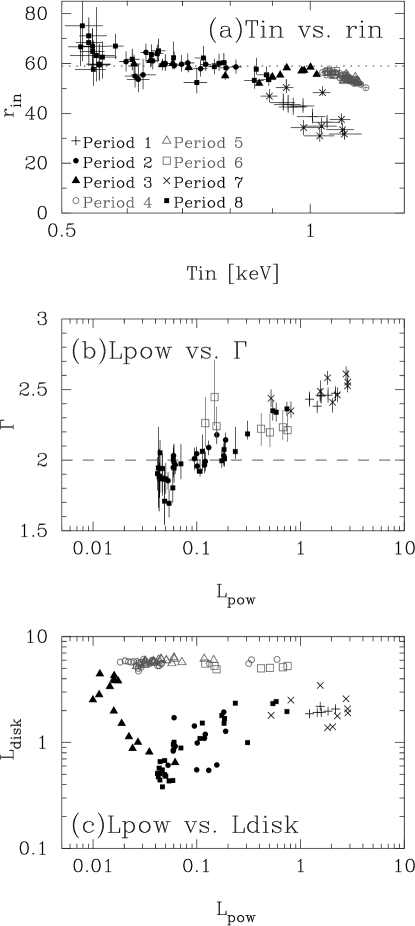
To examine each Period for the validity of the standard picture, Fig. 4 shows several scatter plots between the spectral parameters. The data points of Periods 2, 3, and 8 are thus confirmed to satisfy the standard picture, because is therein kept constant at km while changes significantly, 0.5–1 keV (Fig. 2, Fig. 4a). By taking into account a correction factor for the boundary condition of (Kubota et al. 1998) and a color hardening factor of (Shimura & Takahara 1997), the true inner radius is estimated as km. This value seems to be slightly smaller than for a 10 black hole, 90 km, though the source distance is not well constrained.
The data points in Period 1 and 7 clearly violate the standard picture. Even though the fits are acceptable (Fig. 2e), is observed to change significantly over 30–50 km (Fig. 2c), and shows strong positive deviation from their long-term trend (Fig. 2b). In these Periods, the hard component dominates the MCD component (Fig. 2a), and values of are largest among these eight Periods (Fig. 2b). All these properties make Periods 1 and 7 reminiscent of the anomalous regime of GRO J (Paper I).
The classification of Period 4–6 is somewhat ambiguous. The hard emission is negligible (Fig. 2a), and the spectral shape is similar to those in the standard regime (Fig. 3). However, as is clear from Fig. 2a, the data suffers from a strong saturation in . In addition, a slight increase of under the saturation in gives rise to a slight decrease in (Fig. 4a). In this sense, Periods 4–6 are called the apparently standard regime in this paper. Thus, XTE J exhibits three characteristic spectral regimes, the standard (Periods 2, 3, 8), apparently standard (4, 5, 6), and anomalous (1, 7) regimes.
The - diagram, presented in Fig. 4c, can be used to understand the spectral evolution. The entire span of this source is found to show a clockwise loop; starting from a highest- point (Period 1; anomalous regime), the source moves to the left along a low- branch (Period 2; standard regime), then increases in with kept low (Period 3; standard regime), and reaches a ceiling at , . It then moves to the right (Periods 4, 5 and 6; apparently standard regime). Finally, in Period 7 (anomalous regime), it returns to nearly the same position as Period 1, with Period 8 (standard regime) being a simple repetition of Period 2. Thus, the source fortunately exhibited a complete one cycle.
Figure 5a shows a - diagram, which is useful to examine the validity of the standard picture against luminosity. A simple relation of means the constancy of (see also Fig 4a), and hence the goodness of the standard picture. In this diagram, the data points in the standard regime indeed satisfy this relation, while those in the anomalous regime deviate significantly. The data points in the apparently standard regime, clustered at the uppermost end of the diagram, deviate weakly from the standard relation, exhibiting a flatter dependence of on as .
It is useful to note here that the overall spectral shape of the MCD model well describes emission from a standard disk, even though it ignores the inner boundary condition of the disk. As long as the PCA spectra of –2 keV are concerned, the values of and (with the corrections mentioned before) agree with 4–5 % with those obtained by a more accurate model, e.g., a diskpn model (Gierliski et al. 1999; Gierliski & Done 2003) in xspec. Therefore, the characteristics shown in Fig. 4–5, are not due to incompleteness of the MCD model but mean that the anomalous regime and the apparently standard regime are intrinsically different from the standard regime.
4 Reanalyses of the anomalous regime data
– confirmation of the strong inverse Compton scattering –
Now that Period 1 and 7 have been inferred to be the anomalous regime, these data can be reanalyzed employing the concept of the strong disk Comptonization which successfully explains the anomalous regime of GRO J (Paper I). In the case of GRO J, the hard component in the anomalous regime has been found to be different in behavior from the power-law tail of the standard regime, in several points, including negative correlation between and , and systematically higher values of . It is hence argued in Paper I that in the anomalous regime the spectrum is contributed significantly by a third spectral component, which is harder than the MCD emission but softer than the power-law tail in the standard regime. The strong anti-correlation between and has been taken for evidence that this third component strongly and negatively correlates with the MCD component. It is therefore natural to assume that a fraction of the photons from the optically thick accretion disk are converted into the third spectral component, most probably through inverse Compton scattering by high energy electrons which may reside somewhere around the disk.
Following Paper I, the PCA spectra in the anomalous regime of XTE J are re-fitted with a three-component model, obtained by adding a Comptonized component to the original two component model. In this paper, a thermal Comptonization model (thcomp; Zycki, Done, & Smith 1999 ) is utilized to reproduce the Comptonized component, instead of the Comptonized blackbody model (compbb; Nishimura, Mitsuda, & Itoh 1986) which was used in Paper I. The thcomp model is based on a solution of the Kompaneets equation (Lightman & Zdziarski 1987). It well describes thermal cutoff around the electron temperature of the plasma, , and allows the MCD model to be used as a seed photon spectrum. In contrast, the compbb model is useable only energies below , and it assumes a single temperature black body emission as a seed photon spectrum. The thcomp model has actually improved the fit goodness compared to the compbb model because of difference in the seed photon spectra. The main results of the present paper are however independent of such modelings, and same results were obtained by using the compbb model. In this subsection, the 3–50 keV data is used to better constrain the wide-band spectral shape.
For the spectral fitting, many of the model parameters were fixed to default values after Paper I. Namely, the maximum color temperature of the seed photons was tied to , to reproduce the situation whereby a part of the original MCD photons are up-scattered. Furthermore, was fixed at a representative value of 20 keV since it could not be constrained and is consistent with that obtained during the first 14 observations by Wilson & Done (2001). Neither a reflection component nor relativistic smearing was added to the model. Hence the free parameters of the thcomp model are two; thcomp photon index which expresses the spectral shape below , and its normalization. Moreover, a value of of the original power-law component was fixed at 2.0. As a result, the additional number of the free parameters for spectral fittings is reduced to only one.
Figure 6 shows the same anomalous-regime spectrum as presented in Fig. 3a, but fitted with the three-component model over the expanded energy range. A solid line represents the additional thcomp component. The fit is acceptable, and the result implies that the dominant hard spectral component is mostly produced by the strong disk Comptonization. The re-estimated values of for all the data in the anomalous regime are plotted again in Fig. 2b with open triangles. By considering the disk Comptonization, the highly deviated data points in terms of have thus settled back to a smooth long-term trend as was already found in GRO J (Paper I). The luminosity is also re-estimated in Fig. 5b as , where is the estimated 0.01–100 keV thcomp luminosity, assuming an isotropic emission. Thus, plotted against the revised approximately recovers the standard relation for optically-thick accretion disks.
The value of is difficult to be estimated precisely under the strong Comptonization, because of uncertainties of both geometry and optical depth, , of the cloud. In the present paper, it is approximately calculated by referring to observed photon flux and a re-estimated value of , on an assumption that few photons are scattered back into the optically thick disk and hence the number of the observed photons is conserved through inverse Compton scatterings. Details of this procedure are described in Appendix-A. The re-estimated values of , plotted in Fig. 2c with open triangles, now appear to remain almost stable at km. Consequently, the optically thick accretion disk can also be considered to remain relatively stable, even when a significant fraction of the MCD photons are Comptonized. Therefore, the picture of disk Comptonization is reconfirmed in the anomalous regime, as suggested in GRO J (Paper I; Kobayashi et al. 2003).
Table 2 summarizes the best-fit parameters associated with the exemplified spectra in the anomalous regime. The value of implies a -parameter of , or calculated via a following formula (e.g., Sunyaev & Titarchuk 1980) assuming keV;
| (1) |
The derived parameters are similar to those of GRO J. The smallness of and is consistent with the comparatively small fraction of relative to , typically . It is also consistent with the assumption made in re-evaluating in Appendix-A and Fig. 5b, that the mean number of scattering is not too large and the fractional energy change is small.
From these results, the anomalous behavior of XTE J observed in Periods 1 and 7 can be identified with that of GRO J in the anomalous regime: the optically-thick standard accretion disk is present, but the Comptonization converts a significant fraction of its emission into the hard component.
5 Reanalyses of the apparently standard regime data
5.1 Properties of the apparently standard regime
As shown in §3, the apparently standard regime corresponds to the most luminous phase of the outburst, and the data in this regime occupies the upper-right region of the - diagram (Fig. 5b). In this regime, gradually changed keeping almost constant at (). As a result, the data points deviate from the standard relation, as . The obtained values of are not constant but become smaller than those in the standard regime, exhibiting a weak correlation with as . Figure 4a clearly shows this behavior.
As seen in Fig. 3, the spectra in the apparently standard regime show a dominant soft component accompanied by a very weak hard tail. Although these properties are similar to that of the standard soft state, the apparently standard regime is something different from the standard regime because of the inconstancy of (or moderate saturation of ), and the absence of the Fe-K line feature that is usually found in the standard regime. Moreover, the canonical spectral model often failed to give acceptable fits to the data (Fig. 2e). As are clearly seen in the residuals of Fig. 3d-e, the discrepancy between the data and the best-fit canonical model appears as a low-energy excess and a spectral hump around 13 keV. This could be a result of fixing of the hard tail component at 2.0; accordingly, the fits were repeated by leaving free to vary. Then, the fits became acceptable, but they required so large values of (see Fig. 2d, Table 1), that the spectrum below keV is mostly accounted for by the power-law component rather than the MCD component; the observed low-energy excess is filled up artificially by the steep power-law. Such a fit could be physically inappropriate.
The above results on the apparently standard regime suggest a subtle difference in the accretion disk configuration from the standard disk, in such a way that the softest end of the observed spectrum is more enhanced than is described by the MCD model. Such a change, in turn, may arise if, e.g., the radiative efficiency of the inner disk region becomes reduced and the radial temperature gradient flattens. In order to quantify this idea, in §5.2 a -free disk model is constructed as a mathematically generalized function of the MCD model. The data in the apparently standard regime is then examined in §5.3 by utilizing this model function.
5.2 Formalism of the -free disk model
The concept of the standard accretion disk assumes that the energy released by accretion is half stored in the Keplerian kinetic energy, and half radiated away as local blackbody emission. As a result, the spectrum of the standard disk can be described as a geometrically-weighted sum of multi-temperature blackbody components of which the local temperature depends as on the distance, , from the central black hole. Therefore, any departure of the physical condition assumed by the standard disk picture will make the radial temperature gradient deviate from the canonical value of . Such a deviation will in turn cause a slight deformation of the radially-integrated X-ray spectra that are observed. In order to quantify this idea, the MCD model is generalized as seen below, after initial attempts by Mineshige et al. (1994, for GS ) and Hirano et al. (1995, for Cyg X-2).
The main assumptions of the model developed here are that a disk local temperature is described by , and that the disk locally emits a blackbody spectrum. Here, is a dimension-less positive parameter introduced to generalize the MCD formalism, with implying the MCD model. The spectrum from this model function can be written as
| (2) |
with being a blackbody spectrum of temperature . For convenience, hereafter this mathematical model function is called -free disk model. As decreases, the spectrum becomes softer than the MCD spectrum of the same , because the radiation from outer parts of the accretion disk is emphasized as seen in equation (2).
5.3 Spectral fitting with the -free disk model
The PCA spectra of Periods 3–5 (one segment of standard regime and two of apparently standard regime) have been re-fitted by replacing the MCD model component with the -free disk model. Although an accurate determination of is difficult when the power-law component is strong, the PCA spectra in Period 3–5 are fortunately free from this obstacle. The condition of spectral fitting is otherwise the same as in §3. That is, the absorption column and of the power-law component are fixed at and 2.0, respectively. The Gaussian line was not included.
The time histories of the obtained -free disk model parameters are given in Fig. 7. In Period 4 and 5 (apparently standard regime), the fit goodness has been significantly improved by allowing free. Figure 8 shows the same apparently standard regime spectrum originally presented in Fig. 2e, fitted this time with the -free disk model, and Table 3 shows the examples of the -free model parameters.
In Fig. 9, the best fit values of are plotted against ; here, instead of the values of obtained by the -free disk model, those by the MCD model are employed, in order to avoid any systematic coupling between and . The dependence of on thus changes at 1 keV. As a function of , increases up to keV (Period 3, the standard regime), beyond which it decreases abruptly and the correlation turns negative (Period 4–5, the apparently standard regime). To examine these results for various systematic effects, the -free disk fits have been extensively repeated by changing the fitting conditions; fixing to instead of , fixing to 2.2 instead of 2.0, including a Gaussian line of which the central energy is constrained to 6.2–6.9 keV. These different conditions slightly affected the absolute values of , but did not affect the characteristic vs. behavior of Fig. 9a.
Thus, the value of has been found to deviate from 3/4 as the source enters deep into the apparently standard regime. However, a still larger excursion of is observed during the standard regime, where should be obtained. Therefore, the changes of in Fig. 9 could partially or entirely be due to some artifacts, and could deviate from 3/4, even if the standard accretion disk is realized. This could actually happens, because the MCD model is a mere approximation of the exact standard-disk solution; the actual temperature gradient of a standard accretion disk must be flatter than near the innermost disk edge, where the temperature will approach zero. As decreases, the limited PCA band pass will sample preferentially the emission from inner disk regions, thus making different from 3/4.
In order to address the above issue, a theoretical approach was first attempted. That is, a number of 3–20 keV PCA spectra were simulated, using two theoretical model spectra in the xspec which are known to be more accurate than the MCD model. One is the diskpn model, which is based on the Shakura-Sunyaev solution in a pseudo-Newtonian potential; it properly takes the inner boundary condition into account. The other is so-called a GRAD model (Hanawa 1989; Ebisawa, Mitsuda, & Hanawa 1991), which considers full general relativistic effects for a Schwarzshild metric. Then, the simulated spectra were fitted with the -free disk model. As a result, both diskpn and GRAD models gave –0.75 as long as is in the range 1.2–1.5 keV. Furthermore, was found to change (over 0.5–1.0) for lower input disk temperature of –1.5 keV. However, the - relation turned out to be quite different between the two input models, and to depend significantly on the inclination angle when the GRAD model is used. In addition to these theoretical complications, neither the diskpn model nor the GRAD model can be considered accurate yet, since they (as well as the MCD model) neglect possible spectral deviation from a pure local blackbody. Accordingly, this approach has been concluded unrealistic.
In this paper, instead, the PCA-determined values of for a standard disk has been calibrated empirically, by using actual spectral data of a prototypical black hole binary, LMC X-3, in the standard regime. This black hole binary perfectly satisfies the standard picture up to for a black hole of 5–7.2 (Paper I, Wilms et al. 2001), and its system inclination angle, 65∘–69∘, is similar to that of XTE J. The -free disk model was applied to the PCA spectra of LMC X-3 obtained by 128 pointed RXTE observations from 1996 February to 1999 January (Kubota 2001). The best fit values of from LMC X-3 are plotted against in Fig. 9b. As expected, a positive correlation between and artificially appears even for this prototypical “standard-disk” object. Therefore, the behavior of XTE J (in Fig. 9a) for keV (Period 3, the standard regime) can be understood as an artifact. In contrast, the behavior of XTE J for keV is clearly distinct from that of LMC X-3. The conclusion is that the temperature gradient of XTE J in Period 4 and 5 becomes intrinsically smaller than in the standard regime, and hence the accretion disk in the apparently standard regime in reality deviates from the standard picture.
6 Discussion
6.1 Overall picture from the observation
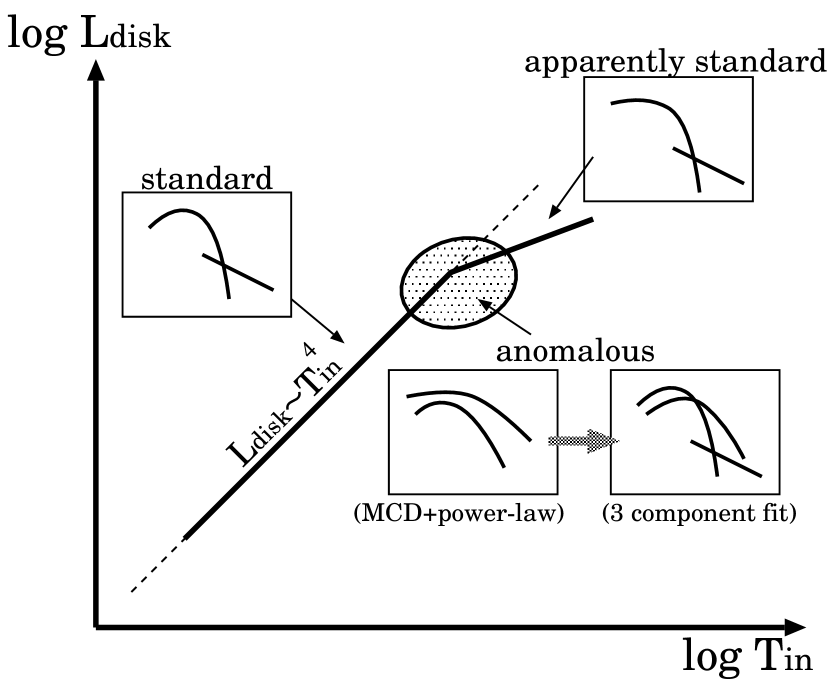
Through the detailed analysis of the PCA data of XTE J, the three spectral regimes have been identified. Their relation on the - plane is illustrated schematically in Fig. 10, while their properties can be summarized as follows.
-
1.
When is well below a certain critical upper-limit luminosity, , the spectral behavior can be explained by the standard-disk picture. This is the standard regime.
-
2.
When hits , it is moderately saturated as , and hence shows a weak correlation to as . Although the spectrum, consisting of a dominant soft component and a weak hard tail, resembles that in the standard regime, the radial temperature gradient in the disk (represented by ) becomes flatter than in the standard disk. This is the apparently standard regime (§5).
-
3.
At an intermediate case (), the spectral hard component dominates, and the apparent inner-disk radius is no longer constant. This is the anomalous regime (§4). These effects can be explained by a sudden increase of the disk Comptonization, while the underlying disk itself remains in the standard state and is kept constant.
-
4.
The source evolves from the standard to apparently standard regimes, then to the anomalous regime, and returns again to the standard regime.
The anomalous regime is naturally identified with that found in GRO J, and the scenario of Comptonization suggested in Paper I successfully applies to XTE J as well. It has been confirmed that the violent variation in in the anomalous regime is apparently caused by strong disk Comptonization, with the underlying optically thick disk extending down to the last stable orbit like in the standard regime. The apparently standard regime is possibly the same as Period 1 of GRO J. Because intensity variation in Period 1 of the source was small, Paper I did not discuss the source behavior in that period. However, GRO J resides in this period in the upper right corner on the - plane (see Paper I), and its spectra consist of a dominant disk component and a very weak hard tail. These properties are basically the same as those of XTE J in the apparently standard regime.
6.2 Comparison with theoretical predictions
As is well known, theoretical solutions to the steady-state accretion flow form an -shaped locus on the plane of vs. the surface density of the disk (e.g., Abramowicz et al. 1988, Chen & Taam 1993, Kato, Fukue, & Mineshige 1998). The locus involves to thermally stable branches; the standard Shakura-Sunyaev accretion disk solution, and the slim-disk solution, realized when is relatively low and very high, respectively. Evidently, the standard regime can be identified with the standard Shakura-Sunyaev solution.
The slim disk solution takes into account the effect of the advection, in addition to the viscous heating and the radiative cooling. This effect becomes important when is high and hence the luminosity is close to . Under this condition, any increase in would be balanced by an increase in the advective transport, accompanied by little increase in ; this agrees with the observed mild saturation in observed in the apparently standard regime. Watarai et al. (2000) simulated many slim disk spectra, fitted them with the MCD model, and derived an empirical relation between and the apparent as (or ). This is exactly what has been observed in Fig. 5a. Furthermore, Watarai et al. (2000) showed that the temperature gradient becomes flatter as the advective cooling becomes important because of a progressive suppression of disk emissivity. In the extreme case, can reduce to 0.5. Thus, the overall source behavior in the apparently standard regime agrees very well with the prediction by the slim disk model. Of course, this state assignment is still tentative, because the slim disk solution still neglects important effects such as general relativity, magnetic field, and photon trapping (Ohsuga et al. 2002). Other solutions would have to be considered as well.
In addition to the two stable branchs, a thermally and secularly unstable branch is known to exist between them. This branch is recognized as a negative slope on the -shape sequence. By comparing the obtained - diagram to the -shape sequence, the anomalous regime may have some relation to the unstable branch of the sequence. In other words, the instability of the standard disk may cause the anomalous regime. Interestingly, the quasi-periodic oscillations (QPOs) are observed preferentially in the anomalous regime, in GRO J (Remillard et al. 1999) and XTE J (Remillard et al. 2002). Therefore, the QPO is likely to relate to the existence of the Compton cloud.
The observed three distinctive regimes are likely to reflect the change of the accretion disk structure from the standard accretion disk to other solutions, as the radiative cooling becomes progressively inefficient. These results hence provide, at least potentially, one of the first observational accounts of the long predicted -shaped sequence.
The authors would like to thank Hajime Inoue, Shin Mineshige and Chris Done, for their valuable comments. They also thank Kazuhiro Nakazawa, Tsunefumi Mizuno and Ken Ebisawa for their helpful discussions. Thanks are also due to Piotr Zycki and Marek Gierliski for their help with the thcomp and the diskpn models. The authors are grateful to Dave Willis for his reading of this paper, and to the anonymous referee for his/her useful comments. A. K. is supported by Japan Society for the Promotion of Science Postdoctoral Fellowship for Young Scientists.
Appendix A A formula to re-estimate under Comptonization
Under the presence of strong disk Comptonization, the apparent disk inner radius may be calculated as
| (A1) |
where and are 0.01–100 keV photon flux from the direct disk component and the Comptonized component, respectively. Here, refers to the disk temperature obtained by considering the inverse Compton scattering as is done in § 4. The first parentheses is just the same as the normalization factor of the MCD model in the xspec. This formula is based on an assumption that there are few photons which are injected again into the optically thick cool disk (i.e., optical depth of the cloud is not very large). It can be derived through the following steps.
-
1.
Via flux command of the xspec, in the range of 0.01–100 keV is obtained for the MCD spectrum of which and normalization are 1 keV and 1, respectively.
-
2.
According to the Stefan-Boltzmann’s law, photon flux from the original optically thick disk emission is in proportion to .
-
3.
Isotropic emission is assumed for Comptonized photons, and thus is multiplied by .
References
- Abramowicz et al. (1988) Abramowicz, M. A., Czerny, B., Lasota, P., & Szuszkiewicz, E. 1988, ApJ, 332, 646
- (2) Begelman, M. C. 2002, ApJ, 568, L97
- Chen et al. (1993) Chen, X. & Taam, R. E. 1993, ApJ, 412, 254
- Ebisawa et al. (1993) Ebisawa, K., Makino, F., Mitsuda, K., Belloni, T., Cowley, A., Schmidke, P., & Treves, A. 1993, ApJ, 403, 684
- Ebisawa et al. (1991) Ebisawa, K., Mitsuda, K., & Hanawa, T. 1991, ApJ, 367, 213
- Ebisawa et al. (1994) Ebisawa, K., Ogawa, M., Aoki, T., Dotani, T., Takizawa,M., Tanaka, Y., Yoshida, K., Miyamoto, S. et al. 1994, PASJ, 46, 375
- (7) Gammie, C. F., 1998, MNRAS, 297, 929
- (8) Gierliski, M., Zdziarski, A. Z., Poutanen, J., Coppi, P. S., Ebisawa, L., & Johnson, W. N. 1999, MNRAS, 309, 496
- (9) Gierliski, M., & Done, C. 2003, MNRAS, submitted
- Grove et al. (1998) Grove, J. E., Johnson, W. N., Kroeger, R. A., McNaron-Brown, K., Skibo, J. G., & Phlips, B. F. 1998, ApJ, 500, 899
- (11) Hanawa, T. 1989, ApJ, 341, 948
- Hannikainen et al. (2001) Hannikainen, D., Campbell-Wilson, D., Hunstead, R., Mclntyre, V., Lovell, J., Reynolds, J., Tzioumis, T., & Wu, K. 2001, AP&SS, 276, 45
- Hirano et al. (1995) Hirano, A., Kitamoto, S., Yamada, T., Mineshige, S., Fukue, J. 1995, ApJ, 446, 350
- Kato et al. (1998) Kato, S., Fukue, J., Mineshige, S. 1998, Black-hole accretion disks, Kyoto University Press
- Kobayashi et al. (2002) Kobayashi, Y., Kubota. A., Nakazawa, K., Takahashi, T., & Makishima, K. 2003, PASJ, 55, 273
- (16) Krolik, J. 1998, ApJ, 498, L13
- Kubota (2001) Kubota, A. 2001, PhD Thesis, University of Tokyo
- Kubota et al. (2001) Kubota. A., Makishima, K., & Ebisawa, K. 2001, ApJL, 560, 147 (Paper I)
- Kubota et al. (1998) Kubota, A., Tanaka, Y., Makishima, K., Ueda, Y., Dotani, T., Inoue, H., & Yamaoka, K. 1998, PASJ, 50, 667
- Lightman et al. (1987) Lightman, A. P., & Zdziarski, A. A. 1987, ApJ, 319, 643
- (21) McClintock, J. E., & Remillard, R. A. 2003, preprint (astro-ph/0306213)
- Makishima et al. (1986) Makishima, K., Maejima, Y., Mitsuda, K., Bradt, H.V., Remillard, R. A., Tuohy, I. R., Hoshi, R., Nakagawa, M. 1986, ApJ 308, 635
- Mineshige et al. (1994) Mineshige, S., Hirano, A., Kitamoto, S., Yamada, T. 1994, ApJ, 426, 308
- Mitsuda et al. (1984) Mitsuda, K., et al. 1984, PASJ, 36, 741
- Miyamoto et al. (1991) Miyamoto, S., Kimura, K., Kitamoto, S., Dotani, T., Ebisawa, K. 1991, ApJ, 383, 784
- Nishimura et al. (1986) Nishimura, J., Mitsuda, K., & Itoh, M. 1986, PASJ, 38, 819
- Ohsuga et al. (2002) Ohsuga, K., Mineshige, S., Mori, M., Umemura, M. 2002, ApJ 574, 315
- Orosz et al. (2002) Orosz, J. A. et al. 2002, ApJ, 568, 845
- Remillard et al. (1999) Remillard, R. A., Morgan, E. H., McClintock, J. E., Bailyn, C. D., Orosz, J. A. 1999, ApJ, 522, 397
- Remillard et al. (2002) Remillard, R. A., Sobczak, G. J., Muno, M. P., McClintock, J. E. 2002, ApJ, 564, 962
- Shimura et al. (1995) Shimura, T. & Takahara, F. 1995, ApJ, 445, 780
- Shakura et al. (1973) Shakura, N. I., & Sunyaev, R. A. 1973, A&A, 24, 337
- Smith (1998) Smith, D.A. 1998, IAUC 7008
- Sobczak et al. (2000) Sobczak, G. J., McClintock, J. E., Remillard, R. A., Cui, W., Levine, A. M., Morgan, E. H., & Bailyn, C. D. 2000, ApJ, 531, 53
- Sunyaeve et al. (1980) Sunyaev, R. A., & Titarchuk, L. G. 1980, A& A, 86, 121
- Tanak (a1997) Tanaka, Y. 1997, in Accretion Disk - New Aspects, ed E. Meyer-Hofmeister, H. Spruit, Lecture Note in Physics Vol. 487 (Springer-Verlag, Berlin) p1
- Tanaka et al. (1995) Tanaka, Y., & Lewin, W. H. G. 1995, in X-ray Binaries, eds. W. H. G. Lewin, J. van Paradijs, and W. P. J. van den Heuvel (Cambridge University Press, Cambridge), p126
- (38) van der Klis M., 1995, in X-ray Binaries, eds. W. H. G. Lewin, J. van paradijs, and W.P.J. van den Heuvel
- Watarai et al. (2000) Watarai, K., Fukue, J., Takeuchi, M., & Mineshige, S. 2000, PASJ, 52, 133
- Wilms et al. (2001) Wilms, J., Nowak, K., Pottschmidt, W. A., Heindl, W. A., Dove, J. B., & Begelman, M. C. 2001, MNRAS, 320, 327
- Wilson & Done (2001) Wilson, C. D., Done, C. 2001, MNRAS, 325, 167
- Wilson et al. (1998) Wilson, C. A., Harmon, B. A., Paciesas, W. S., & McCollough, M. L. 1998, IAUC 7010
- (43) Zhang, S. N., Cui, W., & Chen, W. 1997, ApJ, 482, L155
- Zycki et al. (1999) Zycki, P. T., Done, C. & Smith, D. A. 1999, MNRAS, 309, 561
| Per. | date a | [keV] | [km]b | [keV] | eqw [eV] | ||||
| 1 | 43 | 2.07 | 2.18 | 15.3/37 | |||||
| 2 | 71 | 0.92 | 0.062 | 21.2/37 | |||||
| 3 | 91 | (2.0 fixed) | 1.01 | 0.027 | 24.9/38 | ||||
| 1.02 | 0.028 | 23.1/37 | |||||||
| 4 | 125 | (2.0 fixed) | 5.80 | 0.022 | — | 94.0/38 | |||
| 5.73 | 0.369 | 18.1/37 | |||||||
| 5 | 143 | (2.0 fixed) | 5.93 | 0.031 | — | 92.8/38 | |||
| 5.61 | 0.834 | 21.4/37 | |||||||
| 6 | 172 | 5.27 | 0.75 | 9.91/37 | |||||
| 7 | 182 | 1.90 | 2.85 | 7.5/37 | |||||
| 8 | 192 | 1.68 | 0.19 | 17.9/37 | |||||
| NOTE.—Errors represent 90% confidence limits. The PCA 3–20 keV spectra are used. For all the spectral fitting, | |||||||||
| the smedge and a Gaussian with fixed keV are included, and is fixed at . | |||||||||
| a Days since 1998 September 7. | |||||||||
| b Apparent inner radii under assumptions of and kpc. | |||||||||
| c and represent the bolometric disk luminosity, 1–100 keV power-law luminosity, | |||||||||
| respectively, in the unit of . As for , is assumed. | |||||||||
| d Upper limit of Gaussian line with fixed keV. | |||||||||
| Per. | date | [keV] | [km] | |||||
| 1 | 43 | 2.29 | 0.70 | 1.27 | 33.6/74 | |||
| 7 | 182 | 2.37 | 0.69 | 1.73 | 34.5/74 | |||
| NOTE.—The PCA 3–50 keV spectra are used. | ||||||||
| a Apparent inner radii re-estimated by equation (2). | ||||||||
| b , , and represent the bolometric disk luminosity, 1–100 keV power-law | ||||||||
| luminosity and bolometric (0.01–100 keV) thcomp luminosity, respectively, all in the | ||||||||
| unit of . Isotropic emission is assumed for and , and | ||||||||
| is assumed for . | ||||||||
| Per. | date | [keV] | eqw [keV] | |||
| 3 | 91 | — | — | 25.4/39 | ||
| 48 | 22.0/37 | |||||
| 4 | 125 | — | — | 54.8/39 | ||
| 45 | 38.9/37 | |||||
| 5 | 143 | — | — | 57.6/39 | ||
| 31 | 47.7/37 | |||||
| NOTE.—The PCA 3–20 keV spectra are used. The power-law photon index is fixed at 2.0. | ||||||