Chapter 0 The First Direct Supernova/GRB Connection: GRB 030329/SN 2003dh
Observations of gamma-ray burst (GRB) afterglows have yielded tantalizing hints that supernovae (SNe) and GRBs are related. The case had been circumstantial, though, relying on irregularities in the light curve or the colors of the afterglow. I will present observations of the optical afterglow of GRB 030329. The early spectra show a power-law continuum, consistent with other GRB afterglows. After approximately one week, broad peaks in the spectrum developed that were remarkably similar to those seen in the spectra of the peculiar Type Ic SN 1998bw. This is the first direct, spectroscopic confirmation that at least some GRBs arise from SNe.
1 Introduction
The mechanism that produces gamma-ray bursts (GRBs) has been the subject of considerable speculation during the four decades since their discovery (see Mészáros 2002 for a recent review of the theories of GRBs). Optical afterglows (e.g., GRB 970228: Groot et al. 1997; van Paradijs et al. 1997) opened a new window on the field (see, e.g., van Paradijs, Kouveliotou, & Wijers 2000). Subsequent studies of other bursts yielded the redshifts of several GRBs (e.g., GRB 970508: Metzger et al. 1997), providing definitive evidence for their cosmological origin.
Models that invoked supernovae (SNe) to explain GRBs were proposed from the very beginning (e.g., Colgate 1968; Woosley 1993; Woosley & MacFadyen 1999). A strong hint was provided by GRB 980425. In this case, no traditional GRB optical afterglow was seen, but a supernova, SN 1998bw, was found in the error box of the GRB (Galama et al. 1998a). The SN was classified as a Type Ic (Patat & Piemonte 1998), but it was unusual, with high expansion velocities (Patat et al. 2001). Other SNe with high expansion velocities (and usually large luminosity as well) such as SN 1997ef and SN 2002ap are sometimes referred to as “hypernovae” (see, e.g., Iwamoto et al. 1998, 2000).
The redshift of a typical GRB is , implying that a supernova component underlying an optical afterglow would be difficult to detect. At , even a bright core-collapse event would peak at mag. Nevertheless, late-time deviations from the power-law decline typically observed for optical afterglows have been seen and these bumps in the light curves have been interpreted as evidence for supernovae (for a recent summary, see Bloom 2003). Perhaps the best evidence that classical, long-duration gamma-ray bursts are generated by core-collapse supernovae was provided by GRB 011121. It was at , so the supernova component would have been relatively bright. A bump in the light curve was observed both from the ground and with HST (Garnavich et al. 2003a; Bloom et al. 2002). The color changes in the light curve of GRB 011121 were also consistent with a supernova (designated SN 2001ke), but a spectrum obtained by Garnavich et al. (2003a) during the time that the bump was apparent did not show any features that could be definitively identified as originating from a supernova. The detection of a clear spectroscopic supernova signature was for the first time reported for the GRB 030329 by Matheson et al. (2003a, 2003b), Garnavich et al. (2003b, 2003c), Chornock et al. (2003), and Stanek et al. (2003a). Hjorth et al. (2003) also presented spectroscopic data obtained with the VLT. In addition, Kawabata et al. (2003) obtained a spectrum of SN 2003dh with the Subaru telescope.
The extremely bright GRB 030329 was detected by instruments aboard HETE II at 11:37:14.67 (UT is used throughout this paper) on 2003 March 29 (Vanderspek et al. 2003). Due to the brightness of the afterglow, observations of the optical transient (OT) were extensive, making it most likely the best-observed afterglow so far. From the moment the low redshift of 0.1685 for the GRB 030329 was announced (Greiner et al. 2003), we started organizing a campaign of spectroscopic and photometric follow-up of the afterglow and later the possible associated supernova. Stanek et al. (2003a) reported the first results of this campaign, namely a clear spectroscopic detection of a SN 1998bw-like supernova in the early spectra, designated SN 2003dh (Garnavich et al. 2003c). In this paper, I describe the evidence for the supernova in the spectroscopy during the first two months. For a more complete discussion, see Matheson et al. (2003c).

2 Spectra
The brightness of the OT allowed us to observe the OT each of the 12 nights between March 30 and April 10 UT, mostly with the MMT 6.5-m, but also with the Magellan 6.5-m, Lick Observatory 3-m, LCO du Pont 2.5-m, and FLWO 1.5-m telescopes. This provided a unique opportunity to look for spectroscopic evolution over many nights. The early spectra of the OT of GRB 030329 (top of Figure 1) consist of a power-law continuum typical of GRB afterglows, with narrow emission features identifiable as H, [O III] 4959, 5007, H, and [O II] 3727 at (Greiner et al. 2003; Caldwell et al. 2003) probably from H II regions in the host galaxy.
Beginning at days, our spectra deviated from the pure power-law continuum. Broad peaks in flux, characteristic of a supernova, appeared. The broad bumps are seen at approximately 5000 Å and 4200 Å (rest frame). At that time, the spectrum of GRB 030329 looked similar to that of the peculiar Type Ic SN 1998bw a week before maximum light (Patat et al. 2001) superposed on a typical afterglow continuum. Over the next few days the SN features became more prominent as the afterglow faded and the SN brightened toward maximum.

Later spectra obtained on April 24.28, May 2.05, May 4.01, and May 24.38 continue to show the characteristics of a supernova. As the power-law continuum of the GRB afterglow fades, the supernova spectrum rises, becoming the dominant component of the overall spectrum (Figure 2).
3 Separating the GRB from the Supernova
To explore the nature of the supernova underlying the OT, we modeled the spectrum as the sum of a power-law continuum and a peculiar Type Ic SN. Specifically, we chose for comparison SN 1998bw (Patat et al. 2001), SN 1997ef (Iwamoto et al. 2000), and SN 2002ap (using our own as yet unpublished spectra, but see, e.g., Kinugasa et al. 2002; Foley et al. 2003). We had 62 spectra of these three SNe, spanning the epochs of seven days before maximum to several weeks past. For the power-law continuum, we chose to use one of our early spectra to represent the afterglow of the GRB. The spectrum at time days was of high signal-to-noise ratio (S/N), and suffers from little fringing at the red end. Therefore, we smoothed this spectrum to provide the fiducial power-law continuum of the OT for our model.
To find the best match with a supernova spectrum, we compared each spectrum of the afterglow with the sum of the fiducial continuum and a spectrum of one of the SNe in the sample. We performed a least-squares fit, allowing the fraction of continuum and SN to vary, finding the best combination of continuum and SN for each of the SN spectra. The minimum least-squares deviation within this set was then taken as the best SN match for that epoch of OT observation. Figure 3 shows the relative contribution to the OT spectrum by the underlying SN in the and bands as a function of .

Within the uncertainties of our fit, the SN fraction is consistent with zero for the first few days after the GRB. At days, the SN begins to appear in the spectrum, without strong evidence for a supernova component before this. When the fit indicates the presence of a supernova, the best match is almost always SN 1998bw. The only exceptions to this are from nights when the spectrum of the OT are extremely noisy, implying that less weight should be given to those results. The least-squares deviation for the spectra that do not match SN 1998bw is also much larger.
Our best spectrum (i.e., with the highest S/N) from this time when the SN features begin to appear is at days. For that epoch, our best fit is 74% continuum and 26% SN 1998bw (at day relative to SN -band maximum). The next-best fit is SN 1998bw at day 7. Using a different early epoch to define the reference continuum does not alter these results significantly. It causes slight changes in the relative percentages, but the same SN spectrum still produces the best fit, albeit with a larger least-squares deviation.
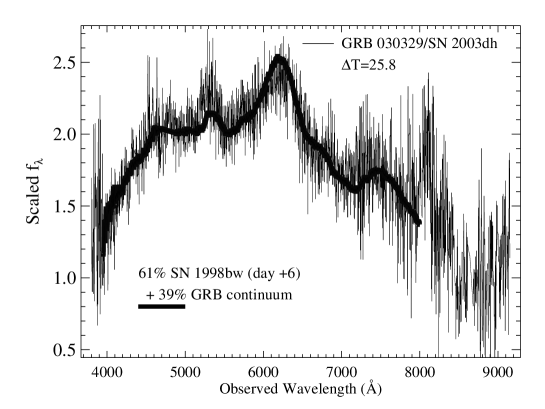
The SN fraction contributing to the total spectrum increases steadily with time. By days, the SN fraction is 61%, with the best-fit SN being SN 1998bw at day +6 (Figure 4). The SN percentage at days is still about 63%, but the best match is now SN 1998bw at day +13. The rest-frame time difference between days and days is 13.8 days (). For the best-fit SN spectra from those epochs, SN 1998bw at day 6 and SN 1998bw at day +6 respectively, the time difference is 12 days. The rest-frame time difference between days and days is 6.7 days, with a time difference between the best-fit spectra for those epochs of 7 days. The spectral evolution determined from these fits indicates that SN 2003dh follows SN 1998bw closely, and it is not as similar to SN 1997ef or SN 2002ap. The analysis by Kawabata et al. (2003) of their May 10 spectrum gives a phase for the spectrum of SN 2003dh that is consistent with our dates, although they do consider SN 1997ef as a viable alternative to SN 1998bw as a match for the SN component in the afterglow.
The spectra of SN 1998bw (and other highly energetic SNe) are not simple to interpret. The high expansion velocities result in many overlapping lines so that identification of specific line features is problematic for the early phases of spectral evolution (see, e.g., Iwamoto et al. 1998; Stathakis et al. 2000; Nakamura et al. 2001; Patat et al. 2001). This includes spectra up to two weeks after maximum, approximately the same epochs covered by our spectra of SN 2003dh. In fact, as Iwamoto et al. (1998) showed, the spectra at these phases do not show line features. The peaks in the spectra are due to gaps in opacity, not individual spectral lines. Detailed modeling of the spectra can reveal some aspects of the composition of the ejecta (Mazzali et al. 2003).
If the days spectrum for the afterglow does match SN 1998bw at day 6, then limits can be placed on the timing of the supernova explosion relative to the GRB. The rest-frame time for days is 8.2 days, implying that the time of the GRB would correspond to 14 days before maximum for the SN. The rise times of SNe Ic are not well determined, especially for the small subset of peculiar ones. Stritzinger et al. (2002) found the rise time of the Type Ib/c SN 1999ex was 18 days (in the band), while Richmond et al. (1996) reported a rise time of 12 days (in the band) for the Type Ic SN 1994I. A rise time of 14 days for SN 2003dh is certainly a reasonable number. It also makes it extremely unlikely that the SN exploded significantly earlier or later than the time of the GRB, most likely within days of the GRB itself.

The totality of data contained in this paper allows us to attempt to decompose the light curve of the OT into the supernova and the afterglow (power-law) component. From the spectral decomposition procedure described above, we have the fraction of light in the -bands for both components at various times, assuming that the spectrum of the afterglow did not evolve since days. As we find that the spectral evolution is remarkably close to that of SN 1998bw, we model the -band supernova component with the -band light curve of SN 1998bw (Galama et al. 1998a, b) stretched by and shifted in magnitude to obtain a good fit. The afterglow component is fit by using the early points starting at days with late points obtained via the spectral decomposition. This can be done in both in the and in the -band and leads to consistent results, indicating that our assumption of the afterglow not evolving in color at later times is indeed valid.
The result of the decomposition of the OT -band light curve into the supernova and the power-law continuum is shown in Figure 5. The overall fit is remarkably good, given the assumptions (such as using the stretched -band light curve of SN 1998bw as a proxy for the SN 2003dh -band light curve). No time offset between the supernova and the GRB was applied, and given how good the fit is, we decided not to explore time offset as an additional parameter. Introducing such an additional parameter would most likely result in a somewhat better fit (indeed, we find that to be the case for days), but this could easily be an artifact with no physical significance, purely due to small differences between SN 1998bw and SN 2003dh. At this point the assumption that the GRB and the SN happened at the same time seems most natural.
4 Summary
The spectroscopy of the optical afterglow of GRB 030329, as first shown by Stanek et al. (2003a), provided direct evidence that at least some of the long-burst GRBs are related to core-collapse SNe. We have shown with a larger set of data that the SN component is similar to SN 1998bw, an unusual Type Ic SN. It is not clear yet whether all long-burst GRBs arise from SNe. Catching another GRB at a redshift this low is unlikely, but large telescopes may be able to discern SNe in some of the relatively nearby bursts. With this one example, though, we now have solid evidence that some GRBs and SNe have the same progenitors.
Acknowledgments Kris Stanek and Peter Garnavich were very supportive and equal colleagues in the research described here. I would like to thank the many observers who sacrificed their time to observe this GRB (see Matheson et al. 2003c for a full list).
References
- Bloom, J. S., 2003, in Gamma-Ray Bursts in the Afterglow Era, ed. M. Feroci et al. (San Francisco: ASP), 1.
- Bloom, J. S., et al., 2002, Astrophys. J., 572, L45.
- Caldwell, N., Garnavich, P., Holland, S., Matheson, T., & Stanek, K.Z., 2003, GCN Circ. 2053.
- Chornock, R., Foley, R. J., Filippenko, A. V., Papenkova, M., & Weisz, D., 2003, GCN Circ. 2131.
- Colgate, S. A., 1968, Canadian J. Phys., 46, 476.
- Foley, R. J., et al., 2003, Pub. Astron. Soc. Pac., in press (astro-ph/0307136).
- Galama, T. J., et al., 1998a, Nature, 395, 670.
- Galama, T. J., et al., 1998b, Astrophys. J., 497, L13.
- Garnavich, P. M., et al., 2003a, Astrophys. J., 582, 924.
- Garnavich, P., et al.. 2003b, IAU Circ. 8108.
- Garnavich, P., Matheson, T., Olszewski, E. W., Harding, P., & Stanek, K. Z., 2003c, IAU Circ. 8114.
- Greiner, J., et al., 2003, GCN Circ. 2020.
- Groot, P. J., et al., 1997, IAU Circ. 6584.
- Hjorth, J., et al., 2003, Nature, 423, 847.
- Iwamoto, K., et al., 1998, Nature, 395, 672.
- Iwamoto, K., et al., 2000, Astrophys. J., 534, 660.
- Kawabata, K. S., et al., 2003, Astrophys. J.l, 593, L19.
- Kinugasa, K., et al., 2002, Astrophys. J., 577, L97.
- Matheson, T., et al., 2003a, GCN Circ. 2107.
- Matheson, T., et al., 2003b, GCN Circ. 2120.
- Matheson, T., et al., 2003c, Astrophys. J., in press (astro-ph/0307435).
- Mazzali, P. A., et al., 2003, Astrophys. J., submitted (astro-ph/0309555).
- Mészáros, P., 2002, Ann. Rev. Astron. Astrophys., 40, 137.
- Metzger, M. R., et al., 1997, Nature, 387, 878.
- Nakamura, T., Mazzali, P. A., Nomoto, K., & Iwamoto, K., 2001, Astrophys. J., 550, 991.
- Patat, F., & Piemonte A., 1998, IAU Circ. 6918.
- Patat, F., et al., 2001, Astrophys. J., 555, 900.
- Richmond, M. W., et al., 1996, Astron. J., 111, 327.
- Stanek, K. Z., et al., 2003a, Astrophys. J., 591, L17.
- Stathakis, R. A., et al., 2000, Mon. Not. R. Astr. Soc., 314, 807.
- Stritzinger, M., et al., 2002, Astron. J., 124, 2100.
- Vanderspek, R., et al., 2003, GCN Circ. 1997.
- van Paradijs, J., Kouveliotou, C., & Wijers, R. A. M. J., 2000, Ann. Rev. Astron. Astrophys., 38, 379.
- van Paradijs, J., et al., 1997, Nature, 386, 686.
- Woosley, S. E., 1993, Astrophys. J., 405, 273.
- Woosley, S. E., & MacFadyen, A. I., 1999, Astron. Astrophys., 138, 499.