The H II Regions of the Damped Lyman Absorber SBS 1543+593111Based on observations made with the NASA/ESA Hubble Space Telescope obtained from the Space Telescope Science Institute, which is operated by the Association of Universities for Research in Astronomy, Inc., under NASA contract NAS 5-26555.
Abstract
We report new imaging and spectroscopic observations of the damped Ly (DLA) galaxy SBS 1543+593, a nearby dwarf galaxy whose stellar disk is intersected by the sightline to the bright background QSO HS 1543+5921. Hubble Space Telescope imaging observations with WFPC2 in the F450W and F702W bands are used to measure the DLA galaxy’s properties and compile a catalog of its (candidate) H II regions. Ground-based long-slit spectroscopy of the brightest H II region in the galaxy yields estimates of the star formation rate (SFR) and of chemical abundances in the galaxy’s interstellar medium. We find that SBS 1543+593 exhibits a SFR yr-1, or a SFR per unit area of yr-1 kpc-2. We derive gas-phase abundances in the ionized gas of , which is about 1/3 of the solar value, and . These values are consistent with the morphologial appearance of SBS 1543+593, an Sm dwarf of and of intermediate surface brightness. SBS 1543+593 is the first bona fide DLA for which abundances have been measured using emission-line diagnostics. When compared with future, high-resolution, ultraviolet spectroscopy, our results should prove key for interpreting abundance determinations in high redshift DLAs.
1 Introduction
Originally classified as a Seyfert galaxy, SBS 1543+593 was in fact shown by Reimers & Hagen (1998) to be the chance superposition of a nearby () galaxy and a background () QSO, HS 1543+5921, discovered independently in the course of the Hamburg Quasar Survey. The QSO sightline intersects the galaxy only 2.4 arcsec ( kpc) from its center.111Throughout this paper we use km s-1 Mpc-1, where is the Hubble constant.
More recently, this interesting galaxy-QSO pair has been studied in detail by Bowen, Tripp, & Jenkins (2001a) and Bowen et al. (2001b). Ultraviolet spectroscopy with the Hubble Space Telescope (HST) revealed that the galaxy produces a damped Ly (DLA) absorption system in the spectrum of the QSO, with a neutral hydrogen column density (H I) [where (H I) is in units of cm-2]. From ground-based imaging, Bowen et al. (2001a) measured a central surface brightness mag arcsec-2 and an exponential scale-length arcsec ( kpc); integrating over the surface brightness profile they deduced a total magnitude , which in turn corresponds to an absolute magnitude . Radio observations of the 21 cm emission line (Bowen et al. 2001b) yielded a systemic heliocentric velocity km s-1 and an H I mass ; the dynamical mass is more than twice the neutral gas mass. From all of these properties, Bowen et al. concluded that SBS 1543+593 is low surface brightness (LSB) dwarf spiral galaxy.
The idea that dwarf and LSB galaxies are responsible for at least some DLAs was originally proposed by York et al. (1996) and subsequently re-examined by several authors (e.g. Jimenez, Bowen, & Matteucci 1999; Boissier, Péroux, & Pettini 2002). Observationally, this has now been confirmed in a number of cases, at least at redshifts . In particular, Rao & Turnshek (2000) have successfully identified many low-redshift DLA systems, and are in the process of studying them with direct imaging (e.g., Turnshek et al. 2001; Nestor et al. 2002; Rao et al. 2003 and references therein). Indeed, many turn out to be dwarf and/or LSB galaxies. The combination of low absorber redshift, small impact parameter, and brightness of the background QSO (, Reimers & Hagen 1998) makes SBS 1543+539 a highly promising system for investigating the all-important DLA-galaxy connection in greater detail than is possible in more distant examples.222 To our knowledge, SBS 1543+539 is the second lowest DLA galaxy cataloged up to now. The closest example is the NGC 4203 ( km s-1)–Ton 1480 () pair (Miller, Knezek, & Bregman 1999), but the QSO in this case is mag fainter than HS 1543+5921 in the -band. Furthermore, the QSO-galaxy impact parameter is kpc, nearly 20 times greater than that of SBS 1543+539–HS 1543+5921. Of course, any galaxy which presents a cross-section in H I absorption greater than (H I) cm-2 (the historical limit defining DLAs) is capable of being a DLA galaxy. However, a background source is required to produce a continuum against which this H I column can be measured.
More generally, SBS 1543+539 offers one of the best opportunities to compare element abundances measured from emission lines in H II regions with those from cool interstellar gas producing absorption lines. This is a very important consistency check, as we now explain. Essentially all available information on chemical abundances at high redshifts is from QSO absorption line studies—data from other techniques are still very few and of limited accuracy (Pettini 2003). Conversely, most of what we know about the chemical composition of galaxies in the nearby universe is based on measurements of nebular lines from star-forming regions (e.g. Garnett 2003). While in the Milky Way and the Magellanic Clouds these two different lines of enquiry give consistent results, there has so far been very little opportunity to compare them in other environments, at either high or low redshift. Relevant to this point is the suggestion by Kunth & Sargent (1986) that the H II regions of metal-poor galaxies may be self-polluted with metals produced in the immediate past and not yet mixed in the general interstellar medium (ISM). One such example may be the Blue Compact Dwarf (BCD) galaxy I Zw 18, but opinions are still divided as to whether the O/H ratio measured from interstellar absorption lines is lower than the value found in the H II regions (Kunth et al. 1994; Pettini & Lipman 1995; Aloisi et al. 2003; Lecavalier des Etangs et al. 2003). In the Lyman break galaxy MS 1512-cB58, Pettini et al. (2002) found good agreement between the oxygen abundance measured from nebular emission lines and the interstellar abundances of other -capture elements, although nitrogen was apparently discrepant.
The SBS 1543+539–HS 1543+5921 pairing gives us the means to address these issues with a modest amount of observational effort and with fewer complications than I Zw 18, where the interstellar absorption lines are viewed against the (spatially extended) background of a stellar cluster which is located within the galaxy, rather than a point source behind it. In anticipation of forthcoming ultraviolet spectroscopy of HS 1543+5921 with sufficient resolution for abundance determinations, we present new imaging and spectroscopic observations of SBS 1543+539 aimed at obtaining additional information about its properties not already covered in the studies by Bowen et al. (2001a,b). In particular, we report the first measurements of O and N abundances in one of the H II regions of the galaxy. The outline of the paper is as follows. In §2 we describe the observations which consist of HST WFPC2 imaging and ground-based optical spectroscopy. In §3 we present our main results: the galaxy’s H II region luminosity function (§3.1), its star formation rate (§3.2) and element abundances (§3.3). These are compared with similar results for nearby dwarf galaxies and high redshift DLAs in §4. In §5 we draw attention to specific problems which can be addressed by comparing the data presented here for SBS 1543+539 with those which will be obtained from absorption line studies of its neutral interstellar medium. Finally, we summarize our main conclusions in §6.
2 Observations and Data Processing
2.1 Imaging
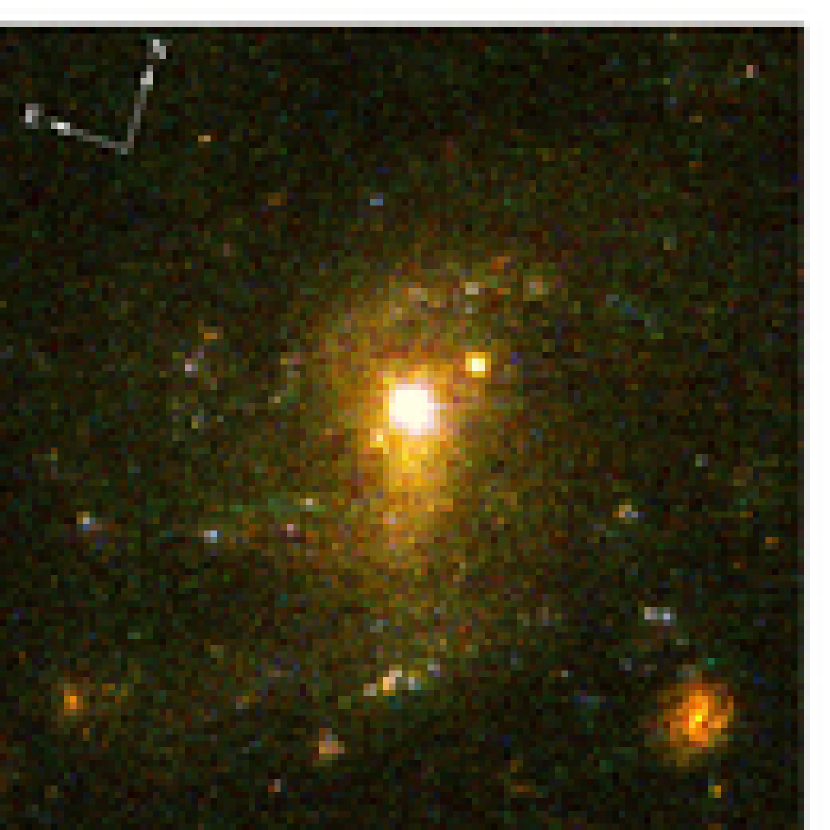
We imaged the field of SBS 1543+593 with the Wide Field and Planetary Camera (WFPC2) on HST on 20 September 2000 as part of our GO program 8570. The galaxy was located on the WF3 chip. Exposures were obtained through the following filters: F225W (4000 s), F336W (3000 s), F450W (1000 s), and F702W (1000 s). Figure 1 is a greyscale reproduction333A colour version of this figure is available in the electronic version of the paper. of an image formed by combining data from all four filters with the following color coding: red=F702W, green=F450W, and blue=F336W+F255W. As well as the QSO HS 1543+5921, a foreground star (to the north-west of the QSO), and several background galaxies, the image shows the faint spiral arms of SBS 1543+593 traced by a number of spatially extended objects which are likely to be H II regions.
We used the F450W and F702W images to identify and measure the properties of these H II regions. The F450W and F702W observations each consisted of two 500 s exposures, spatially offset from each other by a small amount. To obtain the final image for each filter, the two exposures were registered and then combined; pixels affected by cosmic-ray events were removed in the process. We decided to transform the HST magnitudes derived from the F450W and F702W images to Johnson-Cousins magnitudes and color (Dolphin 2000), so that our results could be compared more easily with others in the literature.
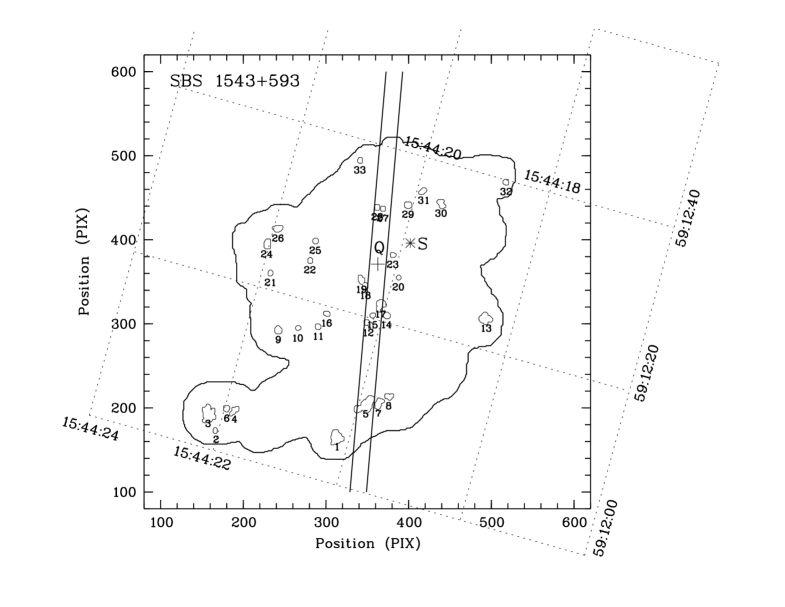
The H II regions were identified using the deeper F702W image. This was accomplished by first subtracting the backgound signal, selecting a threshold magnitude of mag arcsec-2 for the analysis, and smoothing the image using 3x3 pixel averaging. The MIDAS AIP software package was then used to generate a catalog of spatially extended objects. Regions smaller than 4 pixels (with areas arcsec-2) were subsequently rejected from the catalog. We then inspected the original image by eye to verify that the identified regions had the location and appearance of H II regions in SBS 1543+593. Figure 2 shows the final F702W image and an AIP-derived outer isophote for the galaxy corresponding to an HST magnitude mag arcsec-2. Identified H II regions are labeled in Figure 2 and listed in Table 1 in order of increasing “y” pixel position. Our final catalog comprises 33 likely H II regions. Note that the bright region observed spectroscopically by Reimers & Hagen (1998) corresponds to our region #5, but these authors may have also included flux from region #7 in their spectrum. The mask derived from the F702W image was then applied to the F450W image for the corresponding analysis.
For each of the regions, Table 1 gives an identifying number, WF3 x-y pixel coordinates, RA and Dec coordinates derived from the IRAF/STSDAS package METRIC, the magnitude and color, errors, and parameters describing the sizes and shapes of the H II regions (area, semi-major axis, minor-to-major axis ratio, and position angle). Table 1 should be considered a list of candidate H II regions, because we cannot definitively discern the objects’ true nature (i.e., whether they are background galaxies, star clusters, or H II regions) based on magnitude and color information alone. On the other hand, most of them are likely to be H II regions; certainly this is the case for all the objects covered by our spectroscopic observations described below.
We also determined the total magnitude of the galaxy (within the 26.8 mag arcsec-2 isophote shown on Figure 2) after subtracting the QSO and the star. We found R and . The errors quoted here are total errors and include the photometric and background errors, the errors from the subtraction of the quasar and foreground star, errors for transformation to Johnson-Cousins and , and zero point errors. The total magnitude error is dominated by the errors in the subtraction of the QSO and the star. Of course the magnitudes quoted also depend on the surface brightness level to which they are measured. Thus, our total -band magnitude is significantly brighter than that determined by Reimers & Hagen (1998), who measured to the 24 mag arcsec-2 isophote, but is in good agreement with the value of derived by Bowen et al. (2001a) from their fit to the surface-brightness profile.
From Schlegel, Finkbeiner, & Davis (1998) we find that the Galactic foreground extinctions are relatively small, and .
2.2 Spectroscopy
Spectroscopic observations of the QSO and some H II regions in SBS 1543+593 were obtained in service mode with the double-beam Cassegrain spectrograph (ISIS) of the 4.2 m William Herschel Telescope (WHT) on La Palma, Canary Islands, and with the Blue Channel spectrograph of the 6.5 m Multiple Mirror Telescope (MMT). In all cases we used a 2 wide slit; other details of the observations are collected in Table 2.
Figure 2 shows the location of the slit overlaid on the contour map of the galaxy. We attempted to maintain this same slit location for all spectroscopic observations and were aided in this by the presence of the QSO. However, we have no way of estimating uncertainties in the emission line fluxes which may result from small differences in slit positioning and from seeing fluctuations. The slit was oriented at position angle PA = 10.5 degrees east of north, so as to include the QSO and the brightest H II region in SBS 1543+593 (region #5). This precluded us from observing at the parallactic angle. As can be seen from Figure 2, with this orientation we also covered four other H II regions, in two close pairs (#12, #15, and #27, #28 respectively); however, each member of the pair is not resolved.
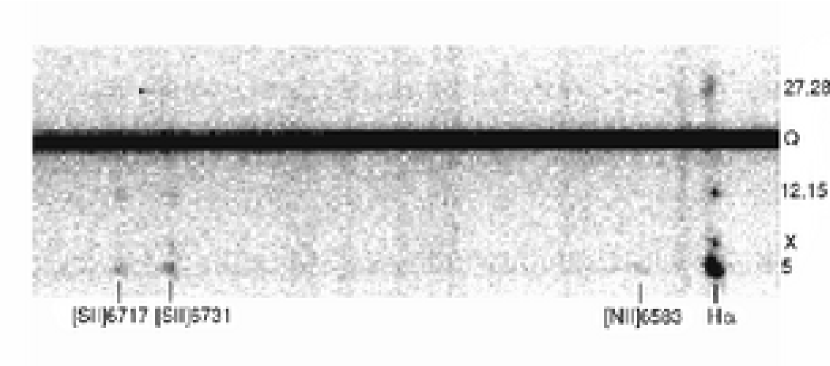
In Figure 3 we have reproduced a portion of the two-dimensional ISIS red spectrum covering the H, [N II] , and [S II] emission lines. H II regions and the QSO are marked on the -axis. Interestingly, in addition to the H II regions targeted, we also detect emission lines from a previously unrecognized source, labeled “X” in Figure 3, 2.9 to the north of region #5. There is no evidence of this H II region in the HST F702W image (see Figure 1), nor in the unfiltered STIS image obtained by Bowen et al. (2001a).
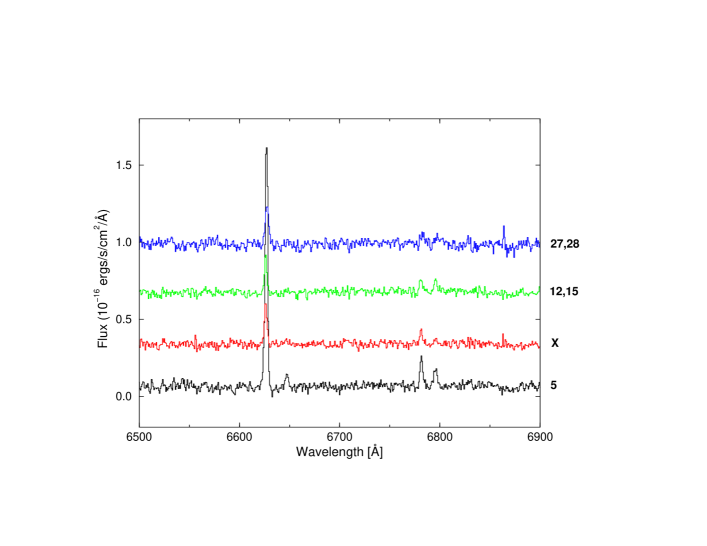
The spectra were reduced using standard techniques in IRAF; this included bias substraction, flat fielding, sky subtraction, and wavelength calibration. The acquisition of the ISIS red spectrum was accompanied by observations of two standard stars, G138-31 and Kopff 27. Both stars were observed through a 6 wide slit, under the same seeing conditions as the object, 1 FWHM, and at low airmass (1.06). We chose G138-31 for the flux calibration. However, in order to investigate systematic errors due to the flux calibration, we compared the fluxes derived, both for the QSO and H II region #5, using the other standard star available, Kopff 27. We found that the QSO flux is 15% lower at the blue end when calibrated with Kopff 27, and that this offset reduces to 4% at the red end of the spectrum. Thus, we estimate the systematic flux error at H for H II region #5 to be 5%. One dimensional extractions of the H II region spectra are reproduced in Figure 4.
Figure 5 shows the ISIS spectrum of H II region #5 obtained with the blue arm of ISIS. It includes the H line and the [O III] doublet (H II region #5 is the only one in which these lines are detected in our blue spectra). Data obtained over two nights were combined to derive the final calibrated spectrum. The individual spectra were calibrated relative to the standard star BD +17 4708, which was observed on both nights under similar seeing conditions, through a 2 wide slit, and at low airmass (1.0). Note, however, that the observations of SBS 1543+593 were obtained at higher airmasses, 1.5 and 2.0 on the two nights respectively (see Table 2). Under these conditions we expect significant atmospheric dispersion, but the effect is likely to be negligible over the small wavelength interval between the emission lines of interest, i.e., H and [O III] . The temperature sensitive [O III] line remains undetected in H II region #5, despite the long exposure time of 10 000 s (see Figure 5).
Any systematic offset in the flux calibrations of the blue and red spectra will affect the measured ratio of H to H, needed to estimate the internal reddening of H II region #5, and the determination of the nitrogen-to-oxygen ratio. Unfortunately, there is no wavelength overlap between the ISIS red spectrum obtained on April 25, 2000 and the ISIS blue spectra recorded on June 12 & 13, 2001. We tried to interpolate across this wavelength gap using the spectral energy distribution of the QSO, but its rich iron spectrum makes judging the location of the continuum difficult. Thus, we are unable to provide a quantitative assessment of systematic flux errors; our best guess is that the offset between the red and the blue spectra is no larger than 15%.
The ISIS blue spectra do not extend to sufficiently short wavelengths to include the [O II] emission line. For this reason, we obtained an additional short exposure with the Blue Channel of the MMT spectrograph; the one-dimensional spectrum is shown in Figure 6. The conditions were not photometric and we did not obtain a standard-star observation during this night. However, there is substantial overlap in the spectral coverage of the MMT and the WHT spectra. We calibrated the MMT spectrum with reference to the WHT one, by forcing the fluxes of the emission lines in common (H and [O III]) to agree between the two sets of observations (the observed mean ratio for the three emission lines in common was ).
The rest frame fluxes of all the emission lines detected are collected in Table 3. The flux errors quoted are random errors only. They reflect the error in the continuum underlying the line; a upper limit is given for lines that were not detected.
In addition, the spectroscopy enabled us to make an independent determination of the redshift of SBS 1543+593. The observed wavelengths of the emission lines are listed in Table 3. We derive a mean redshift of for SBS 1543+593, which is the same as the value measured by Bowen et al. (2001b) from 21 cm emission.
3 Results
3.1 Properties of the H II Regions of SBS 1543+539
The H II regions are tracers of the young stellar population in SBS 1543+539. They are scattered throughout the disk of SBS 1543+539. The stars in the disk are not resolved. The yellow-reddish color of the unresolved disk light indicates that an older and more contiguous stellar population underlies the sprinkling of H II regions (see Figure 1). The light of the unresolved stars, together with the distribution of H II regions, trace a spiral arm-like pattern. We therefore classify this galaxy as a type Sm. According to the definitions by de Vaucouleurs (1959) and Sandage & Bingelli (1984), Sm galaxies are the latest-type dwarfs in which some fragmentary traces of a spiral pattern are still present, while dwarfs of even later type are classified as Im. The latter are galaxies that have a totally chaotic appearance, but the differences are really quite subtle. (Panel 21 in Sandage & Bingelli 1984 also serves to illustrate the appearance of high surface brightness BCDs, such as I Zw 18; a comparison with Panels 12–17 shows clearly how different BCDs are from Sm/Im galaxies).
With the caveat that not all of the candidates listed in Table 1 may turn out to be H II regions, it is instructive to consider their global properties, for comparison with those of other nearby galaxies (§4.2). A color-magnitude plot of the candidate H II regions listed in Table 1 indicates that there are four objects with colors or magnitudes which lie outside the main distribution. It is possible that these extended objects were erroneously considered to be candidate H II regions in SBS 1543+539. In what follows, we assume a value of for the total number of H II regions in SBS 1543+539.
Following equation (1) of Kennicutt, Edgar & Hodge (1989), the -band luminosity function (LF) of the candidate H II regions was fitted by a power-law with slope . The luminosity function is complete down to . If we interpret the -magnitude as an H flux (by simply scaling the -magnitude by a factor of ), then the slope becomes . The brightest H II region, #5, has an H luminosity of ergs s-1 (§3.2). This is the luminosity of quite an ordinary H II region; it is, for example, a factor of lower than the H luminosity of a giant H II region like 30 Doradus in the LMC. H II region #5, is also the most extended one in SBS 1543+539 (see Table 1), with a diameter of 1.9 arcsec which translates to a linear size of about 390 pc (see §4.1). The faintest H II regions for which we believe to be complete have luminosities of about ergs s-1.
3.2 Star Formation Rates
We can use the H emission line fluxes from the H II regions observed spectroscopically to estimate star formation rates, as follows. The heliocentric velocity of SBS 1543+539, measured from 21 cm (Bowen et al. 2001b) and optical emission lines (§2.2) is km s-1. Correcting for the motion of the Sun relative to the local standard of rest (LSR), and for the rotation of the LSR about the centre of the galaxy, we obtain a galactocentric velocity km s-1. Ignoring peculiar velocities giving rise to departures from the Hubble flow, this corresponds to a distance Mpc. At this distance, the H emission line fluxes listed in Table 3 correspond to the following H luminosities: ergs s-1 (H II region #5); ergs s-1 (object X); ergs s-1 (H II regions #12,15); and ergs s-1 (H II regions #27,28).
With Kennicutt’s (1998) H–SFR calibration
| (1) |
we obtain SFR = (9.1, 1.4, 1.2, 1.9) yr-1 for the four regions respectively.
The total -band luminosity of all 33 H II regions is a factor of times that of H II regions #5,12,15,27,28. Thus, we can obtain an approximate estimate of the total SFR in SBS 1543+539 by assuming that the -band to H luminosity ratios are roughly the same for all 33 candidate H II regions. This assumption could be questioned because, for example, object X is not detected in , but it may be approximately valid when all the H II regions are considered together. With this scaling, we estimate that the total H luminosity of SBS 1543+539 is ergs s-1 which corresponds to a total SFR yr-1.
3.3 Element Abundances
In this section we use the emission line fluxes listed in Table 3 to deduce the nebular abundances of oxygen and nitrogen in H II region #5. Normally, the first step is to correct the line fluxes for effects of dust reddening. However, in our case the ratio (H)/(H) is smaller (although consistent within the error) than the case B recombination value of 2.86 for the ‘standard’ cm-3 and K H II region density and temperature (Osterbrock 1989). Evidently, the reddening of H II region #5 is small and we therefore neglect it in the calculation of nebular abundances. [The foreground Galactic reddening of E() = 0.016 determined from the maps by Schlegel, Finkbeiner, & Davis (1998) is also inconsequential].
3.3.1 Oxygen
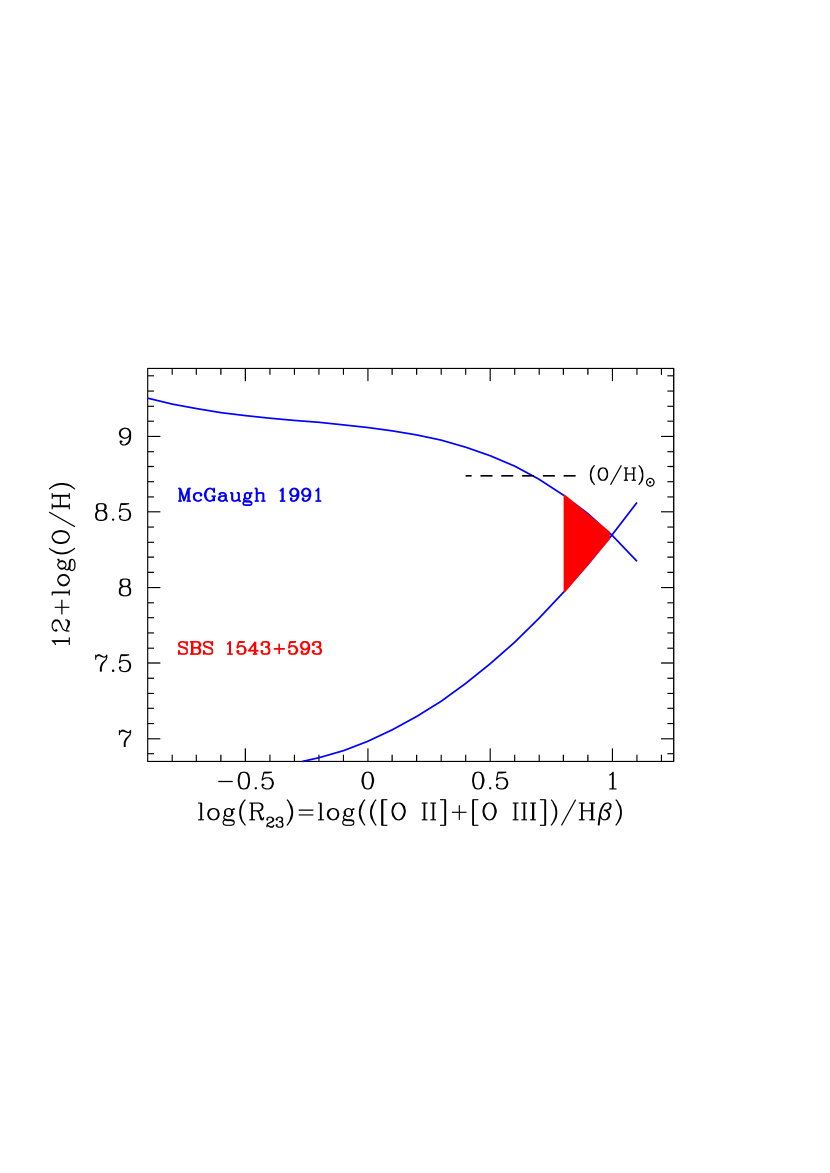
Approximate estimates of the oxygen abundance in H II regions have traditionally been obtained from the strong line index which relates (O/H) to the relative intensities of [O II] , [O III] , and H (Pagel et al. 1979). Recent reassessments by Skillman, Côté, & Miller (2003) and Kennicutt, Bresolin, & Garnett (2003) have shown that the resulting values of (O/H) are typically accurate to within dex. In deriving the oxygen abundance we have made use of the most recent formulation by Kobulnicky, Kennicutt, & Pizagno (1999) of the analytical expressions by McGaugh (1991); these formulae express (O/H) in terms of and the ionization index . The results are illustrated in Figure 7 which shows the well-known double-valued nature of the relation. However, in this case the high value of () corresponds to the region of the diagram where the upper and lower branches of the relation meet. Taking into account the random errors in both the and indices (calculated by propagating the errors listed in Table 3), we obtain values of which range from 7.96 to 8.61, or . These in turn correspond to oxygen abundances of between 1/6 and 3/4 of solar ([O/H] to ) adopting the value from the recent reappraisal of solar photospheric abundances by Holweger (2001).
More recently, Kewley & Dopita (2002) have used a combination of stellar population synthesis and photoionization models to develop a set of ionization parameter and abundance diagnostics which are also based on the use of the strong optical emission lines. They claim that because their techniques solve explicitly for both the ionization parameter and the chemical abundance, their diagnostics are an improvement over earlier methods, such as . Applying their algorithms to our measurements in Table 3, we obtain , dex lower than our previous estimate.
We can also use the scaling relation between the parameter (H) and the oxygen abundance recently proposed by Denicoló, Terlevich & Terlevich (2002) to obtain an independent estimate of (O/H) from the relative strengths of [N II] and H. Their equation
| (2) |
yields . The quoted error here includes both the random error in our measurement of the index and the errors quoted in eq. (2). The latter are from a least-squares fit to data of Denicoló et al. (2002), which extend over an oxygen abundance range from 1/50 of solar to twice solar, and thus are an indication of the scatter of the data from the best-fit calibration. We place high confidence in our determination of the oxygen abundance with the index, because the [N II] and H lines were measured from the same spectrum. Moreover, this spectrum was recorded at low airmass (see §2.2). However, we note that the oxygen abundance derived using the index is in good agreement with the values obtained above using the ratios of [O II], [O III], and H, even though these emission lines were measured from different spectra obtained under less-than-optimal conditions.
Thus, taking all of the above into account, our best estimate of the oxygen abundance in H II region #5 is .
3.3.2 Nitrogen
Thurston, Edmunds, & Henry (1996) have used grids of photoionization models to develop a new algorithm for estimating N abundances based only on observations of the strong [N II], [O II], and [O III] lines. Unfortunately, their method cannot be applied here because their photoionization models do not extend to values of , as found in H II region #5. Instead, we followed van Zee et al. (1998) in using the value of the oxygen abundance deduced above to estimate the electron temperature and the corresponding ionization correction. Specifically, for the large sample of H II regions studied by van Zee et al. and Kobulnicky, Kennicutt, & Pizagno (1999), an oxygen abundance of corresponds to K. Using the software by Shaw & Dufour (1995), which is built on the five-level atom program FIVEL and implemented in the STSDAS NEBULAR package, we found that the [S II] line ratio implies a density cm-3. With these values of and , the task IONIC then gives the abundance of N+. With ionization corrections derived from eq. (13)–(15) of Izotov, Thuan, & Lipovetsky (1994), we finally obtain where the first source of error arises from the uncertainty in , while the second is due to the measurement errors in the fluxes of the H and [N II] emission lines listed in Table 3.
Adding these two errors in quadrature, we conclude that in H II region #5 of SBS 1543+539 is between and , or between and of the solar (Holweger 2001).
4 Comparative Analysis of the Properties of SBS 1543+539
4.1 Summary of Derived Properties
We confirm the dwarf galaxy nature of SBS 1543+593. We find total magnitudes corrected for Galactic foreground extinction of and .444These and all subsequent values are for our adopted value of the Hubble constant km s-1 Mpc-1; we have dropped the scaling factor for simplicity. At a distance Mpc, an angular size of 1″ corresponds to 208 pc; thus the area subtended by the galaxy on the sky, 974 arcsec2, goes together with a physical area of about 42 kpc2. Our estimate of the galaxy’s star formation rate, yr-1, then corresponds to a SFR per unit area of yr-1 kpc-2, and to a gas consumption timescale of Gyr adopting the H I mass determined by Bowen et al. (2001b). The H I column density seen on the sightline to HS 1543+5921 translates into a (near-)central H I surface density of pc-2 for SBS 1543+539. The ratio is (in solar units). SBS 1543+593 contains about 33 H II regions. The H II regions’ H luminosity function can be fitted with a power law with slope . The brightest H II region in SBS 1543+593 has a relatively modest H luminosity of ergs s-1, only that of 30 Doradus in the LMC. It is about 390 pc in diameter. In this region we estimate the oxygen abundance to be and .
4.2 Comparison with Local Dwarfs
Star-forming dwarf galaxies exhibit a wide range of central surface brightnesses, ranging from galaxies brighter than 22 mag arcsec-2, usually identified as BCDs, to low surface brightness galaxies which include both dwarf Irregular and dwarf Spiral galaxies. With an absolute magnitude , SBS 1543+539 is certainly a dwarf galaxy, times fainter than (adopting from Norberg et al. 2002). It is, however, near the borderline between high- and low-surface brightness galaxies conventionally taken to be at a central surface brightness of 23.0 mag arcsec-2 following Bothun, Impey, & McGaugh (1997). With the color correction we measure from our HST images (§2.1), the central surface brightness mag arcsec-2 reported by Bowen et al. (2001a) translates to mag arcsec-2. Bowen et al. assumed a redder color, , deemed to be typical of LSB galaxies, and thus deduced a central surface brightness fainter than Bothun et al.’s criterion. The color we derive is at the blue end of the range observed in local dwarfs (see Schulte-Ladbeck & Hopp 1998) but, in any event, it is clear that SBS 1543+539 is not a HSB dwarf, nor a BCD. We classify it as a type Sm, since a slight semblance of a spiral pattern can be discerned in our images. We now show that its properties are similar to those of the local dwarf galaxy population.
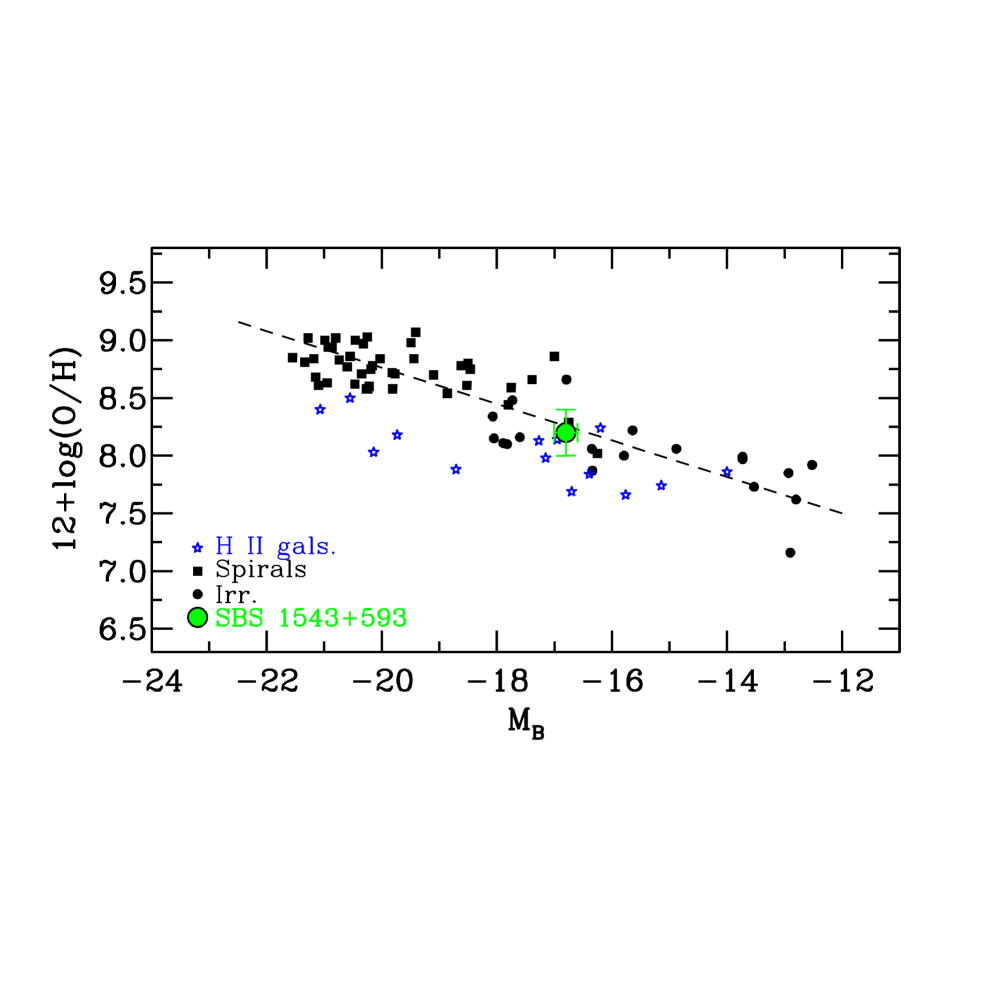
The most recent study of the global properties of late-type dwarf galaxies is that by van Zee (2001). The galaxies which she studied have central surface brightnesses between 20.5 and 25 mag arcsec-2; scale lengths from about 0.2 to 4.3 kpc; SFRs between and yr-1; H I masses between and ; gas depletion time scales between 5 and 4500 Gyr; and ratios from 0.1 to 6.6 . SBS 1543+539 is well within this distribution in terms of all of these properties. The H I surface density of SBS 1543+539 is comparable to the average for LSB galaxies (de Blok, McGaugh, & van der Hulst 1996). As can be appreciated from Figure 8, the oxygen abundance, , is consistent with those of other dwarf Irregulars of similar (see also Hunter & Hoffman 1999).
The H LF of the H II regions of SBS 1543+539 has a slope of . This compares well with the range of slopes, from to , observed by Youngblood & Hunter (1999) in a sample of local Irregular, BCD, and starburst galaxies. Furthermore, the LF slope is quite typical given the absolute blue magnitude, SFR per unit area, and luminosity of the brightest H II region of SBS 1543+539 (compare with Figure 4 of Youngblood & Hunter). In Figure 9 we show that the total number of H II regions in SBS 1543+539 is also normal, when compared with other dwarf galaxies of similar blue luminosity, and that its brightest H II region has the expected H luminosity. The first ranked H II regions observed by Youngblood & Hunter typically have sizes of a few hundred pc; with a physical diameter of 390 pc, H II region #5 in SBS 1543+539 is normal in that respect too.
In summary, on all accounts SBS 1543+539 appears to be a garden-variety, late-type, star-forming, gas-rich dwarf galaxy.
4.3 Comparison with DLAs
On the basis of the limited information available, SBS 1543+539 also seems to be a relatively normal low-redshift DLA. Its H I column density, (H I), is near the low end of the distribution [Rao & Turnshek (2000), for example, cataloged DLAs with (H I) in the range 20.30 to 21.63] but, given the steep slope of the power-law distribution of values of (H I), low column density DLAs are more common than high column density ones. It is, however, one of the least luminous among the galaxies which are either candidate or confirmed hosts of DLAs at (Boissier et al. 2003; Rao et al. 2003). On the other hand, its metallicity of solar, as deduced from the oxygen abundance, is near the upper end of the range for DLAs at which stretches from solar to of solar (Pettini et al. 1999; Kulkarni & Fall 2002). This of course assumes that absorption line measurements of the DLA in the spectrum of the QSO HS 1543+5921 will yield abundances in the neutral ISM which are in agreement with those of the ionized gas in H II region #5. Whether this is the case will only be established with forthcoming HST observations, as we now discuss.
5 Pointers for Future Absorption Line Spectroscopy
The optical data for SBS 1543+593 presented in this study will be an important reference with which the results of ultraviolet absorption line spectroscopy of HS 1543+5921 will be compared. Here we consider some of the issues which can be addressed by such a comparison.
5.1 Degree of Metal Enrichment
As highlighted above, a topic of immediate interest is to establish whether emission and absorption line analyses yield concordant measures of the metallicity of the ISM in this dwarf galaxy. While this is the case for the ISM in the solar vicinity (see, for example, the discussion of this point in Kennicutt et al. 2003), there have been suggestions that in less chemically evolved galaxies the ISM may not be so well mixed and, in particular, that H II regions may exhibit a degree of self-pollution (Kunth & Sargent 1986; Aloisi et al. 2003). The data currently available for SBS 1543+593 are of insufficient spectral resolution to clarify the situation. Specifically, the absorption lines measured in the available STIS spectrum of the QSO by Bowen et al. (2001a) are all strong and saturated; at the resolution of those data (200–300 km s-1), their observed equivalent widths are consistent with a very wide range of possible values of column density.
We illustrate this point with the case of O I . In the STIS spectrum this line is blended with Si II ; for simplicity here we assume that the two lines are of comparable strength (the details of the decomposition of the blend are only a second order effect for the current purpose) and estimate a rest-frame equivalent width Å from the measurement reported by Bowen et al. (2001a). This value of corresponds to a column density (O I) cm-2, this being the lower limit which applies in the optically thin case (we have adopted the -value of the transition from the recent compilation by Morton 2003). The corresponding oxygen abundance, obtained by dividing by the neutral hydrogen column density (H I) cm-2 measured by Bowen et al. (2001a), is , or of solar. This value, which is times lower than that of H II region #5, is however a strict lower limit. Indeed, for the line to be optically thin, the velocity dispersion parameter of the gas, , must be several hundred km s-1.555This and subsequent values of are ‘equivalent’ -values assuming that all the absorbing gas is located in one ‘cloud’. More realistically, we expect the absorption lines to consist of several components separated in velocity. In the customary notation, , where is the one-dimensional velocity dispersion of the absorbers along the line of sight. On the other hand, Å would be consistent with the H II region abundance of solar if were km s-1, a value which is quite consistent with the 21 cm emission profile recorded by Bowen et al. (2001b). Such a wide range of neutral oxygen column densities, and corresponding oxygen abundances, is not unusual when dealing with low resolution spectra of saturated absorption lines (e.g. Pettini & Lipman 1995).
In reality, O I is seldomly useful for abundance measurements, even in high resolution spectra, because the line is nearly always saturated in DLAs. More appropriate is the weaker S II triplet. Assuming a solar S/O ratio, as found in Galactic stars (Nissen et al. 2003) and nearby H II regions (e.g. Garnett 2003), we predict (S II) cm-2 if the cool, neutral ISM of SBS 1543+593 has the same metallicity as H II region #5. Saturation of the S II lines should be a tractable problem at this column density, provided is greater than km s-1.
5.2 Nitrogen as a Measure of Ionization Corrections in DLAs
Measurements of the column density of N I in the spectrum of HS 1543+5921 (from either the or the triplet) may help resolve a current controversy concerning the abundance of N in DLAs, which in turn is relevant to understanding the main sources of N at low metallicities. This is a topic which has generated some debate recently (e.g. Pettini et al. 2002; Prochaska et al. 2002; Centurión et al. 2003; Meynet & Pettini 2003; Molaro et al. 2003).
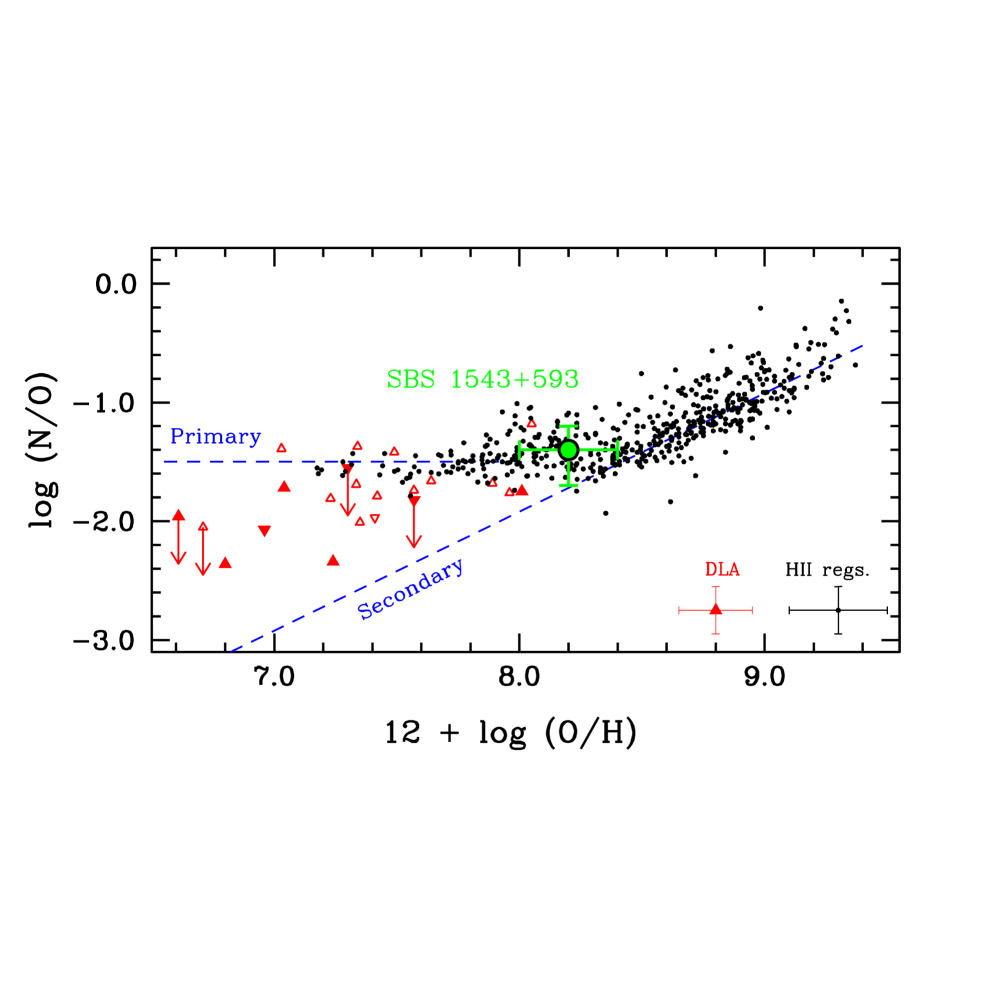
Clues to the nucleosynthetic origin of N are provided by its abundance relative to that of O (a product of massive stars which explode as Type II supernovae) and, to this end, it has become customary to examine the behaviour of (N/O) vs. (O/H) as in Figure 10. Nitrogen has both a primary and a secondary component, depending on whether the seed carbon and oxygen from which N is synthesized are those manufactured by the star during helium burning, or were already present when the star first condensed out of the interstellar medium. In H II regions of nearby galaxies, (N/O) exhibits a strong dependence on (O/H) when the latter is greater than solar; this is generally interpreted as the regime where secondary N becomes dominant. At low metallicities on the other hand, when (that is, solar), N is mostly primary and tracks O; this results in a plateau at . The main sources of primary N are thought to be intermediate mass stars (, e.g. Lattanzio, Forestini, & Charbonnel 2000) which manufacture it through a process called ‘hot bottom burning’ in thermal pulses during the asymptotic giant branch phase (Renzini & Voli 1981).
When we measure the abundances of N and O (or S, which is sometimes used as a proxy for O) in metal-poor DLAs we find quite a different picture, as can be readily appreciated from Figure 10. The (N/O) ratio in DLAs exhibits a range of values which extends from the primary plateau at down to one order of magnitude less. The scatter is now well established and cannot be attributed entirely to measurement errors. Qualitatively, this difference between DLAs at high redshifts on the one hand, and the most metal-poor H II regions in the local universe on the other, is consistent with the idea of a delayed production of primary N from intermediate mass stars (relative to the near-instantaneous release of O by Type II supernovae), as pointed out by Pettini, Lipman, & Hunstead (1995). Quantitatively, however, the situation is more complicated. The large number of DLAs with values of (N/O) below the primary plateau has led to speculation that the time delay between the realease of N and O may be longer than anticipated—which in turn would suggest that stars with masses can also contribute to the nucleosynthesis of N, perhaps aided by stellar rotation (Meynet & Pettini 2003). An alternative proposal has appealed to a truncated initial mass function (Prochaska et al. 2002). Molaro et al. (2003) have drawn attention to the possibility that there may be a lower limit to (N/O) which could be used to infer the level of primary production of N by massive stars.
A dissenting opinion to this general picture was put forward by Izotov & Thuan (1999) who were struck by the narrow range of values of (N/O) they measured in the most metal-poor BCDs and proposed that the plateau constitutes a lower limit set by the primary production of N by the same massive stars which release O when they explode as supernovae. A corollary of this hypothesis is that the lower abundances of N measured in many DLAs are spurious; Izotov, Schaerer, & Charbonnel (2001) attribute them to an overionization of N I relative to O I (and S II in cases where S is used instead of O).
Herein lies the importance of measuring (N I) in the DLA in HS 1543+5921. As can be seen from Figure 10, the (N/O) ratio we deduce for H II region #5 in SBS 1543+593 is typical of other H II regions with an oxygen abundance of solar. It falls in the region of the diagram where secondary production begins to make a discernable contribution to the overall N yield and where time delay effects would have little impact on the measured (N/O) ratio. Thus, if the ratio (N/O) in the cool, neutral gas of SBS 1543+593 turned out to be lower than the value measured in H II region #5 (while the oxygen abundance was the same), overionization of N I relative to O I would be the most likely explanation. Such an outcome would provide support for the interpretation of DLA abundances proposed by Izotov and collaborators.
A similar test has recently been performed in I Zw 18, but with conflicting conclusions. While Aloisi et al. (2003) deduced a value of (N I)/(O I) which is consistent with (actually higher by a factor of than) the (N/O) ratio in the H II gas, the estimate by Lecavalier des Etangs et al. (2003) is one order of magnitude lower than that of Aloisi et al. (2003). Remarkably, these two studies used the same FUSE data! The problem in this case is partly due to the difficulty of deriving a reliable column density for O I. In any case, I Zw 18 is not ideal for this test, because the interstellar absorption lines are detected against the background of OB stars within the galaxy, so that the line of sight must include ionized, as well as neutral, gas. Furthermore, there may be concerns with interpreting absorption due to the superposition of multiple sight-lines. The experiment is much cleaner in the case of the SBS 1543+593/HS 1543+5921 pair, since the QSO is at much higher redshift than the galaxy and is a point source. Thus we await with anticipation the results of high resolution ultraviolet observations of this QSO-galaxy pair.
6 Conclusions
The main conclusion from the imaging and spectroscopic observations of SBS 1543+593 presented here is that this is an Sm dwarf galaxy of intermediate surface brightness, with properties which are entirely in line with those of other local dwarf galaxies.
We have obtained the first determinations of the oxygen and nitrogen abundances in a bona fide DLA galaxy using emission line diagnostics which refer to the ionized gas, rather than the neutral interstellar medium more commonly probed with QSO absorption line spectroscopy. We deduce solar and solar; these values are consistent with other properties of SBS 1543+593, including its morphology which shows it to be an evolved disk galaxy with a mix of young and old stars.
The value of these measurements is that they provide a reference for future UV spectroscopy of the DLA. The H II region to which they refer is the brightest in SBS 1543+593 and is located only 3.3 kpc from the QSO sightline—over this distance we do not expect significant abundance gradients. Available, low resolution, spectra of the QSO HS 1543+5921 only allows us to establish a lower limit to the oxygen abundance which is not particularly informative, solar, because the O I line is saturated. In reality the abundance of O in the neutral ISM must be much larger, since this lower limit corresponds to a velocity dispersion of the gas of several hundred km s-1 which is excluded by the available 21 cm emission line profile. We make a prediction for the column density of S II, whose UV absorption lines are expected to be only mildly saturated and should therefore provide a more precise measure of the abundance of the -capture elements than O I. We have also highlighted the importance of N I as a test of the ionization corrections which may apply to DLA abundance determinations. The location of H II region #5 in a plot of (N/O) vs. (O/H), near the intersection of the primary and secondary levels of nitrogen production, will make it easier to distinguish between ionization and time-delay effects as the cause of the low N abundances reported in several high redshift DLAs.
All in all, the SBS 1543+539–HS 1543+5921 pair is particularly well-suited for a long-overdue comparison between absorption and emission line abundance measurements in DLAs, because HS 1543+5921: (1) shines near centrally through the disk of SBS 1543+539 and (2) is a bright background point source, rather than an extended cluster of stars within the galaxy. In this paper we have provided the basic emission line data for SBS 1543+539 necessary for such a comparison; we now await with anticipation the results of forthcoming UV spectroscopic observations of HS 1543+5921 with STIS.
References
- (1) Aloisi, A., Savaglio, S., Heckman, T. M., Hoopes, C. G., Leitherer, C., & Sembach, K. R. 2003, ApJ, in press (astro-ph/0306290)
- (2) Boissier, S., Péroux, C., & Pettini, M. 2003, MNRAS, 338, 131
- (3) Bothun, G., Impey, C., & McGaugh, S. 1997, PASP, 109, 745
- (4) Bowen, D.V., Tripp, T.M., & Jenkins, E.B. 2001a, AJ, 121, 1456
- (5) Bowen, D.V., Huchtmeier, W., Brinks, E., Tripp, T.M., Jenkins, E. 2001b, A&A, 372, 820
- (6) Centurión, M., Molaro, P., Vladilo, G., Péroux, C., Levshakov, S. A., & D’Odorico, V. 2003, A&A, 403, 55
- (7) de Blok, W. J. G., McGaugh, S. S., & van der Hulst, J. M. 1996, MNRAS, 283, 18
- (8) Denicoló, G., Terlevich, R., & Terlevich, E. 2002, MNRAS, 330, 69
- (9) de Vaucouleurs, G. 1959, “Handbuch der Physics” (Springer, Berlin), 53, 275
- (10) Dolphin, A.E. 2000, PASP, 112, 1397
- (11) Garnett, D. R. 2003, in Cosmochemistry: The Melting Pot of Elements, (Cambridge: Cambridge University Press), in press (astro-ph/0211148)
- (12) Holweger, H. 2001, AIP Conf. Proc. 598, ed. R. F. Wimmer-Schweingruber, 23
- (13) Hunter, D.A., & Hoffman, L. 1999, AJ, 117, 2789
- (14) Izotov, Y. I., Schaerer, D., & Charbonnel, C. 2001, ApJ, 549, 878
- (15) Izotov, Y. I., & Thuan, T. X. 1999, ApJ, 511, 639
- (16) Izotov, Y. I., Thuan, T. X., & Lipovetsky, V. A. 1994, ApJ, 435, 647
- (17) Jimenez, R., Bowen, D. V., & Matteucci, F. 1999, ApJ, 514, L83
- (18) Kennicutt, R. C. 1998, ARA&A, 36, 189
- (19) Kennicutt, R. C., Bresolin, F., & Garnett, D. R. 2003, ApJ, 591, 801
- (20) Kennicutt, R. C., Edgar, B. K., & Hodge, P. W. 1989, ApJ, 337, 761
- (21) Kewley, L. J., Dopita, M. A. 2002, ApJS, 142, 35
- (22) Kobulnicky, H.A., Kennicutt Jr., R.C., & Pizagno, J.L. 1999, ApJ, 514, 544
- (23) Kobulnicky, H.A., & Koo, D.C. 2000, ApJ, 545, 712
- (24) Kulkarni, V. P. & Fall, S. M. 2002, ApJ, 580, 732
- (25) Kunth, D., Lequeux, J., Sargent, W. L. W., & Viallefond, F. 1994, A&A, 282, 709
- (26) Kunth, D., & Sargent, W. L. W. 1986, ApJ, 300, 496
- (27) Lattanzio, J., Forestini, M., & Charbonnel, C. 2000, Memorie della Societa Astronomica Italiana, 71, 737
- (28) Lecavalier des Etangs, A., Désert, J.-M., Kunth, D., Vidal-Madjar, A., Callejo, G., Ferlet, R., Hébrard, G., & Lebouteiller, V. 2003, A&A, submitted
- (29) Lopez, S. & Ellison, S. L. 2003, A&A, 403, 573
- (30) Lopez, S., Reimers, D., D’Odorico, S., & Prochaska, J. X. 2002, A&A, 385, 778
- (31) McGaugh, S. 1991, ApJ, 380, 140
- (32) Miller, E. D., Knezek, P. M., & Bregman, J. N. 1999, ApJ, 510, L95
- (33) Meynet, G., & Pettini, M. 2003, IAU Symp. 215 “Stellar Rotation”, ed. A. Maeder & P. Eenens, in press (astro-ph/0301287)
- (34) Molaro, P., Centurión, M., D’Odorico, V., & Péroux, C. 2003, in Carnegie Observatories Astrophysics Series, Vol. 4: Origin and Evolution of the Elements, ed. A. McWilliam & M. Rauch, in press (astro-ph/0307173)
- (35) Morton, D.C. 2003, ApJS, submitted
- (36) Nestor, D.B., Rao, S.M., Turnshek, D.A., Monier, E., Lane, W., & Bergeron, J. 2002, to appear in ASP Conference Series “Extragalactic Gas at Low Redshift”, J. Mulchaey & J. Stocke, eds., astro-ph/0108146
- (37) Nissen, P. E., Chen, Y. Q., Asplund, M., & Pettini, M. 2003, A&A, submitted
- (38) Norberg, P. et al. 2002, MNRAS, 336, 907
- (39) Osterbrock, D.E. 1989, Astrophysics of Gaseous Nebulae and Active Galactic Nuclei (Mill Valley:University Science Books)
- (40) Pagel, B.E.J., Edmunds, M.G., Blackwell, D.E., Chun, M.S., & Smith, G. 1979, MNRAS, 189, 95
- (41) Pettini, M. 2003, in Cosmochemistry: The Melting Pot of Elements, (Cambridge: Cambridge University Press), in press (astro-ph/0303272)
- (42) Pettini, M., Ellison, S. L., Bergeron, J., Petitjean, P. 2002, A&A, 391, 21
- (43) Pettini, M., Ellison, S. L., Steidel, C. C., & Bowen, D. V. 1999, ApJ, 510, 576
- (44) Pettini, M., & Lipman, K. 1995, A&A, 297, L63
- (45) Pettini, M., Lipman, K., & Hunstead, R. W. 1995, ApJ, 451, 100
- (46) Pettini, M., Rix, S. A., Steidel, C. C., Adelberger, K. L., Hunt, M. P., & Shapley, A. E. 2002, ApJ, 569, 742
- (47) Prochaska, J. X., Henry, R. B. C., O’Meara, J. M., Tytler, D., Wolfe, A. M., Kirkman, D., Lubin, D., & Suzuki, N. 2002, PASP, 114, 933
- (48) Rao, S.M., & Turnshek, D.A. 2000, ApJS, 130, 1
- (49) Rao, S.M., Nestor, D.B, Turnshek, D.A., Lane, W.M., Monier, E.M., & Bergeron, J. 2003, ApJ, in press (astro-ph/0211297)
- (50) Reimers, D., & Hagen, H.-J. 1998, A&A, 329, L25
- (51) Renzini, A., & Voli, M. 1981, A&A, 94, 175
- (52) Sandage, A., & Binggeli, B. 1984, AJ, 89, 919
- (53) Schlegel, D.J., Finkbeiner, D.P., & Davis, M. 1998, ApJ, 500, 525
- (54) Schulte-Ladbeck, R.E., & Hopp, U. 1998, AJ, 116, 2886
- (55) Shaw, R .A., & Dufour, R. J. 1995, PASP, 107, 896
- (56) Skillman, E. D., Côté, S., & Miller, B. W. 2003, AJ, 125, 610
- (57) Thurston, T. R., Edmunds, M. G., & Henry, R. B. C. 1996, MNRAS, 283, 990
- (58) Turnshek, D. A., Rao, S. M., Nestor, D., Lane, W., Monier, E., Bergeron, J., & Smette, A. 2001, ApJ, 553, 288
- (59) van Zee, L. 2001, AJ, 121, 2003
- (60) van Zee, L., Salzer, J. J., Haynes, M. P., O’Donoghue, A. A., & Balonek, T. J. 1998, AJ, 116, 2805
- (61) York, D.G., Dopita, M., Green, R., & Bechtold, J. 1986, ApJ, 311, 610
- (62) Youngblood, A., & Hunter, D.A. 1999, ApJ, 519, 55
| Id | X | Y | RA | DEC | Area | a | b/a | PA | ||||
|---|---|---|---|---|---|---|---|---|---|---|---|---|
| (pix) | (pix) | (J2000.0) | (J2000.0) | (mag) | (mag) | (mag) | (mag) | (arcsec | (arcsec) | (deg) | ||
| 1 | 312.5 | 163.8 | 20.20 | 05.2 | 21.99 | 0.04 | 0.25 | 0.11 | 2.28 | 0.84 | 0.94 | 84 |
| 2 | 166.6 | 172.6 | 22.04 | 02.2 | 24.48 | 0.11 | 1.38 | 1.53 | 0.31 | 0.31 | 0.59 | 87 |
| 3 | 156.8 | 191.5 | 22.23 | 03.8 | 21.91 | 0.06 | 0.85 | 0.23 | 2.54 | 0.96 | 0.74 | 86 |
| 4 | 189.0 | 196.9 | 21.85 | 05.1 | 23.59 | 0.15 | 0.18 | 0.26 | 0.69 | 0.74 | 0.39 | 43 |
| 5 | 347.6 | 202.9 | 19.90 | 09.9 | 21.29 | 0.03 | 0.15 | 2.74 | 1.28 | 0.47 | 38 | |
| 6 | 179.4 | 197.9 | 21.97 | 05.0 | 24.03 | 0.13 | 0.14 | 0.32 | 0.42 | 0.30 | 0.90 | 15 |
| 7 | 362.8 | 203.6 | 19.71 | 10.3 | 22.87 | 0.12 | 0.21 | 0.88 | 0.68 | 0.56 | 58 | |
| 8 | 375.2 | 212.5 | 19.58 | 11.5 | 23.44 | 0.18 | 0.23 | 0.55 | 0.53 | 0.62 | 1 | |
| 9 | 241.7 | 291.3 | 21.52 | 15.5 | 22.95 | 0.07 | 0.09 | 0.61 | 0.36 | 0.85 | 74 | |
| 10 | 265.0 | 293.2 | 21.24 | 16.3 | 24.60 | 0.11 | 2.49 | 0.11 | 0.25 | 0.27 | 0.73 | 12 |
| 11 | 289.6 | 295.4 | 20.94 | 17.2 | 23.78 | 0.06 | 0.19 | 0.33 | 0.29 | 0.96 | 87 | |
| 12 | 350.3 | 299.6 | 20.20 | 19.2 | 22.81 | 0.14 | 0.37 | 0.44 | 0.62 | 0.73 | 0.40 | |
| 13 | 492.9 | 304.8 | 18.44 | 23.5 | 22.56 | 0.05 | 0.13 | 1.43 | 0.71 | 0.78 | ||
| 14 | 372.5 | 309.2 | 19.95 | 20.7 | 23.03 | 0.12 | 0.61 | 2.07 | 0.47 | 0.39 | 0.82 | -26 |
| 15 | 355.5 | 308.9 | 20.16 | 20.2 | 23.74 | 0.32 | 0.43 | 1.26 | 0.27 | 0.30 | 0.79 | 14 |
| 16 | 300.0 | 311.0 | 20.86 | 19.0 | 23.74 | 0.11 | 0.17 | 0.32 | 0.37 | 0.60 | ||
| 17 | 365.1 | 321.7 | 20.09 | 21.7 | 22.14 | 0.79 | 0.58 | 0.79 | 1.04 | 0.72 | 0.68 | 60 |
| 18 | 346.8 | 343.9 | 20.39 | 23.4 | 22.68 | 0.09 | 0.77 | 0.72 | 0.38 | 0.31 | 0.90 | 87 |
| 19 | 342.0 | 351.2 | 20.48 | 23.9 | 22.31 | 0.05 | 0.38 | 0.20 | 0.55 | 0.50 | 0.62 | 70 |
| 20 | 386.9 | 354.0 | 19.93 | 25.4 | 23.90 | 0.29 | 0.47 | 0.50 | 0.21 | 0.24 | 0.96 | 53 |
| 21 | 231.9 | 359.3 | 21.88 | 21.8 | 24.28 | 0.14 | 0.55 | 0.27 | 0.25 | 0.83 | 81 | |
| 22 | 279.9 | 374.2 | 21.33 | 24.5 | 23.97 | 0.08 | 0.21 | 0.28 | 0.23 | 0.82 | 90 | |
| 23 | 380.1 | 380.8 | 20.10 | 27.8 | 23.57 | 0.05 | 0.69 | 0.08 | 0.27 | 0.32 | 0.80 | |
| 24 | 228.0 | 393.1 | 22.04 | 24.9 | 23.12 | 0.10 | 0.14 | 0.71 | 0.55 | 0.57 | 87 | |
| 25 | 286.5 | 397.5 | 21.33 | 26.9 | 23.91 | 0.10 | 0.23 | 0.32 | 0.26 | 0.91 | 69 | |
| 26 | 241.3 | 412.0 | 21.95 | 27.1 | 23.38 | 0.11 | 0.55 | 0.25 | 0.66 | 0.56 | 0.57 | 8 |
| 27 | 367.9 | 435.8 | 20.45 | 32.7 | 23.95 | 0.48 | 0.51 | 0.25 | 0.25 | 0.91 | 64 | |
| 28 | 361.4 | 437.3 | 20.53 | 32.7 | 23.87 | 0.22 | 0.15 | 0.23 | 0.30 | 0.33 | 0.76 | 86 |
| 29 | 398.6 | 440.3 | 20.08 | 34.0 | 23.13 | 0.11 | 0.16 | 0.51 | 0.40 | 0.79 | ||
| 30 | 438.6 | 441.7 | 19.59 | 35.2 | 23.21 | 0.09 | -0.09 | 0.22 | 0.68 | 0.60 | 0.59 | 57 |
| 31 | 417.5 | 457.1 | 19.90 | 36.1 | 23.67 | 0.13 | 1.30 | 1.09 | 0.46 | 0.50 | 0.52 | 31 |
| 32 | 517.2 | 467.3 | 18.70 | 39.7 | 24.34 | 0.10 | 0.12 | 0.56 | 0.33 | 0.25 | 0.69 | |
| 33 | 340.4 | 493.1 | 20.99 | 37.5 | 24.52 | 0.21 | 0.24 | 0.27 | 0.31 | 0.79 | 87 | |
| Gal. | 355.8 | 350.2 | 20.30 | 24.2 | 16.22 | 0.02 | 0.20 | 0.05 | 974.2 | 14.72 | 0.65 | 57 |
| QSO | 428.9 | 411.7 | 20.29 | 26.4 | ||||||||
| Star | 403.9 | 451.1 | 19.88 | 29.8 |
| Observation Date | Grating/Detector | Wavelength (Å) | Exp. Time | Slit Width | Seeing | Airmass |
|---|---|---|---|---|---|---|
| Central, Range | (s) | () | () | |||
| 2000 04 25 | WHT ISIS R600R/TEK4 | 6749, 6340 – 7150 | 10 000 | 2 | 1 | 1.2 |
| 2001 06 12 | WHT ISIS R600B/EEV12 | 4964, 4050 – 5800 | 6 000 | 2 | 1.5 | 1.5 |
| 2001 06 13 | WHT ISIS R600B/EEV12 | 4964, 4050 – 5800 | 4 000 | 2 | 1 | 2.0 |
| 2002 04 21 | MMT Blue Channel 800 grooves mm-1 | 4275, 3125 – 5425 | 300 | 2 | 1 | 1.2 |
| HII region | [OII] | [OIII] | H | [OIII] | [OIII] | H | [NII] | [SII] | [SII] |
|---|---|---|---|---|---|---|---|---|---|
| Observed Wavelengths (Å) | |||||||||
| #5 | 3763.6 | 4907.6 | 5006.2 | 5054.3 | 6627.2 | 6647.6 | 6782.1 | 6795.9 | |
| Rest Frame FluxaaErrors are and upper limits are given at the level of confidence. ( ergs s-1cm-2) | |||||||||
| #5 | 1.72 | ||||||||
| #X | |||||||||
| #12,15 | |||||||||
| #27,28 | |||||||||