MgS in detached shells around carbon stars††thanks: based on observations obtained with ISO, an ESA project with instruments funded by ESA member states (especially the PI countries: France, Germany, the Netherlands and the United Kingdom) with the participation of ISAS and NASA
We investigate the dust composition of detached shells around carbon stars, with a focus to understand the origin of the cool magnesium-sulfide (MgS) material around warm carbon stars, which has been detected around several of these objects (Hony et al., 2002). We build a radiative transfer model of a carbon star surrounded by an expanding detached shell of dust. The shell contains amorphous carbon grains and MgS grains. We find that a small fraction of MgS dust (2% of the dust mass) can give a significant contribution to the IRAS 25 m flux. However, the presence of MgS in the detached shell cannot be inferred from the IRAS broadband photometry alone but requires infrared spectroscopy.
We apply the model to the detached-shell sources R Scl and U Cam, both exhibiting a cool MgS feature in their ISO/SWS spectra. We use the shell parameters derived for the molecular shell, using the CO submillimetre maps (Lindqvist et al., 1999; Schöier & Olofsson, 2001). The models, with MgS grains located in the detached shell, explain the MgS grain temperature, as derived from their ISO spectra, very well. This demonstrates that the MgS grains are located at the distance of the detached shell, which is a direct indication that these shells originate from a time when the stellar photosphere was already carbon-rich. In the case of R Scl, the IRAS photometry is simultaneously explained by the single shell model. In the case of U Cam, the IRAS photometry is under predicted, pointing to a contribution from cooler dust located even further away from the star than the molecular shell.
We present a simple diagnostic to constrain the distance of the shell using the profile of the MgS emission feature. The emission feature shifts to longer wavelength with decreasing grain temperature. One can therefore infer a temperature and a corresponding distance to the star from the observed profile. Such a diagnostic might prove useful for future studies of such systems with SIRTF or SOFIA.
Key Words.:
Stars: AGB and post-AGB – Stars: carbon – Stars: mass-loss – Stars: individual: R Scl & U Cam– Circumstellar matter – Infrared: stars1 Introduction
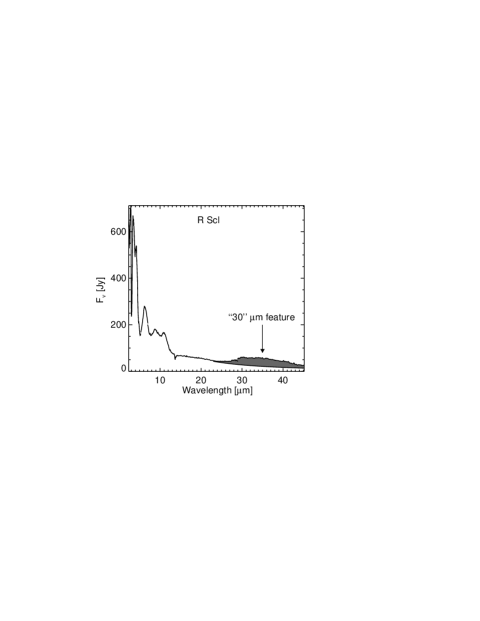
The so-called “30” m emission feature is commonly detected in the infrared (IR) spectra of carbon-rich (C-rich) evolved stars, from low to intermediate mass-loss asymptotic giant branch stars (AGB) through infrared carbon stars and post-AGB stars to planetary nebulae (e.g. Forrest et al., 1981; Omont, 1993; Yamamura et al., 1998; Hony et al., 2002). The “30” m feature, which exhibits itself as a prominent broad emission excess in the IR spectrum, extending from 24 to 45 m, is commonly attributed to magnesium-sulfide (MgS) dust grains (e.g. Goebel & Moseley, 1985; Begemann et al., 1994). MgS grains are expected to form in C-rich environments (Lattimer et al., 1978; Lodders & Fegley, 1999), but are chemically unstable in oxidising, i.e. oxygen-rich, surroundings (Nuth et al., 1985). The feature profile varies considerably from source to source (e.g. Goebel & Moseley, 1985; Waters et al., 2000; Hrivnak et al., 2000). Hony et al. (2002) have presented a detailed spectral comparison between the emission expected from MgS grains and the profiles of the “30” m emission feature found in the IR spectra of C-rich evolved stars obtained with the Short Wavelength Spectrograph (SWS, de Graauw et al., 1996) on board the Infrared Space Observatory (ISO, Kessler et al., 1996). Although there are also some profile variations that can be attributed to grain-shape variations, it was demonstrated that the main variations in the appearance of the “30” m feature between distinct sources can be understood as a result of differences in the (average) MgS grain temperature. Conversely, one can derive the average grain temperature from the observed profile. One of the interesting findings of that study was the discovery of several “hot”, i.e. optically bright, carbon stars that exhibit a cool MgS profile. In Fig. 1 we show the spectrum of R Scl. R Scl is an example of such an optically bright carbon star with a very prominent “30” m feature. One of the most likely explanations for this phenomenon is the presence of MgS grains far from the star, whereas there is a lack of MgS grains closer by.
Some optically bright carbon stars are known to possess a detached shell of gas and dust around them (e.g. Waters et al., 1994; Schöier & Olofsson, 2001). In this paper, we explore the effect that MgS grains located in such a detached shell will have on the IR spectra and photometry of these stars. We build a grid of radiative transfer models of a carbon star surrounded by a detached dust shell which contains amorphous carbon (a-C) and MgS grains. We compare the synthetic spectra from these models with the IRAS photometry of known carbon stars. We further apply the model to two specific carbon stars: R Scl and U Cam. The detached shells around these sources are clearly resolved in molecular line emission (Schöier & Olofsson, 2001) and good quality ISO/SWS spectra are available to compare with the synthetic spectra. This allows us to address the question on whether the MgS grains are located at the same distance as these molecular shells.
1.1 The origin of the dust far from the star
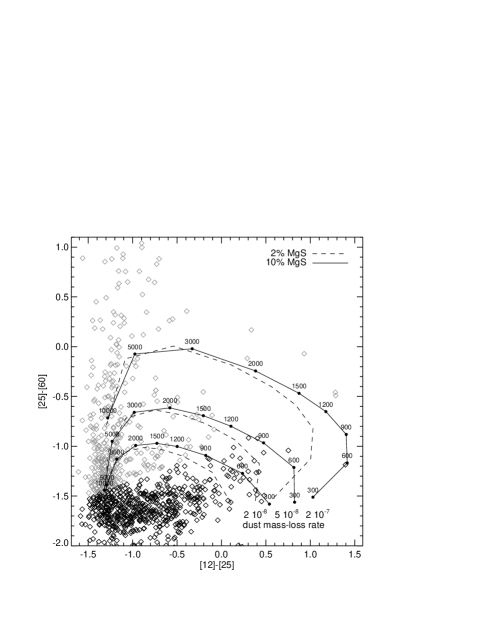
Carbon stars are known to loose large amounts of envelope material through a dust driven wind. The observational indications that this mass loss may occur in a non-steady fashion are important for the present study. Perhaps the most complete picture arises from the IRAS colour-colour diagram (van der Veen & Habing, 1988) of C-rich evolved stars (Fig. 2). This diagram shows the 60 m over 25 m flux-ratio (expressed as a magnitudes difference) versus the 25 m over 12 m flux-ratio based on the IRAS photometry. A star’s position in this diagram is thus a measure of the shape of its IR spectral energy distribution (SED). The diagram shows that most of the carbon-star SEDs are dominated by a single temperature. However, about one third of them show evidence of a second, cooler dust component. This cooler dust component manifests itself through a far-IR excess.
The common interpretation is that this excess is due to a detached dust shell located away from the star (e.g. Willems & de Jong, 1988; Zuckerman, 1993). This shell originates from a previous epoch of mass loss, when the mass-loss rate exceeded the present day mass-loss rate by several factors. Although there has been some discussion in the literature on whether this far-IR excess is actually related to the carbon stars (Ivezic & Elitzur, 1995; Egan et al., 1996), several of these detached shells have now been directly detected. These shells have been resolved either in the IR (Young et al., 1993; Waters et al., 1994; Izumiura et al., 1995, 1996, 1997; Izumiura & Hashimoto, 2000) or in molecular lines in the submillimetre domain (Yamamura et al., 1993; Olofsson et al., 1996; Lindqvist et al., 1999; Schöier & Olofsson, 2001). In a few cases, the optical light scattered by the material in these shells has been directly detected (Izumiura et al., 2000; González Delgado et al., 2001).
The origin of these shells, i.e. the cause of the change in mass-loss rate, is matter for debate. The earliest suggestion was that occurrence of these shell was closely related to the photospheric composition of the AGB star. Specifically, it was suggested that these shells arise as a result of the thermal pulse, that increased the number ratio of C-atoms to O-atoms in the photosphere of the AGB star from less than unity (O-rich) to larger than unity (C-rich) (Willems & de Jong, 1988; Chan & Kwok, 1988). Later studies showed that these shells may arise due to thermal pulses in general, as long as the star is close to the tip of the AGB, i.e. with a luminosity close to the critical luminosity (e.g. Schröder et al., 1998; Steffen & Schönberner, 2000). Recent numerical simulations of the momentum transfer in the dust driven winds of AGB stars show that modulations in the frictional coupling between the gas and the dust can also cause non-steady mass loss and shell formation (Simis et al., 2001). These results have been obtained for a C-rich gas and dust composition and it is at present not clear whether the same mechanism applies to O-rich environments.
1.2 The composition of the material in the shell
Closely related to the question of the origin of these detached shells is the question of their composition. The molecular and dust composition in the shells is a tracer of the chemical and physical conditions, in particular the C/O number ratio, in the atmosphere of the star at the time the shell was formed. There are various indirect evidences that these shells are C-rich. Bujarrabal & Cernicharo (1994) find that the molecular line ratios for the various molecules are indicative of a C-rich chemistry. From modelling of the SED, one also tends to find that the opacities of C-rich dust agree better with the observed far-IR excesses than O-rich dust (e.g. Bagnulo et al., 1997). However these models are not conclusive and models with O-rich dust can also be fitted to the SEDs. The possibility of detecting MgS grains in these shells is a tantalising one, since this gives us a direct handle on the prevailing C/O ratio at the time the matter was ejected. This is due to the fact that the “30” m feature, attributed to MgS grains, is only found in C-rich environments and has, until now, not been detected in O-rich environments.
The paper is organised as follows. In Sect. 2 we present the description of the model. The results of the model are presented and compared to IRAS observations in Sect. 3. We apply the model to R~Sculptoris and U Camelopardalis in Sect. 4. Both these sources have a “30” m feature in their ISO/SWS spectra and the detached gas shells have been spatially resolved with molecular line observations. This allows us to test whether the molecules and dust are co-spatial. Finally, in Sect. 5, we summarise our findings and discuss future prospects.
2 Model description
Our model consist of a single spherical dust shell surrounding a carbon star with a low current day mass-loss rate. The radiation of the star is partially absorbed by the dust grains in the shell. The absorbed light heats the dust grains, which will subsequently emit light at IR wavelengths.
The optically visible C-star is represented by a Planck function of 2500 K. This temperature is representative for the ensemble of optically bright carbon stars with cold MgS grains in the ISO/SWS sample from Hony et al. (2002), where we use the effective temperatures as given by Bergeat et al. (2001) The luminosity of the star is set to 10 000 L⊙, which corresponds to a stellar radius of 535 R⊙. Of course, the whole system can simply be scaled to a different luminosity for the central star by scaling all dimensions with the appropriate value.
2.1 Shell parameters
We assume a constant expansion velocity, with a typical value of 15 km/s. The expansion velocity is constant. During the burst that produced the shell, the mass-loss rate was constant. Before and after the burst the mass loss was negligible. Due to the expansion, the dimensions of the shell are related to the time since termination of the burst as:
| (1) |
where is the radius of the star, and are the inner and outer edges of the dust shell after time . is the duration of the high mass loss. We calculate synthetic spectra for times after ejection () from 300 to 10 000 year. For year the optical depth through the dust shell is very large and these systems will look essentially like high mass-loss carbon stars, instead of detached-shell sources. For year the MgS grains are too cold to have any detectable signature in the resulting SED. We vary between 200 to 1500 year. The corresponding values for the shell thickness (1 1016 7 1016 cm) bracket the thickness of the detached shells derived in Schöier & Olofsson (2001)
The gas density in the shell follows from , where is the gas density as a function of radius () and is the mass-loss rate. The dust density () is important for the radiative transfer calculations. This value is the ratio of the gas density to the gas-to-dust mass ratio (), which implies that the models are determined by the dust mass-loss rate (). We calculate model spectra for the dust mass-loss rate in the range 2 10-9 2 10-7 M⊙/yr. This translates to a total mass loss-rate in the range 5 10-7 10-4 M⊙/yr, using a typical value of =250. However, it is not clear, whether such a standard value is always applicable (see also Sect. 4).
2.2 Dust parameters
We use a-C and MgS as the composition of the dust. The optical properties of a-C are taken from Preibisch et al. (1993). We use an a-C grain-size distribution according to: , where is the number density of grains with radius . For the MgS grains we use the same optical properties used to fit the observations of the C-rich post-AGB star HD 56126 (Hony et al., 2003). These properties are based on the calculated absorption cross-sections in the IR, using the optical constants as published by Begemann et al. (1994) We calculate the IR absorption cross-sections for a continuous distribution of ellipsoids shape-distribution. This distribution results in a resonance which agrees best with the observed feature (e.g. Begemann et al., 1994; Szczerba et al., 1999; Hony et al., 2002). Unfortunately, the optical properties of MgS have not been measured below 10 m. We assume a constant absorption cross-section below 1 m of 10-4 m2 for a grain radius of 0.01 m. We further assume a linear decrease in the absorption cross-section to 0 from 1 to 2 m and 0 between 2 and 10 m. The cross-section assumed here is identical to the one used to model HD 56126. The location of the dust around that star is well determined from extensive IR imaging studies (e.g. Dayal et al., 1998; Jura et al., 2000; Kwok et al., 2002) as the dust shell is clearly resolved. The assumed absorption cross-section below 1 m yields a MgS grain temperature, at the location of the dust shell of HD 56126, which agrees well with its SWS spectrum (Hony et al., 2003).
We vary the relative proportion of MgS to a-C from 2 to 10 percent by mass. A smaller fraction of MgS will not produce a significant “30” m feature. A larger fraction of MgS is unlikely to be present because the amount of MgS grains is limited by the abundance of Mg and S atoms. For a solar composition gas, the maximum mass contained in Mg+S pairs relative to the mass of the C-atoms is 20 percent. However, not all available Mg, S and C atoms are necessarily be condensed into dust grains.
2.3 Dust radiative transfer code
We use the proprietary dust radiative transfer code MODUST. This code solves the monochromatic radiative transfer equation, from UV/optical to millimetre wavelength, in spherical geometry subject to the constraint of radiative equilibrium, using a Feautrier type solution method (Feautrier, 1964; Mihalas, 1978). This yields the temperature of the dust grains. The code allows to have several different dust components of various grain sizes and shapes. We refer to Bouwman et al. (2000) and Bouwman (2001) for a description of techniques used in MODUST. MODUST yields both the model SED and intensity maps. From the obtained model spectra and intensity maps, it is straightforward to simulate observations. For example, we simulate the synthetic SWS spectra by overlaying the apertures as a function of SWS subband, as listed in de Graauw et al. (1996), on the intensity maps. IRAS broadband fluxes are simulated by convolving the spectra with the IRAS bandpasses (Beichman et al., 1988). We solve the transfer equations at 36 wavelengths, on a logarithmically spaced wavelength grid, from 0.2 to 1000 m. This is sufficient for correctly integrating over the wavelength, when performing the radiative equilibrium calculation. These wavelengths also cover the entire SED. In addition, we calculate the synthetic mid-IR spectrum from 2 to 45 m, with linear wavelength steps of 0.5 m, to compare with the observed SWS spectra.
3 Results
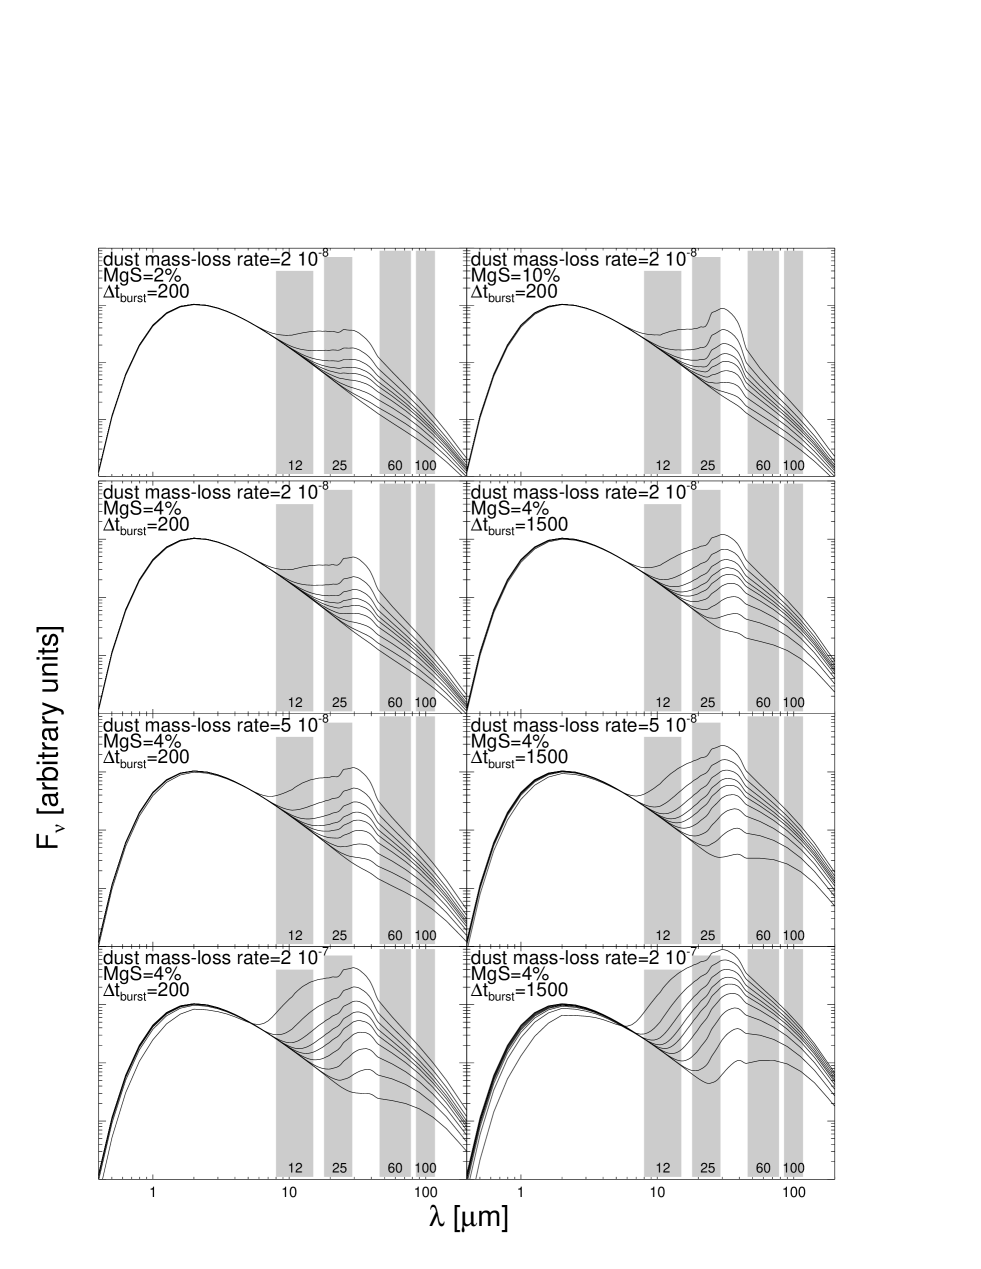
In Fig. 3, we show a subset of the SEDs that result from our model. We show the main effects of varying the mass-loss rate, the fraction of MgS grains and the duration of the burst. We also indicate which part of the SED contributes to the various IRAS photometric filters. There are a few general points that emerge from the analysis.
-
1.
The “30” m feature is detectable even when present at a concentration of only 2 percent. This is especially true shortly after the ejection, when the MgS grains are relatively warm and the spectra clearly exhibit the characteristic onset at 26 m.
-
2.
MgS contributes considerably to the IRAS 25 m flux during the first 2000 year when it is warm enough to emit within the IRAS 25 m bandpass.
-
3.
The shell becomes quickly optically thin for the radiation of the central star and therefore the emission of MgS scales with the amount of MgS in the shell.
-
4.
The 12 m excess disappears within 750 year.
-
5.
As expected, the IR excess increases with larger shell mass and is more pronounced for a short fierce burst than for a prolonged ejection at a lower mass-loss rate, even for the same amount of total material shed.
3.1 The IRAS colour-colour diagram
In Fig. 2 we compare the tracks as predicted from our model with the IRAS colours of known galactic carbon stars. The diagram is constructed in the following way. We cross-correlate the positions of the sources in the General Catalog of Galactic Carbon Stars (Alksnis et al., 2001) with the sources within 30′′ in the IRAS point source catalogue (Joint IRAS Science Working Group, 1988). This yields 3417 associations. From these sources we only use those with a relative flux uncertainty less than 50 percent in the IRAS 12, 25 and 60 m filter. In Fig. 2, the maximum uncertainties are 0.55 and 0.6 and the average uncertainties are 0.11 and 0.15 in [12]-[25] and [25]-[60], respectively.
The tracks explain the general features of the observed colour-colour diagram well. The colours of the systems immediately after ejection of the shell are similar to the colours of the infrared carbon stars, because of the large optical depth in the shell. The expansion of the shell causes the optical depth to rapidly decrease and the 12 m excess to diminish as the dust becomes cooler. Therefore, the source moves rapidly to the left in the diagram. The stars spend by far the longest time on the vertical track, at [12]-[25] -1.2, while the 60 m excess due to the cool dust slowly diminishes. This explains the clustering of the stars in this region of the diagram. The effect of the “30” m feature due to MgS grains can only be noticed within 2000 years after ejection. However, the influence of MgS on the colours is not unique, because the effect of the MgS grains in the colour-colour diagram can be mimicked by a higher mass-loss rate or a longer burst duration. This implies that, due to the presence of MgS grains in these shells, and thus of the “30” m feature, the mass in the shell may be overestimated, when determined from the IRAS photometry alone.
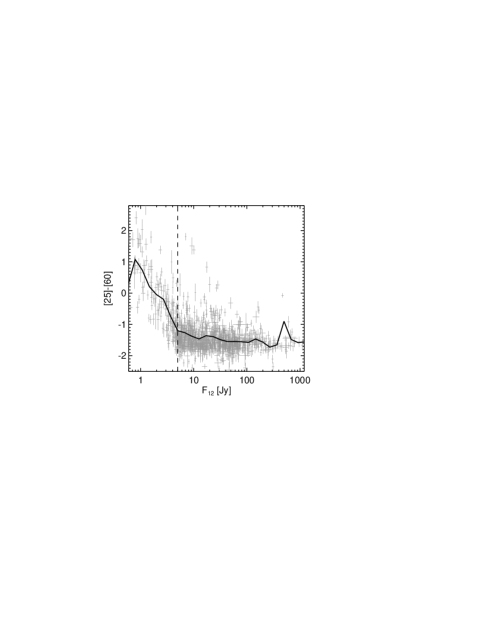
We note that there are several carbon stars in the IRAS database with 60 m excesses larger than the ones shown in Fig. 2. We have not attempted to reproduce these IRAS colours with our model. It is likely that there is a sizeable contamination of the far-IR fluxes among the carbon stars, as has been argued by Ivezic & Elitzur (1995). Specifically, we point out that the largest IRAS excesses are found for the sources with low 12 m fluxes, i.e. sources far away with a much larger chance for confusion or cirrus contamination. The carbon stars with IRAS colour [25]-[60] 0 are almost exclusively found among sources with F12 5 Jy (see Fig. 4). In this paper, we are only concerned with the sources that have [25]-[60] 0.5 and clearly have a detached shell associated with them. In order to obtain 60 m excesses in the range [25]-[60] 1 or even higher (see Fig. 4), we have to increase the total dust mass to 10-4 M⊙, which in turn yields an estimated mass-loss rate an order of magnitude higher than those derived for the best studied cases. It is not clear whether the same detached-shell model can be invoked to explain such extreme excesses.
3.2 MgS as a temperature/distance diagnostic
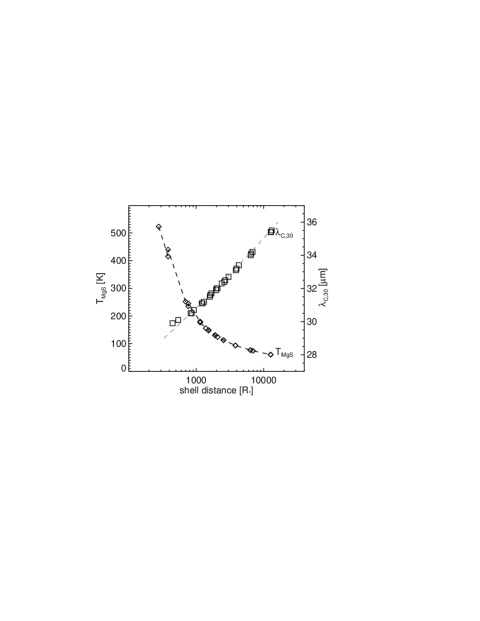
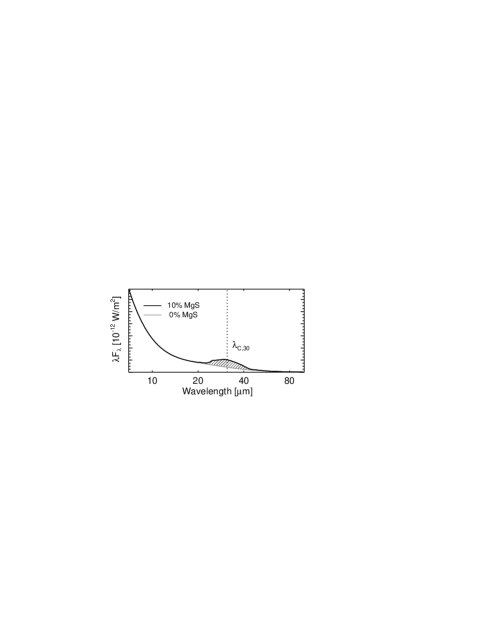
Because the shell becomes rapidly optically thin, we can give an approximate temperature of the MgS grains as a function of shell radius and effective temperature of the star. The effects of the expansion of the shell are shown in Fig. 6. We show two curves. The diamonds show the dependence of temperature on distance. The squares show how this temperature translates into a shifting of the “30” m feature (see also Fig. 3). The shift is expressed in the centroid position of the MgS feature, i.e. the wavelength which divides the feature in equal energy halves, see also Fig. 5. This quantity is in general more easily derived from the spectra and is also a better diagnostic of the temperature than the peak position. For the distance of the shell we take a “typical” distance, defined as the inner radius plus one quarter of the shell thickness. This is to account for the fact that the dust on the inside of the shell is hotter and thus brighter than on the outside. The points shown in Fig. 6 are for shell thickness between 250 and 2000 , which corresponds to a burst duration from 200 to 1500 years. An approximate power-law expression (valid for 30 36 m) is given by:
| (2) |
where is the typical distance of the shell. Note that, in physical terms, the shape of the emission feature is a weighted sum of Planck functions, depending on the MgS grain temperatures, convolved with the wavelength dependent MgS absorption cross-section. Therefore, the simple power-law expression and the constants in the first term of Eq. (2) lack a direct physical interpretation. With optical photometry of the central star, both and (in arcsec) can be determined independent of distance, as the angular size of the star ( in arcsec) is set by and the photometry alone. How practical Eq. (2) will be in reality remains to be demonstrated, because it is known that there are also some differences in the shape of “30” m feature between sources that are not caused by temperature but are more likely due to the grain-shape distribution (Hony et al., 2002). Such a difference can shift by up to 2.5 m: a factor 4 in shell radius! Because the main deviation in the profile is a 26 m excess, the tendency will be to find a lower value of and therefore derive a too small shell radius.
4 Application to sources with ISO/SWS spectra
In the previous section we have shown that the presence of MgS in the detached shells can have a significant effect on the IRAS 25 m photometry. However, the presence of MgS grains in the shell cannot be inferred from the IRAS photometry alone. In this section we focus on those warm carbon stars that show a “30” m feature in their SWS spectrum.
4.1 Application to R Sculptoris
| Gas shella | Dust shell | ||||||||
| Source | d | MgS | |||||||
| [pc] | [′′] | [1016 cm] | [M⊙/yr] | % | |||||
| R Scl | 360 | 13 | 26 | 7 | 14 | 4 10-6 | 8 10-9 | 4 | |
| U Camb | 500 | 7 | 9 | 5.5 | 6.6 | 9 10-6 | 1.6 10-8 | 4 | |
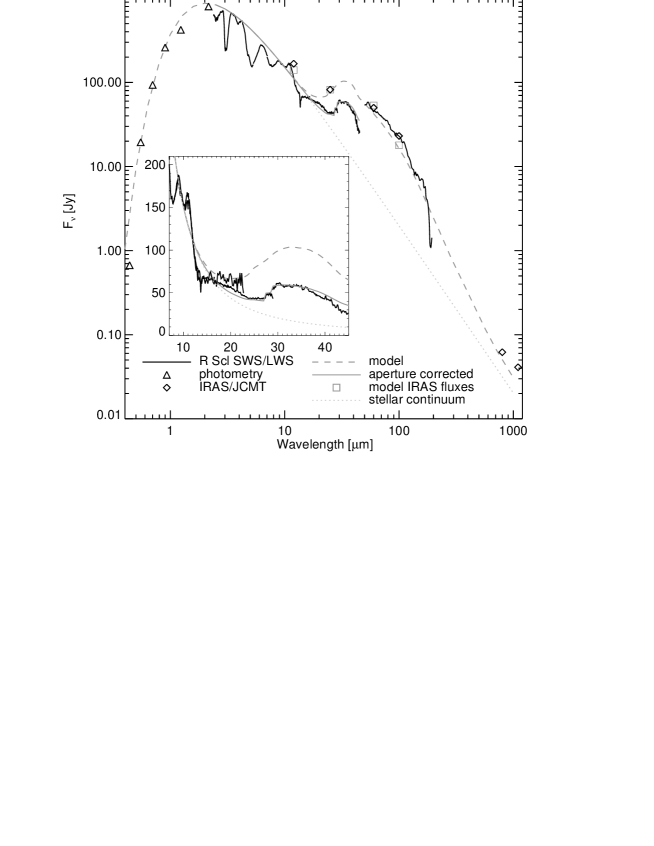
We first apply the model to R Scl. This star is among the best studied optically bright carbon stars with a far-IR excess. Its detached shell has been resolved in molecular lines emission (Olofsson et al., 1996) and scattered light from the detached shells is detected (González Delgado et al., 2001). Furthermore, R Scl has the strongest “30” m feature of the optically bright carbon stars observed with SWS.
For the parameters of the dust shell (see Table 1), we take the inner and outer edge of the shell of the detached gas shell as listed by Schöier & Olofsson (2001, their Table 6). These parameters are derived from mapping observations of the molecular CO emission, in which the shell is clearly resolved. We use the same distance to the star as these authors do, to facilitate a direct comparison of the parameters, which they derive and ours. With the inner and outer edge of the shell fixed, we have only two free parameters: the dust mass-loss rate and the mass fraction of MgS. We vary these parameters and compare the results with the IRAS and ISO observations. The strength of the IR continuum excess is set by the amount of amorphous carbon in the shell, which scales linearly with the dust mass-loss rate. The fraction of MgS influences the strength of the resultant “30” m feature. The best agreement with the observations is found with 4 percent of MgS and a dust mass-loss rate of only 8 10-9 M⊙/year. This best fit is shown in Fig. 7. We derive a total dust mass in the shell, of 1.2 10-5 M⊙. The gas mass as determined by Schöier & Olofsson (2001) is 5.4 10-3 M⊙, which yields for the gas-to-dust mass ratio: =450. The model parameters are given in Table 1.
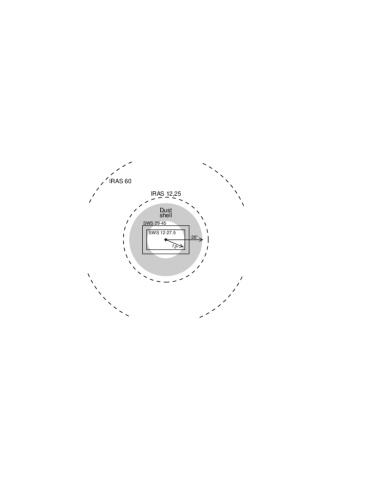
We show a sketch of the model, with the dimensions of the relevant SWS apertures and the IRAS beam-sizes overlaid, in Fig. 8. The IRAS measurements sample the complete detached shell, whereas the SWS spectrograph detects only a fraction of the shell. The different regions probed by the various instruments give rise to differences in the flux levels measured by these instruments. The IRAS measurements sample the complete shell and should therefore yield much higher flux level than SWS does. This is indeed as observed (see Fig. 7). A smaller difference in the flux level, due to the size of the SWS apertures, is also observed in the SWS data below 27.5 m and above 29 m.
The model is able to explain the strength of the MgS resonance within the SWS aperture accurately. It simultaneously explains the much stronger excess in the IRAS beam. The presence of the MgS excess was already suspected by Bagnulo et al. (1998) who found that the IRAS 25 m photometry was higher than expected on the basis of the flux level of their Cooled Grating Spectrograph (CGS3) spectrum which goes out to 23.5 m. These authors speculate that the high IRAS 25 m flux level might be due to a strong emission feature, at wavelengths longer than 24 m, i.e. the “30” m feature. When we convolve the synthetic SED with the IRAS filter profile, the IRAS 25 m flux is indeed nicely reproduced by our model.
The excellent agreement, between the simple detached-shell model and the ISO and IRAS data, demonstrates that the “30” m feature arises from the location of the detached shell. We conclude, that MgS grains are present in the detached shell of R Scl. We would like to emphasise that we do not attempted to further optimise the obtained model by varying the inner or outer edge of the dust shell. We have to make a rather crude assumption for the absorption level of the MgS grains below 1 m (Sect. 2.2). Therefore, this simple model does not warrant such a detailed fitting procedure. However, the correspondence between the model and observations, especially those probing different spatial scales, demonstrates that the MgS emission arises from roughly the same location as the molecular gas emission.
4.2 Application to U Camelopardalis
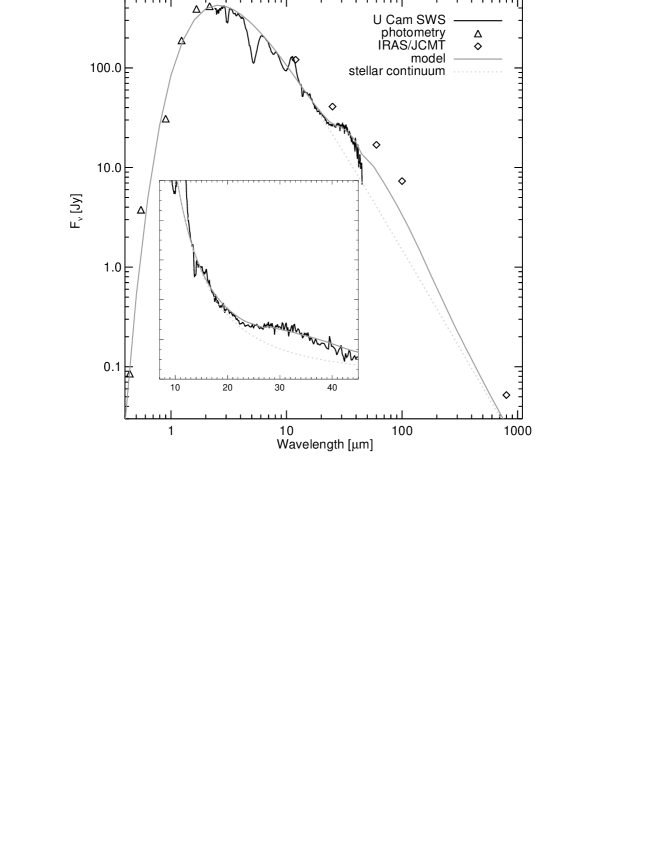
We also apply the model to U Cam. Compared to R Scl, this object has a much thinner CO shell (Table 1). Lindqvist et al. (1999) measured an inner radius of 5.5 1016 cm with a thickness of only 1.1 1016 cm at a distance of 500 pc. This corresponds to an outer radius of 9′′ and the shell fits entirely within the largest SWS aperture. With those values for the inner and outer radius of the shell the model cannot explain the IRAS and the ISO measurements simultaneously (Fig. 9). We find that the low IR flux levels, as measured by ISO/SWS, place a stringent constraint on the amount of dust located at the position of the CO shell. However, the IRAS fluxes clearly indicate that there is more dust present in the system. This dust is probably located even further away from the star. As can be seen in Fig. 9, all the IRAS fluxes as well as the 800 m flux are under-predicted by the shell model. When we increase the shell dust mass, in order to agree with the IRAS 25 and 60 m flux levels, the longer wavelength fluxes are still very much under predicted by the relatively warm dust in the model. This indicates that the system contains cooler dust, which is probably located further away. The latter conclusion is in qualitative agreement with the fact that the interferometric measurements of Lindqvist et al. (1999) retrieved about half of the total CO emission, measured with single dish observations (Neri et al., 1998). This is due to a more extended component of CO emission.
The situation in the case of U Cam is clearly more complex than for R Scl. The observations can not be explained by a single dust shell. The far-IR fluxes levels are dominated by dust located outside the detected CO shell. However, we stress that there is MgS present in the CO shell. The ISO/SWS instrument, which only probes the inner regions, detects a “30” m feature. The temperature of the MgS, as derived from the centroid position of the “30” m feature in the ISO observation, yields a distance for the dust shell of 5.5 1016 cm (7.3′′ at a distance of 500 pc). This distance is identical to the size of the detached CO shell. Using the gas mass of the shell of 1.4 10-3 M⊙ as given by Schöier & Olofsson (2001) and a dust mass of 2.4 10-6 M⊙ from the best fitting model for the ISO/SWS data, we find a gas-to-dust mass ratio of =580.
We would like to point out that, in the two cases that we study here, the derived gas-to-dust mass ratio in the shell is relatively high (450 for R Scl and 580 for U Cam). These numbers are much higher than the values between 200 and 250, which are commonly used for modelling carbon-rich AGB and post-AGB stars (e.g. Jura, 1986; Meixner et al., 1997). However, the numbers we derive are in relatively good agreement with the high values of Schöier & Olofsson (2001). One should clearly be cautious in applying a “standard” value, when determining the total shell masses for such systems based on the IR excess alone.
4.3 Other warm carbon stars with the “30” m feature
| Source | [m] | Rshell [′′] | |
|---|---|---|---|
| W Ori | 2.87 | 31.3 | 8 |
| S Cep | 3.15† | 31.2 | 6 |
| T Dra | 4.94 | 30.2 | 1.6 |
| V Cyg | 3.24† | 30.5 | 4 |
| RU Vir | 4.24† | 30.4 | 2 |
There are a few more warm and optically bright carbon stars that exhibit a cool MgS feature in their SWS spectra. We do not model these stars here, mostly because of the lack of suitable molecular data to compare with. However, we do give a crude estimate of their shell radii. We calculate the angular radius of the star times the effective temperature squared from the bolometric magnitude given by Bergeat et al. (2002), using:
| (3) |
where and are the apparent and absolute bolometric magnitude and is the angular radius of the star. The measured values of the apparent bolometric magnitude and the centroid position of the MgS feature together with Eq. (2 & 4.3) yields the angular radius of the shell. The sources and the estimated radii are listed in Table 2. These sources all have much weaker “30” m features than the feature observed in the SWS spectrum of R Scl, with a correspondingly lower signal-to-noise ratio. At the same time, the estimated stellar continuum underlying the “30” m feature becomes more influential on the derived feature profile. Based on this, we estimate an uncertainty in of 1 m and in the derived shell radii of at least a factor 2.
5 Conclusions & future prospects
With the models that we have presented, we now have a tool to systematically investigate the influence of MgS on the IR spectra of carbon stars with detached shells. We find that, in the case of R Scl, the dust (containing MgS) is co-spatial with the molecular gas. This shows that the dust present in the shell is indicative of C-rich chemistry and therefore the photosphere was C-rich at the time the shell was ejected. This rules against a scenario in which the shell is produced due to the transition from O-rich to C-rich. We find that the shell around U Cam contains MgS as well, again demonstrating the C-based chemistry of the shell.
The prominence of the “30” m feature and the broad wavelength range over which the MgS grains emit make this material an excellent tool for future studies of the circumstellar shells of carbon-rich evolved stars. In particular, we point out that, because of the temperature dependence of the MgS emission profile, some of the usual ambiguity in interpreting SEDs can be lifted, as we can constrain the location of the shell by means of the “30” m feature. The low-resolution long-wavelength mode of the IRS instrument (Roellig et al., 1998) on board SIRTF (Gallagher et al., 2003) will be sensitive enough to easily detect the MgS feature in carbon stars located in the SMC or LMC. This will eliminate the distance uncertainty, which usually troubles the derivation of the shell parameters of galactic carbon stars and therefore allows a more statistical approach for studying the occurrence rate and shell masses of such detached shells.
Another tantalising prospective is offered by the FORECAST instrument (Keller et al., 2000) for the SOFIA observatory (Becklin, 1997). With this camera it will be feasible to directly image the shells at the wavelengths where the MgS is emitting. The shells discussed here are all easily resolved with the good angular resolution ( 5′′) of the large SOFIA mirror. The several bandpasses in the “30” m feature will allow us to study the MgS abundance and temperature as a function of distance to the carbon star to an unprecedented level of detail.
Acknowledgements.
The authors thank Frank Molster, Jacco van Loon and Rens Waters for interesting and very constructive discussions. We thank Coralie Neiner for careful reading of the manuscript. JB acknowledges financial support from the EC-RTN on “The Formation and Evolution of Young Stellar Clusters” (RTN-1999-00436, HPRN-CT-2000-00155). This research has made use of the SIMBAD database, operated at CDS, Strasbourg, France. This research has made use of NASA’s Astrophysics Data System Bibliographic Services. This research has made use of the VizieR catalogue access tool, CDS, Strasbourg, France.References
- Alksnis et al. (2001) Alksnis, A., Balklavs, A., Dzervitis, U., et al. 2001, Baltic Astronomy, 10, 1
- Bagnulo et al. (1998) Bagnulo, S., Doyle, J. G., & Andretta, V. 1998, MNRAS, 296, 545
- Bagnulo et al. (1997) Bagnulo, S., Skinner, C. J., Doyle, J. G., & Camphens, M. 1997, A&A, 321, 605
- Becklin (1997) Becklin, E. E. 1997, in The Far Infrared and Submillimetre Universe., 201
- Begemann et al. (1994) Begemann, B., Dorschner, J., Henning, T., Mutschke, H., & Thamm, E. 1994, ApJ, 423, L71
- Beichman et al. (1988) Beichman, C. A., Neugebauer, G., Habing, H. J., Clegg, P. E., & Chester, T. J. 1988, in NASA RP-1190, Vol. 1 (1988), 0
- Bergeat et al. (2001) Bergeat, J., Knapik, A., & Rutily, B. 2001, A&A, 369, 178
- Bergeat et al. (2002) Bergeat, J., Knapik, A., & Rutily, B. 2002, A&A, 390, 967
- Bouwman (2001) Bouwman, J. 2001, PhD thesis, University of Amsterdam
- Bouwman et al. (2000) Bouwman, J., de Koter, A., van den Ancker, M. E., & Waters, L. B. F. M. 2000, A&A, 360, 213
- Bujarrabal & Cernicharo (1994) Bujarrabal, V. & Cernicharo, J. 1994, A&A, 288, 551
- Chan & Kwok (1988) Chan, S. J. & Kwok, S. 1988, ApJ, 334, 362
- Dayal et al. (1998) Dayal, A., Hoffmann, W. F., Bieging, J. H., et al. 1998, ApJ, 492, 603
- de Graauw et al. (1996) de Graauw, T., Haser, L. N., Beintema, D. A., et al. 1996, A&A, 315, L49
- Egan et al. (1996) Egan, M. P., Kwok, S., Leung, C. M., & Price, S. D. 1996, A&A, 308, 738
- Feautrier (1964) Feautrier, P. 1964, C. R. Acad. Sci. Paris, 258, 3189
- Forrest et al. (1981) Forrest, W. J., Houck, J. R., & McCarthy, J. F. 1981, ApJ, 248, 195
- Gallagher et al. (2003) Gallagher, D. B., Irace, W. R., & Werner, M. W. 2003, in IR Space Telescopes and Instruments. Edited by John C. Mather . Proceedings of the SPIE, Volume 4850, pp. 17-29 (2003)., 17–29
- Goebel & Moseley (1985) Goebel, J. H. & Moseley, S. H. 1985, ApJ, 290, L35
- González Delgado et al. (2001) González Delgado, D., Olofsson, H., Schwarz, H. E., Eriksson, K., & Gustafsson, B. 2001, A&A, 372, 885
- Hony et al. (2003) Hony, S., Tielens, A. G. G. M., Waters, L. B. F. M., & de Koter, A. 2003, A&A, 402, 211
- Hony et al. (2002) Hony, S., Waters, L. B. F. M., & Tielens, A. G. G. M. 2002, A&A, 390, 533
- Hrivnak et al. (2000) Hrivnak, B. J., Volk, K., & Kwok, S. 2000, ApJ, 535, 275
- Ivezic & Elitzur (1995) Ivezic, Z. & Elitzur, M. 1995, ApJ, 445, 415
- Izumiura & Hashimoto (2000) Izumiura, H. & Hashimoto, O. 2000, Advances in Space Research, 25, 2205
- Izumiura et al. (1996) Izumiura, H., Hashimoto, O., Kawara, K., Yamamura, I., & Waters, L. B. F. M. 1996, A&A, 315, L221
- Izumiura et al. (1995) Izumiura, H., Kester, D. J. M., De Jong, T., et al. 1995, Ap&SS, 224, 495
- Izumiura et al. (1997) Izumiura, H., Waters, L. B. F. M., De Jong, T., et al. 1997, A&A, 323, 449
- Izumiura et al. (2000) Izumiura, H., Waters, L. B. M. F., de Jong, T., Loup, C., & Hashimoto, O. 2000, in IAU Symposium, Vol. 177, The Carbon Star Phenomenon, ed. R. F. Wing, 415–431
- Johnson et al. (1966) Johnson, H. L., Iriarte, B., Mitchell, R. I., & Wisniewskj, W. Z. 1966, Communications of the Lunar and Planetary Laboratory, 4, 99
- Joint IRAS Science Working Group (1988) Joint IRAS Science Working Group. 1988, in IRAS Point Source Catalog (1988), 0
- Jura (1986) Jura, M. 1986, ApJ, 303, 327
- Jura et al. (2000) Jura, M., Chen, C., & Werner, M. W. 2000, ApJ, 544, L141
- Keller et al. (2000) Keller, L. D., Herter, T. L., Stacey, G. J., et al. 2000, in Proc. SPIE Vol. 4014, p. 86-97, Airborne Telescope Systems, Ramsey K. Melugin; Hans-Peter Roeser; Eds., 86–97
- Kessler et al. (1996) Kessler, M. F., Steinz, J. A., Anderegg, M. E., et al. 1996, A&A, 315, L27
- Kwok et al. (2002) Kwok, S., Volk, K., & Hrivnak, B. J. 2002, ApJ, 573, 720
- Lattimer et al. (1978) Lattimer, J. M., Schramm, D. N., & Grossman, L. 1978, ApJ, 219, 230
- Lindqvist et al. (1999) Lindqvist, M., Olofsson, H., Lucas, R., et al. 1999, A&A, 351, L1
- Lodders & Fegley (1999) Lodders, K. & Fegley, B. 1999, in IAU Symp. 191: Asymptotic Giant Branch Stars, Vol. 191, 279
- Meixner et al. (1997) Meixner, M., Skinner, C. J., Graham, J. R., et al. 1997, ApJ, 482, 897
- Mihalas (1978) Mihalas, D. 1978, Stellar atmospheres /2nd edition/ (San Francisco, W. H. Freeman and Co., 1978. 650 p.)
- Neri et al. (1998) Neri, R., Kahane, C., Lucas, R., Bujarrabal, V., & Loup, C. 1998, A&AS, 130, 1
- Nuth et al. (1985) Nuth, J. A., Moseley, S. H., Silverberg, R. F., Goebel, J. H., & Moore, W. J. 1985, ApJ, 290, L41
- Olofsson et al. (1996) Olofsson, H., Bergman, P., Eriksson, K., & Gustafsson, B. 1996, A&A, 311, 587
- Omont (1993) Omont, A. 1993, in ASP Conf. Ser. 41: Astronomical Infrared Spectroscopy: Future Observational Directions, 87
- Preibisch et al. (1993) Preibisch, T., Ossenkopf, V., Yorke, H. W., & Henning, T. 1993, A&A, 279, 577
- Roellig et al. (1998) Roellig, T. L., Houck, J. R., Van Cleve, J. E., et al. 1998, in Proc. SPIE Vol. 3354, p. 1192-1203, Infrared Astronomical Instrumentation, Albert M. Fowler; Ed., 1192–1203
- Schöier & Olofsson (2001) Schöier, F. L. & Olofsson, H. 2001, A&A, 368, 969
- Schröder et al. (1998) Schröder, K.-P., Winters, J. M., Arndt, T. U., & Sedlmayr, E. 1998, A&A, 335, L9
- Simis et al. (2001) Simis, Y. J. W., Icke, V., & Dominik, C. 2001, A&A, 371, 205
- Steffen & Schönberner (2000) Steffen, M. & Schönberner, D. 2000, A&A, 357, 180
- Szczerba et al. (1999) Szczerba, R., Henning, T., Volk, K., Kwok, S., & Cox, P. 1999, A&A, 345, L39
- van der Veen & Habing (1988) van der Veen, W. E. C. J. & Habing, H. J. 1988, A&A, 194, 125
- Waters et al. (1994) Waters, L. B. F. M., Loup, C., Kester, D. J. M., Bontekoe, T. R., & De Jong, T. 1994, A&A, 281, L1
- Waters et al. (2000) Waters, L. B. F. M., Molster, F. J., Hony, S., et al. 2000, ASP Conf. Ser. 196: Thermal Emission Spectroscopy and Analysis of Dust, Disks, and Regoliths, 3
- Willems & de Jong (1988) Willems, F. J. & de Jong, T. 1988, A&A, 196, 173
- Yamamura et al. (1998) Yamamura, I., De Jong, T., Justtanont, K., Cami, J., & Waters, L. B. F. M. 1998, Ap&SS, 255, 351
- Yamamura et al. (1993) Yamamura, I., Onaka, T., Kamijo, F., Izumiura, H., & Deguchi, S. 1993, PASJ, 45, 573
- Young et al. (1993) Young, K., Phillips, T. G., & Knapp, G. R. 1993, ApJS, 86, 517
- Zuckerman (1993) Zuckerman, B. 1993, A&A, 276, 367