WIYN Open Cluster Study. XVII.
Astrometry and Membership to in NGC 188.
Abstract
We present techniques for obtaining precision astrometry using old photographic plates from assorted large-aperture reflectors in combination with recent CCD Mosaic Imager frames. At the core of this approach is a transformation of plate/CCD coordinates into a previously constructed astrometric reference frame around the open cluster NGC 188. This allows us to calibrate independently the Optical Field Angle Distortion for all telescopes and field correctors used in this study. Particular attention is paid to computing the differential color refraction, which has a marked effect in the case of NGC 188 due to the large zenith distances at which this cluster has been observed. Our primary result is a new catalog of proper motions and positions for 7812 objects down to in the 0.75 deg2 area around NGC 188. The precision for well-measured stars is 0.15 mas yr-1 for proper motions and 2 mas for positions on the system of the Tycho-2 catalog. In total, 1490 stars have proper-motion membership probabilities . The sum of membership probabilities indicates that NGC 188 contains 1,050 stars down to . Comprehensive lists of the candidate blue stragglers and red giant stars substantially enlarge the number of such stars known in NGC 188. We have also obtained a small correction to the proper motions from the mean ‘motion’ of background galaxies. Thus the absolute proper motion of NGC 188 is and mas yr-1.
1 Introduction
Since the seminal paper by Sandage (1962) first showed that NGC 188 (, ) is one of the oldest Galactic open clusters, it has been a subject of numerous studies and is a classical reference to the old Galactic disk population. NGC 188 was chosen by the WIYN Open Cluster Study (WOCS – Mathieu 2000) as a cornerstone cluster. To date, two WOCS broad-bandpass photometry papers of this cluster have appeared (von Hippel & Sarajedini 1998, and Sarajedini et al. 1999). Although NGC 188 is a fairly rich cluster and has a well-defined main sequence in the color-magnitude diagram (CMD), this advantage starts to disappear at 18 (see Sarajedini et al. 1999) where the field star contamination gets severe.
Two astrometric studies by Upgren, Mesrobian & Kerridge (1972) and Dinescu et al. (1996) have addressed the issue of cluster membership based upon the proper motions from plates taken with the 30-in Thaw refractor of the Allegheny Observatory. In order to achieve a reliable separation between the cluster and field stars, high-precision proper motions, good to 0.5 mas yr-1 or better, are required. This is a consequence of a very small tangential velocity of NGC 188 relative to field stars – only 3 mas yr-1. Both studies are successful in identifying the bright members of NGC 188, i.e., giant branch, upper main sequence, and blue stragglers. However, the main sequence turn-off for NGC 188 is at , which is barely brighter than the limiting magnitude of the Allegheny plates. To solve this problem, one can use deep photographic plates taken with large reflectors, as shown by Dinescu et al. (2000) in the case of the globular cluster Palomar 12. However, photographic plates have been completely phased out as a detector and the size of available single-chip CCDs is too small to cover efficiently the field-of-view of large telescopes.
In this study, we explore an approach by combining archival plates with CCD mosaic images, which are now routinely available on large telescopes. In terms of astrometry, there are several layers of difficulties stemming from this technique. First, the astrometric properties of CCD mosaics are not well understood yet. We have spent considerable effort and time to calibrate the geometry of the NOAO CCD Mosaic Imager at the Kitt Peak National Observatory Mayall 4 m telescope (Platais et al. 2002). One vexatious conclusion from this study is that the CCD mosaic metric may not be stable and requires frequent calibration. Second, the focal planes of nearly all large telescopes are geometrically distorted, with radial pincushion distortion prevailing. This distortion must be taken out prior to calculating the proper motions. Third, NGC 188 is located 5 from the north equatorial pole, resulting in a large zenith distance at all times and thus requiring a considerable correction for atmospheric refraction, including its color dependence. Since the cluster can be observed at the upper and lower culminations, the direction of the refraction vector can vary by up to . Not accounting for this would lead to color-related systematics in positions. Finally, an uneven distribution of cluster members across the field-of-view creates a specific problem related to the choice of a reference frame. In purely differential calculations of proper motions it is desirable to use tentatively selected cluster members as such a reference frame. With few members in the outskirts of a cluster this is not feasible but adding field stars may introduce an unwanted bias in the proper motions as a function of position.
In order to avoid this, we use an external astrometric reference frame constructed earlier (Platais et al. 2002). If all sets of cartesian coordinates are transformed into this frame, it is expected that all coordinates and the subsequent proper motions will also be on the system of our reference catalog coordinates, i.e. the International Celestial Reference Frame (ICRS). Realization of this concept is the basis of our astrometric reductions leading to proper motions and positions down to in the 0.75 square degree (deg2) area around NGC 188. Since several aspects of data reduction are new in the context of cluster astrometric studies, we give all necessary details to aid in future applications. The cluster membership is then calculated for all well-measured stars. By combining photometry, astrometric membership, and radial velocity data we provide a new census of the blue straggler and red giant population in NGC 188.
2 Astrometric Reductions
2.1 Observational material and measurements
The astrometric reductions are based on 30 photographic plates taken with three different large reflectors in Johnson’s bandpasses, combined with numerous CCD mosaic frames obtained with the Kitt Peak National Observatory (KPNO) Mayall 4-m telescope (Table 1). The deepest KPNO 4-m telescope plate, 3140, reaches and was selected to form a master input catalog containing over 8,000 objects, including stars and galaxies. This catalog covers a circular area with a radius , centered on (equinox J2000). The cluster center is located off this center. Thus, the total area of the sky covered by this study is 0.75 deg2. The useful area of the Hale 5-m telescope plates is that of a smaller circle having a radius of .
Recognition should be given to an earlier effort to digitize the KPNO 4-m plates at Kitt Peak (Twarog 1983), for the sake of better photographic photometry and their potential use in future proper-motion studies. Since the Yale 2020G PDS microdensitometer is upgraded with laser metrology, which substantially enhances the measuring precision, we decided to re-scan all of the KPNO 4-m plates, in addition to the Mt. Wilson 60-in and Hale 5-m telescope plates. All plates were scanned in a fine-raster, object-by-object mode. A zeropoint drift in this measuring engine is controlled and accounted for using frequently repeated measurements of several check stars. Image positions were determined with the Yale Image Centering routine (Lee & van Altena 1983), which performs a two-dimensional Gaussian fit to the pixel data.
The CCD observations were obtained with the National Optical Astronomy Observatory (NOAO) 8K8K CCD Mosaic Imager on the Mayall 4-m telescope at KPNO (Table 1). This CCD Mosaic consists of eight thinned, close-packed back-illuminated 20484096 SITe CCDs, covering a total area of on the sky. Since the photographic plates encircle a two times larger area, a five pointing montage of CCD Mosaic frames has been constructed to achieve complete coverage of the entire field. The exposure times range from 10 sec to 180 sec. The PSF fitting technique was chosen to obtain positions and instrumental magnitudes on each of the 856 individual CCD chips among the total of 107 CCD Mosaic frames. The details of PSF fitting are given in Platais et al. (2002).
2.2 Calibrating the sets of coordinates
It is apparent that the mixture of observational data used in this study is not tractable by an ordinary plate-to-plate solution because of large radial pincushion distortions in the focal planes of the several telescopes and the extreme range of hour angles at which NGC 188 had been observed. The low geographic latitudes of the telescope sites (see Table 1) imply large zenith distances even at the upper culmination of NGC 188. Hence, full consideration must be given to an accurate accounting for refraction, including the color effects. Such effects are not possible to correct without knowing the colors of stars. As indicated in Table 1, NGC 188 was observed in the broadband Johnson and thus B Vcolor indices are readily available.
Perhaps, the most straightforward and rigorous approach for handling such a heterogeneous collection of cartesian coordinates is to calibrate each set of coordinates against a distortion-free astrometric flat field. In the course of studying the NOAO CCD Mosaic Imager metrics we created the Lick astrometric reference frame around NGC 188 (Platais et al. 2002) consisting of 1863 stars down to V=17. The positions and proper motions of this reference frame are on the system of the ICRS, as close as it can be represented by 80 Tycho-2 stars in the vicinity of NGC 188 (Høg et al. 2000). Thus, the coordinates from each plate and CCD Mosaic frame were calibrated using this astrometric standard, as described next.
2.2.1 Differential color refraction
Unlike other studies where the target coordinates are precorrected for refraction, we elected to add the expected amount of differential refraction (relative to the field center) to the equatorial coordinates of reference stars, prior to calculating their standard coordinates via a gnomonic projection. Such an approach makes good use of our firm knowledge of the equatorial coordinates and indices for all of the reference stars. For the atmospheric refraction calculation, we used a simple method described by Stone (1996). This method requires only knowledge of the zenith distance, a spectral class or a color index, and meteorological conditions. It should be noted that a ‘gray’ differential refraction, i.e., ignoring the color effects, can be easily accounted for by the lower-order plate constants, whereas the color-related part of refraction manifests itself as non-linear systematics correlated with color. There is a danger, though, in adding an explicit color term to the plate constants because such a term may also be a consequence of magnitude-dependent systematics known as ‘magnitude equation’ in plates or charge transfer effect (CTE) in CCD detectors. In most frequently used and bandpasses, the differential color refraction (DCR) between an A and M spectral type star can reach 50-100 mas even at moderate zenith distances. Therefore, the effect of differential color refraction in high-precision astrometry must be precorrected, as has been advocated by Stone (1996, 2002). We used the code developed by Stone (1996) with a few modifications related to the spectral energy distributions of stars, which is a primary source of DCR in broadband astrometry, especially at short wavelengths. In the K-M spectral range we added a finer grid of empirical spectral energy distributions and also improved the color-to-spectral type transformation ensuring a smooth conversion at all colors.
We note that in order to obtain precise absolute atmospheric refraction, the meteorological conditions (ambient temperature, atmospheric pressure and dew-point readings) should be recorded at the time of observations (Stone 1996). Sometimes partial or even all meteorological readings can be missing, especially for old photographic plates. In such cases, we used the mean seasonal readings for a particular observing site.
2.2.2 Plate scale and mean distortion coefficients
A high-precision astrometric reference frame allows us to derive improved plate scale and distortion coefficients, which are indispensable in astrometric studies not otherwise having an external standard upon which to rely. The only study to address the issue of distortion coefficients for the KPNO 4-m and Hale 5-m telescopes is that by Chiu (1976). To find the Optical Field Angle Distortion (OFAD) characteristics, we used the techniques described in Guo et al. (1993), which allow us to eliminate higher order cross-terms due to the coordinate system rotation and uncertainty in the OFAD center. The resulting coefficients and associated errors are given in Table 2 in both the and bandpasses and separately for the and directions, corresponding to right ascension and declination, as indicated in column 2 (labeled as Set). A combination ‘’ means that the coefficients are nearly identical in both bandpasses and that the coefficients are calculated using all plates. We could not find a bandpass dependence in the scale, but there is a very small though discernible difference between the plate scale in the and direction for the KPNO 4-m plates taken with the UBK-7 Wynne triplet corrector. Similar differences as a function of direction are also noticed for the cubic terms. The origin of these differences is not well-understood and may not even be real. On the other hand, the cubic term for the KPNO 4-m ‘blue’ plates is larger than on the ‘visual’ plates, similar to the findings of Cudworth & Rees (1991) for a nearly identical Cerro Tololo Inter-American Observatory (CTIO) 4-m telescope. It should be noted that the aperture of the Mt. Wilson 60-in telescope was always stopped down to 32 inches, therefore the cubic term may not be valid for the full aperture. There is a trace of barrel distortion for this telescope, albeit only in the -direction. In general, the agreement between our distortion coefficients and those by Chiu (1976) is good. We believe that owing to a much better astrometric reference frame and a large number of common reference stars (up to 1,600) the reliability of our distortion coefficients is higher.
In calculating the equatorial coordinates for all sets of plate measurements, we always first determined the OFAD center and only then applied the mean cubic and fifth-order terms given in Table 2. As pointed out by Guo et al. (1993), the distortion center of the CTIO and KPNO 4-m telescope plates should be known to better than mm in order to fully take out the distortion effects and thus eliminate the need for higher-order plate constants.
Finally, we note that the Hale 5-m telescope plates are of high astrometric quality with a useful field-of-view up to 11 in radius and do not show any signs of the color terms reported by Dinescu et al. (2000), once the differential color refraction has been accounted for. The referee pointed out that the distortion coefficients derived in this study might be valid only for the epoch of our plates. The reason for this caution is a noted instability of the Hale 5-m telescope mirror support system at high zenith distances compounded by a considerable astigmatism. We note that the Hale 5-m telescope cubic distortion term derived for the epoch 1970 and from a field near zenith (Chiu 1976,1980) shows excellent agreement with our study while the fifth-order term in Chiu (1976) is by 20% larger than our value but so is the fifth-order term for the KPNO 4-m telescope. Apparently more studies are warranted to ascertain the stability of distortion coefficients for the Hale 5-m telescope.
2.2.3 Improving CCD Mosaic chip constants
A prerequisite for reliable proper motions is the ability to combine the photographic plates and recent CCD Mosaic frames. In Platais et al. (2002) we describe in detail how to determine the so-called CCD chip constants (position of the chip center and a rotation angle around this center). Since this study, two modifications have been added. First, all 26 CCD Mosaic frames in were also incorporated. Astrometrically these frames are comparable to the frames and, therefore, were used to better determine the chip constants. The cubic distortion term in the bandpass is () rad pixel-3, or () mm-2, which is 0.4% larger than in the bandpass (Platais et al. 2002). There is no perceptible difference in the value of fifth-order distortion in these two bandpasses 111In the system of pixel coordinates introduced in Platais et al. (2002) the mean OFAD center is actually located at =4190 and =4093 pixels.
Second, the residual map (Fig. 5 in Platais et al. 2002) was constructed anew, restricted only to 30 CCD Mosaic frames taken with a 15-30 s exposure time and thus minimizing the atmosphere-induced pattern in residuals. To avoid an unrelated contribution from adjacent CCD chips to the global pixel coordinates, all residuals were strictly subdivided among the eight chips and only then averaged.
2.2.4 Calculating mean positions
To calculate the equatorial coordinates for each plate or CCD Mosaic frame, we followed the prescription given in §2.2.1 by adding the amount of differential refraction to each reference star and temporarily working in a ‘refracted’ coordinate system. Once the equatorial coordinates are obtained for all program stars, the appropriate amount of atmospheric refraction should be, of course, subtracted. This requires a knowledge of B Vcolor indices which are obtained from photographic photometry using the KPNO 4-m telescope plates and photoelectric photometry (Sandage 1962). In the case of CCD Mosaic frames, finding the color index is more complicated. The output of the PSF fit (see §2.1) consists of pixel coordinates and instrumental magnitudes in a given bandpass in some random order. To match these entries with our master input catalog, first, we calculate equatorial coordinates without a differential color refraction term for all 107 CCD Mosaic frames. Then, from all sets of equatorial coordinates, a declination-sorted master CCD catalog is created. A tolerance is used to find multiple detections and, thus, in the vast majority of cases only one entry per object is kept. The master CCD catalog then allows us to i) identify with the master input catalog; ii) find the corresponding magnitudes from the existing photometry source (§3.1) and calculate photometric zero-points for all eight CCD Mosaic chips; iii) calibrate instrumental magnitudes and B Vcolor indices for each object in the master CCD catalog.
In the astrometric reductions (i.e. coordinate transformation) we used a linear plate model plus quadratic plate tilt terms, and . The higher-order distortion was pre-corrected prior to the plate solution. Restriction to the low-order-only plate constants in combination with a large number of reference stars (1,600 for plates and 950 for CCD Mosaic frames), ensures a reliable transfer of the ICRS to much fainter magnitudes over the entire field-of-view. This approach does not require an a priori knowledge of possible cluster members, which then, at least in theory, simplifies the maintenance of proper-motion zeropoint in the periphery of the cluster. This is a well-known problem, if one has to rely upon the pre-selected cluster stars as a reference frame. A centrally concentrated spatial distribution of cluster stars necessitates the inclusion of field stars in the outskirts of the cluster into the reference frame and, hence, may introduce a bias in proper motions as a function of position. The effect of such a variation in the proper-motion zeropoint is increasingly harmful as the precision of proper motions rises, since the intrinsic dispersion of field-star proper motions cannot be reduced.
2.3 Proper Motions and Cluster Membership
In total, there are 137 sets of equatorial coordinates in the ICRS system at the epochs of the plates and CCD Mosaic frames. Once all detections for a given star are found, the proper motion is simply the slope from a linear fit to positions as a function of time (epoch) in years. Since the quality of an object’s image can change from set to set, weights have been assigned to each individual image following the scheme outlined in Platais et al. (1998). In our case, after each fit the residuals are accumulated as a function of height (peak value) of a two-dimensional Gaussian fit to the digitized photographic images, or as a function of instrumental magnitude in the case of CCD Mosaic frames. The so-called ‘scatter curves’ (§3.1 in Platais et al. 1998) for each plate or CCD frame are the sources for the weight estimates. We choose a 4 threshold to eliminate obvious outliers, always starting with the worst one. An elimination rate exceeding 1-2 datapoints for a star usually is a sign of disturbance by an adjacent image or is an indication of a saturated image. Such cases are discussed in more detail in §4.1.
2.3.1 Correction for magnitude equation
Once the first-cut proper motions were calculated, it was evident that many photographic plates showed a considerable magnitude equation in positions, indicated by the dependence of residuals on the Gaussian peak density value (Fig. 1a,b). A fiducial curve was drawn to remove this dependency, as shown by Kozhurina-Platais et al. (1995), and the proper-motion solution repeated using the corrected positions. We note that stars of all magnitudes might suffer from magnitude equation since only the mean of all reference-star residuals (see §2.2.4) has been forced to be zero. Nearly all plates are found to be affected by a magnitude equation of different degree and sign in declination but only 30% of the plates show a weak magnitude equation in right ascension. This is counterintuitive to the notion that a magnitude equation is a guiding-error induced effect, although slightly elongated images are common on many of our plates. We emphasize that the magnitude equation cannot be eliminated entirely in the way described here. In effect, we mostly reduce the scatter due to magnitude equation and hence improve the precision but not necessarily the accuracy of the positions.
It is likely that a mixture of plates taken at various hour angles and with three different telescopes would generate some resultant magnitude equation in proper motions. What really matters is not so much its absolute value as the ratio of ‘magnitude equation to standard error of proper motions’. If this ratio is high, say, over 3, the proper motions of cluster members affected by such a magnitude equation could be misplaced in the vector-point diagram so much that it would yield a very low or even zero membership probability due to the intrinsic rarity of over- events.
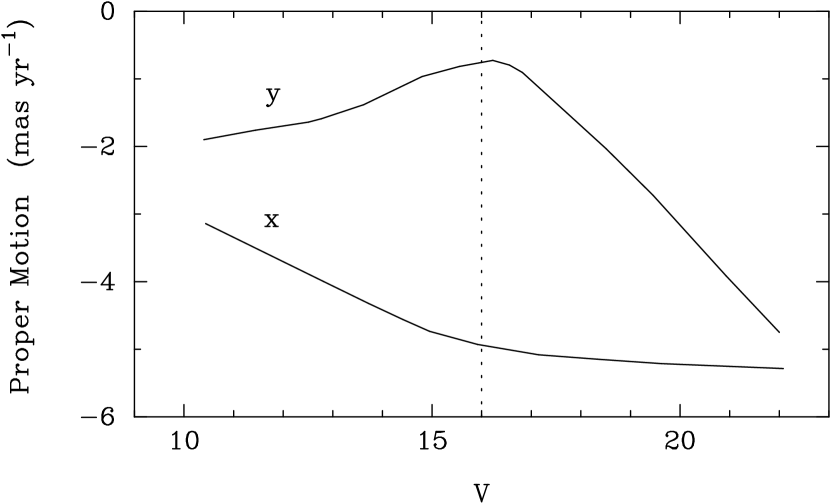
Given the manner in which the star positions have been calculated, it is the faint stars which are most prone to this effect. To examine this, we used the photometric members of NGC 188 selected from the preliminary photometry described in §3.1. The proper motions of these stars clearly indicated the presence of a magnitude equation up to 0.7 mas mag-1 (Fig. 2). The proper motions were, thus, corrected for the magnitude equation relative to the stars with – the approximate mean magnitude of the reference stars.
2.3.2 Spatial bias in proper motions
An analysis of preliminary proper motions for the photometrically-selected members, confronted with their radial-velocity membership (see §3.2), quite unexpectedly revealed the existence of a considerable spatial bias in the proper motions. In other words, a number of bona fide cluster members located near the edges of the field had proper motions incompatible with their radial-velocity membership status. A closer look at this bias indicated mostly a linear dependence of proper motions on both coordinates, , reaching up to 2 mas yr-1. It is likely that the origin of this bias is related to the Tycho-2 proper motions, which were used to update the positions of reference stars in the reductions of the Lick plates. If around NGC 188 there is a spatial bias in the proper motions of Tycho-2 stars, it will propagate through the Lick reference frame stars right into the final proper motions. One way to take out this bias is to correct the proper motions themselves. Since throughout reductions, including the construction of our standard frame from the Lick plates, we always used a linear plate model plus quadratic plate-tilt terms, it is expected that any spatial bias in the proper motions should also comply to the same model. To derive the amount of spatial bias, we used the proper motions of photometric cluster members (supplemented with the radial-velocity membership when possible) and solved for the linear and plate-tilt terms under an assumption that the proper motions of cluster stars must be the same everywhere in the field. Figure 3 shows that after correction by these terms, there is no gross trend in the proper motions of 342 radial-velocity probable cluster members (). It should be mentioned that some systematic spatial pattern at the level of a few tenths of a mas yr-1 is still present in our proper motions. We could not pinpoint the source of this pattern even if, for instance, we eliminate specific sets of plates when calculating the proper motions. Note that a 0.1 mas yr-1 systematic in proper motions will produce an error in tangential velocity equal to 0.8 km s-1. Given the expected three-dimensional velocity dispersion for an old open cluster on the order of 1 km s-1 (cf. Girard et al. 1989), we caution that our proper motions should not be used to obtain a reliable estimate of the internal velocity dispersion.
2.3.3 Precision of proper motions and positions
The formal error of each proper motion is simply the standard error in the slope of a linear fit to the weighted positions. The distribution of proper motion errors is presented in Fig. 4a. The highest precision of our proper motions is 0.15 mas yr-1 per coordinate. The lower envelope of the error distribution represents the well-measured and isolated stars near the center of cluster, which is densely covered by the plate material and CCD Mosaic frames. In the outer parts of the cluster there is no coverage by the Hale 5-m telescope plates and also the number of CCD frames is low; therefore the errors are higher, as indicated by a band-like structure in the error distribution (Fig. 4a). Although we have measured over 7,800 objects, only those with proper-motion errors less than 1.2 mas yr-1 are considered in the subsequent membership analysis. This appears to be the precision limit above which only some definite field stars can be identified by their large proper motion but no reasonable detection of cluster stars is possible, since membership probabilities for such stars never exceed 20% (see §2.3.5.).
The precision of positions is dependent upon the chosen epoch and is optimal at the mean epoch of all positions used in the linear fit. The best positional precision in either coordinate at the mean epoch is 2 mas (Fig. 4b). It should be noted that the mean epoch for the inner area (; see also §2.1) is 1995.5, whereas outside this square the mean epoch drops to 1986.0, which is a consequence of a lower total number of CCD frames used to derive the mean positions. We do not know the contribution by uncertainties in the Lick reference frame positions, therefore it is only provisionally estimated that our positions are within mas on the system of the ICRS in the area of NGC 188. For practical applications the mean epoch and the associated formal positional error is not needed since even the largest error is merely 100 mas. However, for the aficionados of precision astrometry we provide the necessary data to interpolate the errors to any chosen epoch.
2.3.4 Proper motions of galaxies
The depth of this proper motion survey allows us to identify numerous faint external galaxies. Nominally, our proper motions are absolute since all positions are reduced into the inertial ICRS system presumably well-represented by the Tycho-2 stars. The proper motions of galaxies provide an excellent test of this assumption. In total, we are able to visually identify 99 galaxies, excluding the spirals and irregular ones which are not suitable for astrometry. Among the selected galaxies, 70 have formal proper-motion errors ranging between 0.5 to 1.7 mas yr-1. All are fainter than . The color range of these galaxies is 0.5B V1.8. It was a surprise to find that the proper motions of galaxies have a magnitude equation in declination – approximately equal to the applied magnitude equation correction in the stars (see Fig. 2)! On the other hand, it has been long suspected but not proven (Girard et al. 1998, Platais et al. 1998) that stars and galaxies may obey different magnitude equations. Our data suggest that the galaxies are nearly free of a magnitude equation but the stars are not. Hence we undid the magnitude correction which had been applied to galaxies. No less surprising is the mean ‘proper motion’ of galaxies itself, equal to mas yr-1 in and mas yr-1 in . Since we cannot expect to detect the motion of galaxies, this is just a measure of how much the system of mean positions and proper motions of Tycho-2 stars in the area around NGC 188 differs from the ICRS.
2.3.5 Membership probabilities
The vector-point diagram (VPD) for the proper motions derived in this study is shown in Fig. 5. Our combination of the high precision of the proper motions and a careful accounting for the systematic errors leads to the compact appearance of the cluster stars in the VPD. From a variety of membership probability estimators (e.g., Kozhurina-Platais et al. 1995, Dinescu et al. 1996 and references therein) we have chosen to use a local sample concept that employs two-dimensional Gaussian frequency functions for cluster and field, (Kozhurina-Platais et al. 1995). The central idea of the local-sample approach is, for each target star, one selects the stars which share the properties of that target star, e.g., the brightness and spatial location, and use only this representative sample in calculating the membership probability. In this way, it is possible to remove a well-known bias in membership probabilities due to the differences in the shape of the cluster and field star luminosity functions. In the study by Kozhurina-Platais et al. (1995) a moving bin in magnitude and spatial position was used to select the local sample, the bin being centered on the target star. Effectively, in this case, the most important parameter in membership calculation – the proper-motion error – alone can be used to select the local sample. This is made possible by the following two correlations. First, there is a clear correlation in the proper-motion error distribution (Fig. 4a), showing larger errors at fainter magnitudes. Thus, proper-motion error can used to form the equivalent of a magnitude bin. Second, the proper-motion error also has a spatial dependence (Fig. 6). Toward the field edges the proper motion-error gradually increases and, hence, this error can be used to account for a spatial distribution of cluster members. Finally, we note that selecting a sample of proper motions with similar errors solves a complicated statistical problem, if a large range of measuring errors is simultaneously considered (cf. Dinescu et al. 1996).
A critical part of any membership calculation is an accurate representation of the field stars. Usually the parameters of the field-star distribution are calculated simultaneously with that of the cluster stars. However, the mean motion and proper-motion dispersion of the field stars can be estimated apart from the membership probability formalism. We have used the color-magnitude diagram to isolate field stars and then found the center and dispersion of their proper-motion distribution at a range of magnitudes. It appears that the distribution of field star proper motions may require an rotation around the mean center to align it with the axes and eliminate the cross-terms in a Gaussian representing them. Nonetheless, it was not applied due to an uncertainty of this angle of comparable size.
In the case of cluster stars, we take advantage of the fact that the center of their proper-motion distribution is constant at all magnitudes. As with the field stars, we also estimated the dispersion of photometrically-selected cluster members stars, but this time in 0.2 mas yr-1 wide error bins. The magnitude-dependence of the dispersion is smoothed and parametrized for the subsequent membership probability calculation. The adopted cluster center in the vector-point diagram is and mas yr-1. Only stars with proper-motion errors less than 1.2 mas yr-1 are considered in the membership probability calculation. This restriction is motivated by the small separation between the centers of the field, , and cluster-star, , distributions (=3.0 mas yr-1) and a similarly small dispersion for the bulk of the field stars (4 mas yr-1). At larger proper-motion errors the two distributions become almost indistinguishable, which is examplified by the study of Upgren et al. (1972). As pointed out by Dinescu et al. (1996), many highly probable cluster members in Upgren et al. are field stars.
As a result, the only two parameters we need to determine are the heights of the two Gaussian distributions, and , in the vector-point diagram (see Eq. 4 in Kozhurina-Platais et al. 1995). This is easily done for each target star’s local sample, containing stars with nearly identical proper-motion precision. Moving from one target star to another to form a local sample, we used a varying bin size in error ranging from 0.15 to 0.3 mas yr-1, such that the bin size increases for lower-precision proper-motion samples. Once the local sample is selected, we bin its vector-point diagram with a bin size equal to , where is the dispersion of the cluster proper motions having a proper-motion error very close to that of the target star. It is the number of datapoints in each VPD bin what is fitted to the sum of two Gaussians mentioned above. The resulting membership probability is defined as
| (1) |
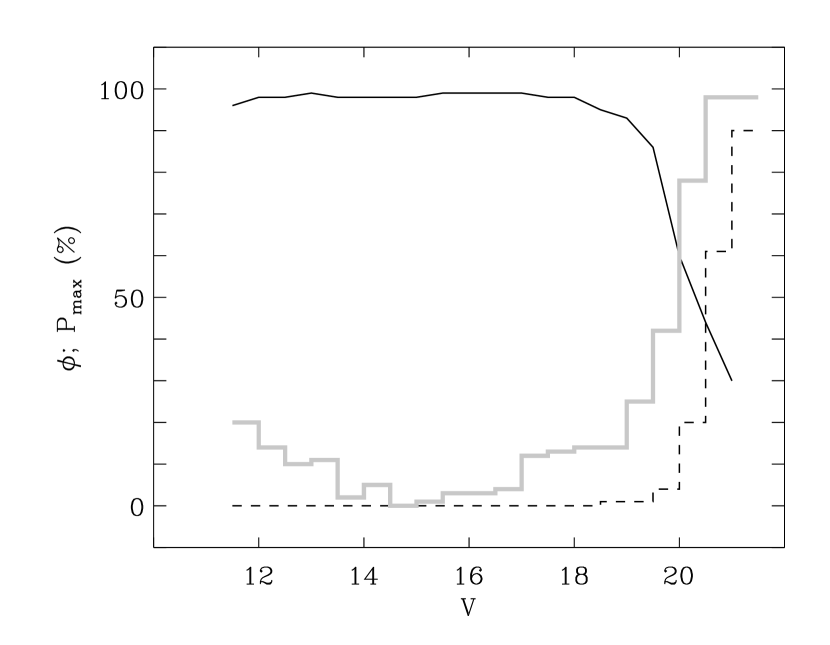
A good indicator of the cluster and field separation is the maximum membership probability as a function of magnitude (Fig. 7). As seen in this plot, very high membership probabilities () extend down to , i.e. at least three magnitudes deeper than prior studies. At fainter magnitudes, the maximum probability gradually declines and at the limiting is only – in conformity with the local sample conception. To isolate cluster members at such faint magnitudes, proper-motion membership should be coupled with the color-magnitude diagram of the same stars. A formal sum of membership probabilities indicates that NGC 188 contains 1050 stars down to .
2.3.6 Cluster membership completeness
Due to the imposed 1.2 mas yr-1 limit on the precision of proper motions, cluster membership has been calculated for only 70% of all stars in our catalog. How does that affect the cluster membership completeness? The vast majority of stars having proper-motion errors higher than this limit are fainter than . However the fraction of such stars is spatially dependent. This is illustrated by the fraction of stars, , not considered in the proper motion membership calculation, as a function of magnitude (Fig. 7). If we examine the stars within the inner circle (radius=) around the cluster center (i.e., the area covered by the Hale 5-m telescope plates), our membership study begins to become incomplete at ; fainter than this the completeness decreases rapidly. On the other hand, outside this inner circle where the proper-motion precision is generally poorer, incompleteness sets in at but does not become severe until . In general, the spatial dependence of this completeness is more complicated since the majority of CCD Mosaic frames, taken with the KPNO 4-m telescope, are on the same central field center (see §§2.1, 2.3.3) and hence the membership completeness also drops beyond the FOV.
Our membership calculation procedure also excludes a few bright cluster members with poor measurements and, hence, a large proper motion error. All such cases are due to some serious problem, e.g., saturated or overlapping images, therefore alternative means such as photometry and radial velocities should also be invoked to decide on membership.
The final result is a catalog222The catalog is available on the WWW at http://www.astro.yale.edu/astrom/. (also Table 3) of positions and proper motions of 7812 stars and galaxies. This smaller number of objects in our catalog as compared to the master input list (see §2.1) is entirely due to the initial inclusion of very bright stars (and their secondary images from the Racine wedge) and extremely faint objects not present on the other plates. Membership probability is given only if the mean proper motion error does not exceed 1.2 mas yr-1. Complete cross-identifications are provided with the Dinescu et al. (1996) catalog and the frequently used list of stars from Sandage et al. (1962).
3 Non-astrometric Data
3.1 Photometry
Although photometry is not the main subject of this study, we encountered issues for whose resolution the magnitudes and colors are indispensable. In other words, the high-precision ground-based astrometry cannot achieve its potential without precise photometry. Among our CCD Mosaic frames, there are 26 frames in and 81 in . At the time of observations it was not possible to obtain photometric standards, except for the one night of October 10, 2001. The spatial extent and density of stars within each of the photometric standard fields (Landolt 1992) are not well-suited to calibrate the Mosaic’s individual CCD chips. To calibrate our photometry, we used the CCD photometry obtained by Hainline et al. (2000) at the KPNO 0.9-m telescope. This study covers a area centered on NGC 188. The offset between this photometry and our instrumental magnitudes, for each individual CCD chip, provides the zeropoint correction. The additional color terms needed to put our photometry onto Johnson’s standard system, were provided by P. Massey (private communication). It is estimated that our CCD photometry is precise to 0.01 mag but less so for due to increasing saturation of images, and for the faintest stars (). Full analysis of our photometry will be presented elsewhere.
To illustrate the quality of the cluster membership determination, we provide several color-magnitude diagrams (CMD). The color-magnitude diagram for all objects (stars and galaxies), having a reliable determination of in our catalog, is provided in Fig. 8. The main sequence NGC 188 is very well visible down to ; however, at fainter magnitudes it is hidden among the numerous Galactic disk dwarfs. Then Fig. 9 shows the CMD for 1490 stars stars with membership probabilities %. A rather low cutoff in probabability is chosen because of our desire to preserve the low-probability faint cluster members, which would be lost applying the traditional cutoff at (see Fig. 7). This CMD shows a clean main sequence down to and distinct populations of subgiants, red giants, and blue stragglers. The hot blue subdwarf at is confirmed to be a cluster member. Finally, the color-magnitude diagram of very likely field stars () does not show any trace of the cluster’s main sequence (Fig. 10). It should be noted that traces were seen in our earlier data (Platais et al. 2000), which prompted us to reconsider the astrometric reductions and develop techniques decsribed here. A detailed analysis of the CMD will be presented elsewhere (Platais et al., in preparation).
3.2 Radial Velocities
Since 1996 precise radial velocities for stars brighter than have been obtained with the WIYN 3.5-m telescope at Kitt Peak, Arizona and the Hydra multi-object spectrograph. This instrumentation provides a resolution of 20,000 at wavelengths around the Mg B triplet (Mathieu 2000). More details about the instrumental setup and reduction technique can be found in Meibom et al. (2001). The corresponding rms velocity precision for a representative single cluster member is 0.45 km s-1 (Meibom et al. 2000). The uncertainty in the WIYN radial velocity zeropoint relative to the IAU radial-velocity standards is found to be within 0.3 km s-1. To date over 5,000 observations have been collected for more than 500 stars in the area of NGC 188. Among these, we have identified 342 members with radial velocities clustered around the (preliminary) mean velocity of km s-1. Owing to this large negative along-the-sight velocity and its high precision, the radial velocities are essential for identifying true cluster members among the blue stragglers and the red giant branch which in the case of NGC 188 has a rather complex appearance.
4 Discussion
4.1 Comparison with Dinescu et al. (1996)
The study by Dinescu et al. (1996), entirely superseding the work by Upgren, Mesrobian, & Kerridge (1972), is presently the source of the highest precision proper motions in NGC 188. There are 1082 stars common with this study. To examine both catalogs in terms of membership probabilities, we have limited the number of common stars to 413 – those having comparable precision of proper motions (1 mas yr-1) in the two catalogs. In general, agreement between the two estimates of membership probabilities, , is remarkably good. Thus, about 83% of selected common stars show differences in membership probabilities smaller than .
Nonetheless, it is important to understand the reasons for large differences in membership probabilities, i.e., when . There are 39 such stars and 35 of them have radial velocity measurements, that provide conclusive evidence of their membership. What can we learn from these stars? First of all, there is a set of seven stars for which our proper motion data are not reliable. These include very close pairs of images. On photographic plates our image centering algorithm has a limited ability to ignore an adjacent, partially overlapping image. Therefore, the calculated center frequently refers to the mean center of both images or is biased to some degree. On CCD Mosaic frames this is much less of a concern if the PSF fitting approach is used, as in our case. Of course, if on the early-epoch photographic plates the measured position of an image is significantly distorted, then having a correct position on the CCD Mosaic frames does not help to obtain reliable proper motions. Among all 7812 catalog stars we have identified 41 cases whose proper motions are hopelessly wrong and have replaced them with and . Some of such stars, having an apparent single image, are located in the vignetted part of photographic plates. It is suspected that many more proper motions may suffer a similar bias albeit at a much smaller scale, therefore all stars having a nearby image within 5 are marked in Table 3 and should be considered with caution. We note that in the catalog of Dinescu et al., several such stars are not resolved and thus their mean proper motion and calculated membership probability are perhaps more realistic.
Second, among the remaining 32 stars (from our sample of 39 stars with discordant probabilities) having no problems with image crowding it is not obvious why the membership probabilities are in disagreement. The radial-velocity membership indicates that in 70% of cases our values correctly reflect their membership status, whereas, for the same stars, the Dinescu et al. catalog predictions appear to be successful at a rate of 30%. For stars brighter than 15, which is about one magnitude brighter than the faint limit of Dinescu et al. study, we recommend considering both catalogs on equal footing; i.e., if either catalog indicates cluster membership for a star, it should be checked by alternative means such as radial velocities.
4.2 Membership of variables, blue stragglers, and red giants
NGC 188 is well-known for an unusually high number of W UMa-type variable stars (Zhang et al. 2002). Among the 19 variables listed by Zhang et al. (2002) and Kaluzny (1990), we have measured all stars except the variable V19, which is located outside our field. Table 4 contains membership probabilities of 18 variables (with prefix ”V” from Zhang et al. 2002); 11 of them are confirmed cluster members. NGC 188 contains at least six W UMa-type variables and one detached eclipsing binary. Very recently Kafka & Honeycutt (2003) published a list of newly found variable stars in the region of NGC 188. In Table 4 these variables are listed with a prefix ”WV”. A large fraction of them are genuine cluster members.
Sandage (1962) was first to point out the presence of blue stars above the main sequence – the blue stragglers. Eggen & Sandage (1969) identified 11 blue straggler candidates, whereas Dinescu et al. (1996) expanded that list to 15 stars. Here we have attempted to select all possible blue straggler candidates, based on the following criteria:
-
1.
Color bluer than so that the main sequence is entirely excluded. The stars located under the main sequence but not fainter than are also considered.
-
2.
Proper-motion membership probability higher than =50%.
-
3.
Radial velocity indicates cluster membership. The star is considered a cluster member, if its mean radial velocity (or gamma-velocity in the case of spectroscopic binaries) is within 2.5 km s-1 from the mean cluster velocity (see §3.2).
A few stars with membership probabilities lower than =50% are also included as blue straggler candidates, if their radial velocities are consistent with cluster membership. Such stars could be among our astrometric problem stars (§4.1) or located near the field edges. For stars near the main sequence turnoff there is an ambiguity in their identification as blue stragglers or photometric binaries. As opposed to Eggen & Sandage (1969), we have opted not to include such stars (e.g., 4506, 5080, 5101) among our blue straggler candidates. In total, 35 stars satisfying all three of these conditions, or at least the first two when a radial velocity measurement is not available, are given in Table 5. In this table, we give our number (ID), cross-identication with Dinescu et al. (1996) catalog (ND96), astrometric membership probability (), and radial velocity membership status, RVm. We note again that radial velocity data are very reliable in identifying blue stragglers, although in the cases of binaries extended monitoring is usually required to firmly establish their membership. The number of bona fide blue straggler members of NGC 188 (i.e., with and similarly high membership probability from Dinescu et al. (1996) and established radial-velocity membership) is at least 19. Thus NGC 188 offers a rich sample of blue stragglers, comparable to that in the Galactic globular clusters (Ferraro, Fusi Pecci, & Bellazini 1995).
For years the study by McClure (1974) has served as a canonical source list of red giants in NGC 188, encompassing nine established cluster members. The actual number of red giants is much larger as indicated by the Dinescu et al. (1996) estimate of about 40 red giants. In this study we provide a new census of red giants (Table 6) comprising a total of 55 such stars. A red giant is included in this list if it is brighter than , redder than , and is a cluster member according to our proper motions and/or radial velocities. The chosen color and magnitude limits are very close to those in Dinescu et al. (1996) study. For a few stars missing our radial velocity data, such information was provided by E. Green and J. Sperauskas (private communications). Similarly to Table 5 we also included a few low membership probability stars with the same motivation as for the blue stragglers. Faint red giants () are not included in Table 6 because of a possible confusion with subgiants. The brightest red giant in NGC 188 is star 6175 at .
4.3 Absolute proper motion of NGC 188
Following the discussion of the galaxy ‘proper motions’ in §2.3.4, we can obtain a new measurement of the absolute proper motion of NGC 188. Thus, subtracting the mean proper motion of the galaxies from the mean motion of the cluster , , its absolute proper motion is and mas yr-1.
Baumgardt, Dettbarn, & Wielen (2000) have provided first direct estimate of the absolute proper motion of NGC 188 using two Hipparcos stars. Only one of them, HIP 4349 (6175 in our catalog), is a bona fide cluster member; however, its large proper motion error () in the Hipparcos catalog (ESA, 1997) prevents us from using this star in direct comparison. Our absolute proper motion differs considerably (by mas yr-1) from the value derived indirectly from the stellar kinematics by Upgren et al. (1972).
In light of the considerable magnitude-equation correction necessary for the faint stars but not the galaxies (see §2.3 and Fig. 2), it can be questioned how well we actually determine the absolute proper motion of NGC 188. Unable to compare directly Hipparcos and our proper motions, we use the Lick reference frame (Platais et al. 2002) for external checks. A total of five Hipparcos stars yield the following differences in proper motions in the sense ‘Hipparcos – Lick’: , mas yr-1. These differences indicate that the system of Lick proper motions is reasonably close to the ICRS and a small correction in declination, deduced from the galaxy proper motions, is consistent with Hipparcos data. In right ascension such consistency is less evident, although it is this coordinate, in which the correction in faint-star proper motions is relatively small (see Fig. 2). Thus we estimate that the absolute proper motion of NGC 188 is probably accurate only to 0.5-1 mas yr-1.
4.4 Center of cluster
Although seemingly easy to derive, a precise estimate of the cluster center location cannot be found in the literature. Two subtle problems make the determination of a cluster center non-trivial. First, our field-of-view is not centered on the cluster (see §2.1), so that some undetected peripheral cluster members may reside beyond its near edge. Second, the spatial distribution of probable cluster members is slightly asymmetric.
Two techniques were used in deriving the cluster center. The first consists of the mean center coordinates of a series of concentric samples of cluster members, the center of each sample defined as the median position along right ascension and declination. For this purpose, we formed two initial samples, selecting stars near the main sequence (Fig. 9) having membership probabilities , and then selecting those with , supplemented with the blue stragglers and red giants from Tables 5,6. These two samples were trimmed at a number of radii ranging from to , using an initial estimate of the cluster center. The median position of each trimmed subsample was calculated and the mean of all these median measures determined. The process was iterated to convergence. A more rigorous approach is to fit the cluster’s apparent density profile in both directions. We assume a simple Gaussian profile that gives us a reasonable approximation of the observed density profile, which is true only to the extent that the asymmetry in the real profile can be ignored. Nonetheless, both approaches yield a consistent cluster center, equal to and (J2000) with the estimated standard error from the scatter of derived cluster centers indicated in Table 7. This is away from the center of Ring I (Sandage 1962), usually adopted as the center of NGC 188. The basic astrometric data are summarized in Table 7.
5 Conclusions
This study serves a two-fold purpose. First, we have shown that precision astrometry is feasible using a combination of various old photographic plates and recent CCD Mosaic frames. Once properly calibrated, the CCD mosaic imagers are excellent devices for astrometry.
Second, we have obtained precise proper motions and new astrometric membership probabilities down to in the 0.75 deg2 area around the old open cluster NGC 188. The total number of cluster members down to this limiting magnitude is about 1,050. The unprecedented depth of accurate proper motions now allows us to probe the main sequence of NGC 188 down to without any ad hoc assumptions about the field-star contamination.
The key to achieving a high accuracy in this case of heterogeneous observations of NGC 188, all obtained at high zenith distances, is a careful correction for differential color refraction. This requires a knowledge of star colors, which is to say that photometry at least in two bandpasses is essential to astrometry in order to fully realize its potential and to avoid a possible color-related systematic bias. In addition, a prior knowledge of the so-called photometric cluster members greatly facilitates the detection and correction for systematic errors such as a magnitude equation.
Using a diverse set of first-epoch photographic material leads to an array of significant systematic errors, which made this study far more complex than expected. The chosen path of deriving proper motions via the astrometric reference frame is not infallible due to the required high accuracy of such a standard. However, the traditional approach of using the ‘best plate’ as an initial reference frame is equally prone to systematic errors and at this point is not feasible for the CCD Mosaic frames, which themselves require a careful calibration.
We provide a new determination of the absolute proper motion of NGC 188, calibrated against background galaxies. Our proper motions support the membership of six W UMa-type eclipsing binaries found in NGC 188, thus confirming the high rate of these variables in this open cluster. NGC 188 also contains at least 19 blue stragglers, which undoubtedly will provide new insights in the origin of these unusual stars.
References
- Baumgardt et al. (2000) Baumgardt, H., Dettbarn, C., & Wielen, R. 2000, A&AS, 146, 251
- Chiu (1976) Chiu, L.-T.G. 1976, PASP, 88, 803
- Chiu (1980) Chiu, L.-T.G. 1980, ApJS, 44, 31
- Cudworth & Rees (1991) Cudworth, K.M., & Rees, R.F. 1991, PASP, 103, 470
- Dinescu et al. (1996) Dinescu, D.I., Girard, T.M., van Altena, W.F., Yang, T.-G., & Lee, Y.-W. 1996, AJ, 111, 1205
- Dinescu et al. (2000) Dinescu, D.I., Majewski, S.R., Girard, T.M., & Cudworth, K.M. 2000, AJ, 120, 1892
- Eggen & Sandage (1969) Eggen, O.J., & Sandage, A. 1969, ApJ, 158, 669
- ESA (1997) ESA 1997, The Hipparcos and Tycho Catalogues, (ESA SP-1200) (Noordwijk:ESA)
- Girard et al. (1989) Girard, T.M., Grundy, W.M., López, C.E., & van Altena, W.F. 1989, AJ, 98, 227
- Girard et al. (1998) Girard, T.M., Platais, I., Kozhurina-Platais, V., van Altena, W.F., & López, C.E. 1998, AJ, 115, 855
- Guo et al. (1993) Guo, X., Girard, T.M., van Altena, W.F., & López, C.E. 1993, AJ, 105, 2182
- Ferraro et al. (1995) Ferraro, F.R., Fusi Pecci, F., & Bellazzini, M. 1995, A&A, 294, 80
- Hainline et al. (2000) Hainline, L.J., Deliyannis, C.P., Sarajedini, A, & Bailyn, C. 2000, BAAS, 32, 742
- Hog et al. (2000) Høg, E., Fabricius, C., Makarov, V.V., Urban, S., Corbin, T., Wycoff, G., Bastian, U., Schwekendiek, P., & Wicenec, A. 2000, A&A, 355, L27
- Kafka & Honeycutt (2003) Kafka, S., & Honeycutt, R.K. 2003, AJ, 126, 276
- Kaluzny (1990) Kaluzny, J. 1990, Acta Astron., 40, 61
- Kozhurina-Platais et al. (1995) Kozhurina-Platais, V., Girard, T.M., Platais, I., van Altena, W.F., Ianna, P.A., & Cannon, R.D. 1995, AJ, 109, 672
- Landolt (1992) Landolt, A.U. 1992, AJ, 104, 340
- Lee et al. (1983) Lee, J.-F., & van Altena, W.F. 1983, AJ, 88, 1683
- Mathieu (2000) Mathieu, R.D. 2000, in ASP Conf. Ser. 198, Stellar Clusters and Associations: Convection, Rotation, and Dynamos, ed. R. Pallavicini, G. Micela, & S. Sciortino (San Francisco: ASP), 517
- McClure (1974) McClure, R.D. 1974, ApJ, 194, 355
- Meibom et al. (2000) Meibom, S.C.D., Barnes, S.A,. Dolan, C.J., & Mathieu, R.D. 2000, BAAS, 32, 1461
- Meibom et al. (2001) Meibom, S.C.D., Barnes, S.A,. Dolan, C.J., & Mathieu, R.D. 2001, in ASP Conf. Ser. 243, From Darkness to Light: Origin and Evolution of Young Stellar Clusters, ed. T. Montmerle, & P. André (San Francisco: ASP), 711
- Platais et al. (2000) Platais, I., Kozhurina-Platais, Demarque, P., Girard, T.M., van Altena, W.F., & Klemola A.R. 2000, BAAS, 32, 741
- Platais et al. (1998) Platais, I., Girard, T.M., Kozhurina-Platais, V., van Altena, W.F., López, C.E., Méndez, R.A., Ma, W.-Z., Yang, T.-G., MacGillivray, H.T., & Yentis, D.J. 1998, AJ, 116, 2556
- Platais et al. (2002) Platais, I., Kozhurina-Platais, V., Girard, T.M., van Altena, W.F., Klemola, A.R., Stauffer, J.R., Armandroff, T.E., Mighell, K.J., Dell’Antonio, I.P., Falco, E.E., & Sarajedini, A. 2002, AJ, 124, 601
- Sandage (1962) Sandage, A. 1962, ApJ, 135, 333
- Sarajedini et al. (1999) Sarajedini, A., von Hippel, T., Kozhurina-Platais, V., & Demarque, P. 1999, AJ, 118, 2894
- Stone (1996) Stone, R.C. 1996, PASP, 108, 1051
- Stone (2002) Stone, R.C. 2002, PASP, 114, 1070
- Twarog (1983) Twarog, B.A. 1983, BAAS, 15, 645
- Upgren, Mesrobian, & Kerridge (1972) Upgren, A.R., Mesrobian, W.S., & Kerridge, S.J. 1972, AJ, 77, 74
- (33) von Hippel, T., & Sarajedini, A. 1998, AJ, 116, 1789
- Zhang et al. (2002) Zhang, X.B., Deng, L., Tian, B., & Zhou, X. 2002, AJ, 123, 1548


| Telescope | Latitude | Plates | Epoch Range | Scale |
|---|---|---|---|---|
| Mt. Wilson 60-in | 5,2 | 1958-1959 | mm-1 | |
| Hale 5-m | 33.36 | 2,2 | 1960 | mm-1 |
| KPNO 4-m | 31.96 | 10,9 | 1975-1979 | mm-1 |
| KPNO 4-m | 31.96 | 26,81 | 1998-2001 | pix-1 |
| Telescope | Set | Scale (/mm) | Cubic Term (mm-2) | Fifth Order (mm-4) |
|---|---|---|---|---|
| Mt. Wilson 60-in | () | |||
| () | ||||
| Hale 5-m | () | () | ||
| () | () | |||
| KPNO 4-m | (0.017) | () | ||
| (0.017) | () | |||
| (0.018) | () | |||
| (0.014) | () |
| Var | ID | (%) | Var | ID | (%) | |
|---|---|---|---|---|---|---|
| V1 | 4873 | 98 | WV9 | 5481 | 0 | |
| V2 | 4982 | 82 | WV10 | 4329 | 86 | |
| V3 | 5361 | 0 | WV11 | 5361 | 0 | |
| V4 | 5337 | 96 | WV12 | 4997 | 85 | |
| V5 | 4989 | 95 | WV15 | 6118 | 0 | |
| V6 | 5004 | 71 | WV16 | 8077 | 0 | |
| V7 | 5912 | 0 | WV17 | 5810 | 83 | |
| V8 | 5629 | 0 | WV18 | 4751 | 97 | |
| V9 | 4736 | 97 | WV19 | 6208 | 0 | |
| V10 | 5459 | 94 | WV20 | 5781 | 98 | |
| V11 | 4705 | 98 | WV21 | 5354 | 94 | |
| V12 | 5762 | 97 | WV22 | 5178 | 0 | |
| V13 | 5209 | 98 | WV23 | 4086 | 90 | |
| V14 | 8495 | 0 | WV24 | 4656 | 98 | |
| V15 | 6571 | 0 | WV26 | 3953 | 97 | |
| V16 | 6574 | 0 | WV27 | 4247 | 0 | |
| V17 | 324 | 0 | WV28 | 4508 | 98 | |
| V18 | 6842 | 0 | WV29 | 4679 | 0 | |
| WV2 | 5569 | 98 | WV30 | 5800 | 0 | |
| WV3 | 5379 | 98 | WV31 | 7290 | 52 | |
| WV4 | 4304 | 97 | WV32 | 5516 | 24 | |
| WV5 | 4742 | 98 | WV33 | 5769 | 0 | |
| WV6 | 4748 | 98 | WV34 | 5767 | 98 | |
| WV7 | 4396 | 98 | WV35 | 5876 | 0 | |
| WV8 | 4750 | 96 |
| ID | ND96 | (%) | RVm | ID | ND96 | (%) | RVm | |
|---|---|---|---|---|---|---|---|---|
| 451 | 1874 | 7 | m | 5078 | 687 | 98 | m | |
| 1066 | 68 | 5237 | 69 | |||||
| 1888 | 1793 | 98 | m | 5325 | 1370 | 98 | m | |
| 1988 | 1760 | 96 | 5350 | 758 | 93 | m | ||
| 2679 | 1666 | 21 | m | 5379 | 772 | 98 | m | |
| 4230 | 1342 | 93 | m: | 5397 | 777 | 96 | m | |
| 4290 | 485 | 98 | m | 5434 | 711 | 97 | m | |
| 4306 | 483 | 99 | m | 5671 | 444 | 95 | m | |
| 4348 | 632 | 93 | m | 5885 | 702 | m | ||
| 4447 | 1468 | 90 | m: | 5934 | 681 | m | ||
| 4474 | 1466 | 98 | m | 6069 | 1321 | 79 | ||
| 4535 | 1436 | m | 6882 | 54 | ||||
| 4540 | 1437 | 92 | m | 7782 | 198 | 11 | m | |
| 4581 | 1346 | 98 | m | 8104 | 237 | 91 | ||
| 4589 | 1387 | 98 | m | 8222 | 61 | |||
| 4805 | 92 | 8386 | 543 | 96 | m | |||
| 4970 | 746 | 98 | m | 8899 | 56 | 29 | m | |
| 5020 | 721 | 90 | m |
| ID | ND96 | (%) | RVm | ID | ND96 | (%) | RVm | |
|---|---|---|---|---|---|---|---|---|
| 736 | 1612 | 39 | m | 5085 | 686 | 98 | m | |
| 1141 | 1819 | 88 | m | 5133 | 566 | 98 | m | |
| 1216 | 32 | 5179 | 537 | 67 | m | |||
| 2442 | 13 | 5356 | 763 | 98 | m | |||
| 3015 | 1161 | 24 | m | 5373 | 771 | 95 | m | |
| 3037 | 1049 | 1 | m | 5438 | 710 | 98 | m | |
| 3046 | 1053 | 0 | m | 5597 | 1267 | 26 | m | |
| 3062 | 1607 | 20 | m | 5700 | 458 | 98 | m | |
| 3118 | 1628 | 34 | m | 5747 | 463 | 98 | m | |
| 3271 | 1572 | 94 | m | 5835 | 1519 | 94 | m | |
| 3942 | 1552 | 98 | m | 5855 | 461 | 98 | m | |
| 4150 | 1617 | 72 | m | 5887 | 569 | 1 | m | |
| 4228 | 1461 | 98 | m | 5894 | 575 | 99 | ||
| 4292 | 803 | 98 | m | 5927 | 690 | 0 | m | |
| 4294 | 484 | 96 | m | 6175 | 359 | 5 | m | |
| 4346 | 691 | 98 | m | 6188 | 434 | 98 | m | |
| 4524 | 1355 | 97 | m | 6353 | 362 | 89 | m | |
| 4565 | 1353 | 96 | m | 6586 | 1223 | 95 | m | |
| 4668 | 665 | 98 | m | 6602 | 1182 | 35 | m | |
| 4671 | 672 | 98 | m | 6687 | 337 | 6 | m | |
| 4705 | 643 | 98 | m | 6982 | 437 | 74 | m | |
| 4756 | 473 | 71 | m | 8129 | 241 | 95 | m | |
| 4829 | 1503 | 98 | m | 9159 | 73 | 88 | m | |
| 4843 | 1488 | 75 | m | 9205 | 44 | 82 | m | |
| 4909 | 1393 | 96 | m | 9291 | 35 | 53 | ||
| 5027 | 719 | 96 | m | 9351 | 88 | 78 | m | |
| 5048 | 678 | 94 | m | 9401 | 20 | 73 | m | |
| 5055 | 793 | 95 | m |
| Parameter | Value and its error | ||
|---|---|---|---|
| Cluster center (J2000) | () | () | |
| Galactic coordinates | |||
| Absolute proper motion (mas yr-1) | |||
| No. of cluster members () | 1050 | ||