GRB 020813: polarization in the case of a smooth optical decay††thanks: Based on observations collected at the European Southern Observatory, Cerro Paranal (Chile), ESO programmes 69.D-0461(A) and 69.D-0701(A).
We present the results of a VLT polarimetric monitoring campaign of the GRB 020813 optical afterglow carried out in three nights, from 0.88 to 4.20 days after the gamma-ray event. The mean values of the degree of linear polarization () and its position angle () resulting from our campaign are and , after correcting for Galactic interstellar polarization. Our VLT data set is most naturally described by a constant degree of linear polarization and position angle, nonetheless a slow evolution cannot be entirely ruled out by our data. The VLT monitoring campaign did not reveal either a significant rotation respect to the Keck spectropolarimetric observations performed days after the GRB (Barth et al. Bart03a (2003)). However, is a factor of two lower than the polarization degree measured from Keck. Additionally, the VLT polarization data allowed us to construct an accurate -band light curve. The -band photometric data revealed a smooth light curve with a break located between the last Keck and our first VLT polarimetric measurement, days after the GRB. The typical magnitude fluctuations of the VLT -band lightcurve are mag, mag and mag for our three observing nights, respectively. We speculate that the stability of might be related to the smoothness of the light curve.
Key Words.:
gamma rays: bursts – techniques: photometric – techniques: polarimetric1 Introduction
GRB 020813 was detected by the HETE-2 spacecraft on Aug 13.11411 UT (Villaseñor et al. Vill02 (2002)) as a bright long (duration 125 s; Hurley et al. Hurl02 (2002)) gamma-ray burst (GRB) and its position was rapidly disseminated among the GRB community. After the optical afterglow (OA) discovery (Fox, Blake & Price Fox02 (2002)) it was subject of an intensive radio (Frail & Berger Frai02 (2002); Bremer & Castro-Tirado Brem02 (2002)), X-ray (Butler et al. Butl03 (2003)), optical (Li et al. Li03 (2003); Laursen & Stanek Laur03 (2003); Urata et al. Urat03 (2003)), near-IR (Covino et al. 2003a ), polarimetric (Barth et al. Bart02 (2002); Covino et al. Covi02 (2002)) and spectroscopic (Price et al. Pric02 (2002); Barth et al. Bart03a (2003)) follow-up.
Among the thousands of GRBs detected to date, only 50 of those accurately localized111See http://www.mpe.mpg.de/jcg/grbgen.html have been pinpointed at optical wavelengths. Positive linear polarization detections have been reported for 7 of them, typically at a level of (with the possible exception of the polarization reported for GRB 020405 by Bersier et al. Bers03 (2003)). A review on the polarization detections to date can be found in Covino et al. (2003b ) and Björnsson (Bjor02 (2002)). Optical afterglow emission is widely accepted to be synchrotron radiation, the result of the interaction of the GRB relativistic wave with the circumburst medium (fireball model; see Rees & Mészáros Rees92 (1992) and Mészáros & Rees Mesz97 (1997)). In general, if the fireball configuration is not symmetric, some degree of polarization is expected from the synchrotron radiation.
Several asymmetric scenarios able to account for the polarization typically measured in OAs have been proposed. Among them are: ) causally disconnected magnetic patches (Gruzinov & Waxman Gruz99 (1999)), ) a homogeneous collimated fireball observed off-axis (Ghisellini & Lazzati Ghis99 (1999); Sari Sari99 (1999)) and ) a similar scenario where the jet is structured (the collimated energy per unit angle decays smoothly with the angle from the jet axis; Rossi et al. Ross02 (2002)).
In the context of ) and are expected to change on the same time scale. The latter two scenarios ( ) and ) ) show characteristic evolutions of and when the outflow slows down and the Lorentz factor decreases. It is especially interesting that scenario predicts a double-peaked evolution of the degree of polarization, with a polarization angle change of 90 degrees in between the two peaks, while in contrast scheme predicts a single peak of polarized emission, with a constant polarization angle. If an ordered magnetic field exists in the medium into which the shock propagates, this can result in a roughly constant in time, accompanied by a variable (Granot & Königl Gran03 (2003)).
Among the 7 positive OA polarization detections there are only two clear cases (GRB 021004 and GRB 030329) where a rotation in the polarization angle has been reported (Rol et al. Rol03 (2003); Greiner et al. Grei03 (2003)). In both cases the OA shows a complex light curve. So a satisfactory description of the polarization evolution is still pending. In the present paper we report an intensive polarimetric follow up of the GRB 020813 OA. In a companion paper Lazzati et al. (Lazz04 (2004)) report a physical interpretation of the polarization data published in this study.
2 Observations
The polarimetric follow up observations started days after the gamma-ray event. The observations were performed in the -band with the FOcal Reducer/low dispersion Spectrograph 1 (FORS1) at the Very Large Telescope (VLT), unit 3. The 2048 2048 FORS1 CCD yields a pixel scale of /pix, and was used in the high gain 4-ports readout mode. A Wollaston prism in tandem with a rotatable half-wave retarder allowed us to determine the Stokes and parameters. For each retarder angle , two orthogonal simultaneous images with polarization angles and were obtained. Our polarimetric data are based on four values (0.0, 22.5, 45.0, and 67.5 degrees), the observations being consecutive executions of four exposure cycles. The log of observations presented in Table 1 contains 33 polarimetric cycles executed during three nights, amounting to hr of VLT exposure time.
3 Analysis
The images were reduced following standard procedures. First, for each of the FORS1 images the chip overscan of the four readout ports was subtracted. This was done because the four pedestal levels vary slightly from one image to another. This procedure was carried out for all the science and calibration images (including the bias images). Then a master bias frame was constructed by median combination and subtracted from the science and flat field images. Finally the science images were divided by a master normalized flat field image. The master flat field image was created combining sky flat field frames that were acquired without the Wollaston prism and the retarder plate in the light path222Following the recommendations given in http://www.eso.org/instruments/fors1/pola.html. This procedure was applied separately to the data taken each observing night.
The photometry is based on circular aperture photometry, fixing the radius to the OA Full Width at Half Maximum (FWHM). The results presented in this study remain qualitatively unaltered for aperture radii ranging from 0.5 to 3 times the OA FWHM. Verification of the photometry, calibration, and the reduction procedure, were performed observing each night a polarization standard star; BD (13-14/08/2002), Hiltner 652 (14-15 and 16-17/08/2002). The photometry and the reduction of the standard stars was identical to the one applied to the science images.
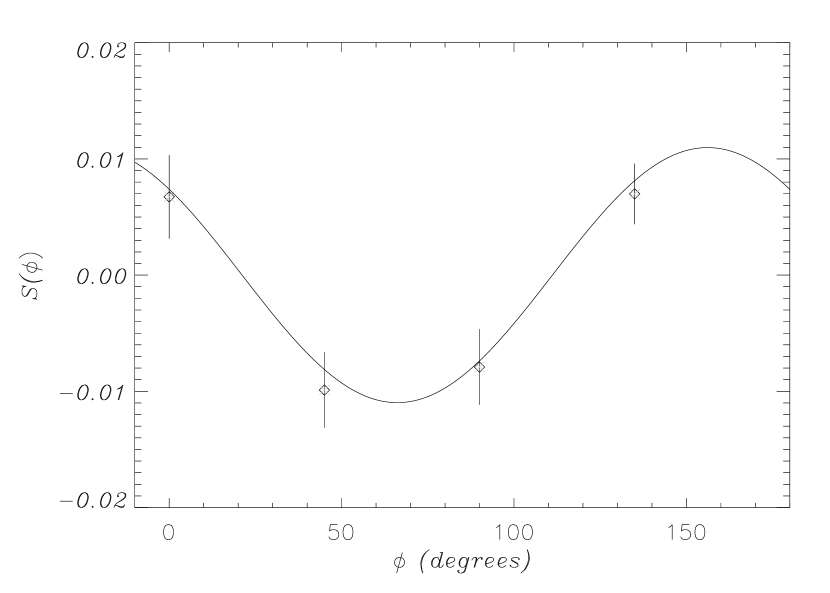
The determination of the parameters describing the linear polarization of ( and ) is based on the construction of the function for the four retarder angles following the procedure described in Covino et al. (Covi99 (1999)). Then a fit of the form was used to evaluate simultaneously the values of and . An independent verification of the derived and values was performed evaluating the Stokes parameters (, ) for all the objects in the GRB field based on Fourier transformation arithmetics (see FORS1 manual expressions333FORS1+2 manual, ref. VLT-MAN-ESO-13100-1543, posted at http://www.eso.org/instruments/fors/userman/). Both methods yielded consistent results (see Fig. 1).
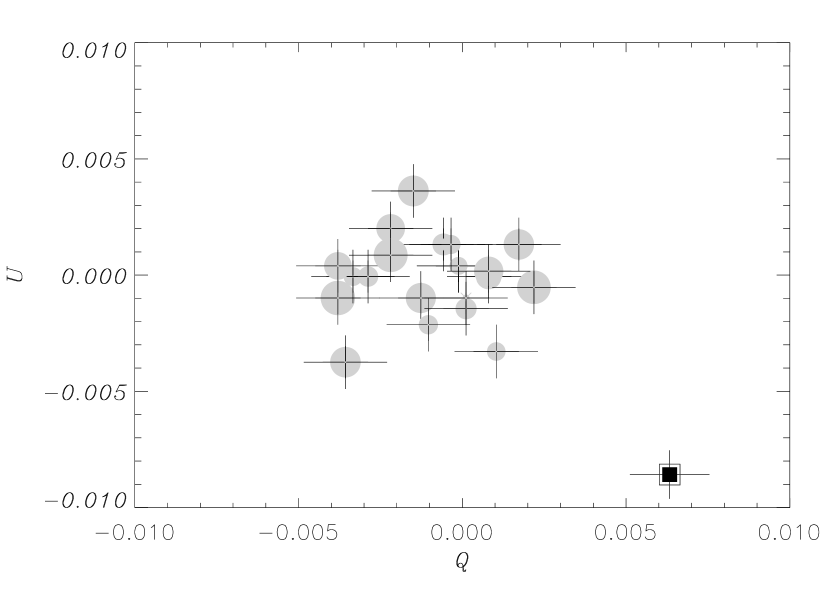
The Galactic interstellar Medium (ISM) reddening in the direction of GRB 020813 is not negligible ( mag; Schlegel et al. Sche98 (1998)), so it induces (approximately) a systematic offset for all the field objects in the Stokes (, ) plane. Thus, in order to compensate the effect of the ISM, the weighted mass center of the (, ) distribution was calculated for 20 stars in the field and shifted to the Stokes plane origin. We realized that stars located close to the border of the FORS1 chip show a residual polarization once the interstellar polarization effect has been corrected (see upper panel of Fig. 1). Thus, stars located further than from the image center were not used for the Galactic ISM polarization correction. The introduced mean offset is given by and . These values correspond to and , in agreement with the ISM correction carried out by Covino et al. (Covi02 (2002)): and . We have verified that for the applied (, ) mean offset the field stars remain, at different epochs, at the same position (within errors) on the Stokes plane. Empirical relations (Serkowski, Mathewson & Ford Serk75 (1975)) indicate that mag, in agreement with the derived in the direction of GRB 020813.
Once the ISM correction is introduced, the value of has been multiplied by , being the standard deviation of . This correction factor is introduced because is positive by definition, so averaged low signal-to-noise (S/N) polarization estimates (as in our case) tend to overestimate the actual value of (di Serego Alighieri dise97 (1997)). Although FORS1 uses a super-achromatic half-wave plate, it introduces an offset in the -band polarization angle of , which has to be subtracted from the inferred values.
4 Results and discussion
4.1 Determination of the break time
The accurate determination of the light curve break has an important impact on the interpretation of the polarimetric evolution. However, the published positions of the -band break time () are not in close agreement. Thus, Urata et al. (Urat03 (2003)) report days, whereas Covino et al. (2003a ) give days. In addition, Li et al. (Li03 (2003)) determined an -band break time at based on data of the KAIT telescope. Again this break time is not consistent with the -band break time ( days) derived by Covino et al. (2003a ). Therefore, it is not clear whether the spectropolarimetric Keck observations carried out days after the GRB (Barth et al. Bart03a (2003)) were acquired after, during or before the break.
Given the relevance of a proper determination, we have enhanced our VLT sample with the published GRB 020813 -band magnitudes to date (Di Paola et al. DiPa02 (2002); Covino et al. 2003a ; Urata et al. Urat03 (2003)) and fitted a smoothly broken power law444, with being the pre () and post () break power law decays, and a non negative number. In this formalism (Beuermann et al. Beue99 (1999)). At this point no host galaxy contribution was considered in the fit, repeating exactly the procedure previously carried out by other authors for GRB 020813 (Covino et al. 2003a ; Urata et al. Urat03 (2003)). The compiled -band data points were shifted to our VLT photometric zero point (see Sect. 4.2). The fit yields days, in agreement with the results by Covino et al. (2003a ; days).
We have checked the impact that the host galaxy contribution ( of the total -band flux of our last VLT data points) might have on the fit and therefore on the determination. For this purpose two additional late epoch data points (where the host is dominant) were added to our data set. First, the -band data points acquired with the 1.54m Danish Telescope (1.54dk) 58.5 days after the burst (Gorosabel et al. Goro02 (2002)) were interpolated in the -band yielding . Second we included in our fits the HST/ACS -band magnitude () based on the observations carried out days after the GRB event555A detailed analysis on the light curve and the HST observations (Based on data acquired under Cycle 11 programme #9405, P.I.: Fruchter, A.S.) is beyond the scope of the present paper, and will be published elsewhere (Castro Cerón et al. Cast04 (2004)).. In this case the smoothly broken power law fit yields days, indicating the lack of enough -band data for a simultaneous fit in the entire parameter space (given by , , , , and ).

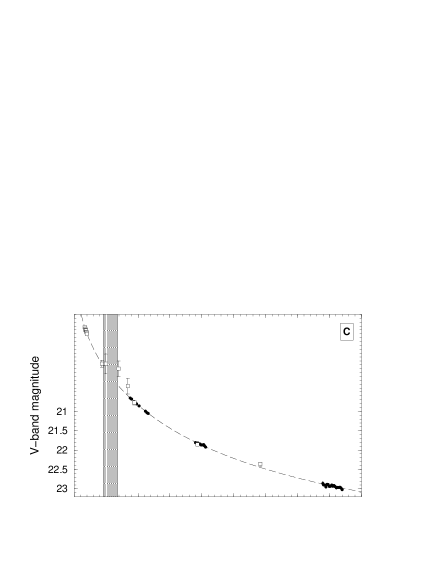
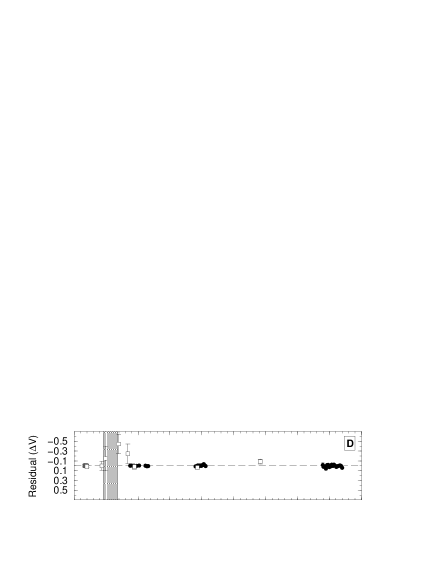

In order to reduce the number of parameters in the fit was fixed, as previously carried out for other OAs (Israel et al. Isra99 (1999); Stanek et al. Stan99 (1999)). Then, leaving as a free parameter, the fit is improved (), yielding; , , days, and (see Fig. 2 panel C). The inferred value again supports the -band break time reported by Covino et al. (2003a ), reducing its error by a factor of . The shaded vertical band of Fig. 2 indicates the uncertain region of when . The exercise was repeated for values, which implied higher and values, hence degrading the fits. In any case for any reasonable value of () the inferred break time is days, epoch when our VLT polarimetric observations started. For values the fits progressively disagree with the data ().
Thus we conclude that, independently of the host galaxy magnitude and the value, the Keck observations (Barth et al. Bart03a (2003)) were taken before . Therefore, the -band break time occurred between the last Keck and the first VLT data points, days after the GRB. This result is in disagreement with the earlier determinations inferred by Urata et al. (Urat03 (2003)) and also with the -band break epoch derived by Li et al. (Li03 (2003)).
4.2 The smooth -band light curve
In order to minimize the relative magnitude offset present between our -band data points, we have fixed the photometric zero point with respect to a bright unsaturated star detected at high S/N ratio level (statistical photometric errors ). The zero point has been tied to the star located at , which has (Henden Hend02 (2002)). Thus, our light curve can be easily shifted to other -band zero points. The magnitude errors, displayed in Table 1, include the statistical photometric error of the reference star.
We have analyzed the fluctuations of the -band light curve subtracting from the VLT data points the function fitted in Sect. 4.1 (). The residuals displayed in Fig. 2 panel D show that the VLT points (filled circles) follow an extremely smooth light curve, even considering the small photometric errors of the first night. The typical magnitude deviations of the VLT data points from the fitted function for our three observing nights are mag, mag and mag, respectively.
For completeness we have overplotted in Fig. 2 (see the open squares of panels C, D and E) the -band measurements reported by other authors (Di Paola et al. DiPa02 (2002); Covino et al. 2003a ; Urata et al. Urat03 (2003)). These points are based on different telescopes/detectors so very likely are not free of relative colour term offsets. Moreover, we can not assure that they were obtained using one consistent photometric technique, so in principle they are expected to be more scattered than our homogeneous VLT data set.
Considering all the photometric measurements (VLT + other authors), the maximum residual corresponds to a deviation, associated to the VLT image taken on UT (see Fig. 2 panel E). These results suggest that the smooth light curve measured hours after the burst (see Laursen & Stanek Laur03 (2003)) continued at least until 4.2 days after the GRB event.
4.3 Polarization monitoring
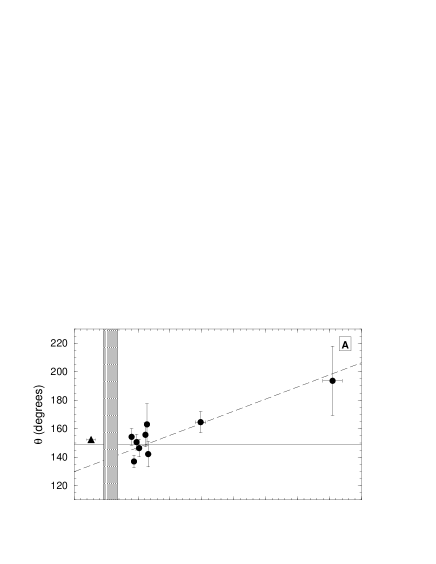
Barth et al. (Bart03a (2003)) reported a potential rapid evolution of between days after the GRB in the Å spectropolarimetric wavelength interval. However, this evolution vanishes in the Å bin, so these authors caution against any overinterpretation on a possible wavelength dependent variation (Barth Bart03b (2003)). The FORS1 -band filter transmission curve is centered at 5540.0 557.5 Å, just in the Å gap present between the two spectropolarimetric bins. Thus, in order to extract a -band filtered polarimetric data point from the spectropolarimetric data, we have averaged the values by Barth et al. (Bart03a (2003)) reported for the two wavelength ranges. The averaged values have been derived using as a weight the area of the -band filter response curve in the two spectropolarimetric bins666Assuming a Gaussian profile, the weights were proportional to and , respectively. Furthermore given the unclear time evolution of , the three epoch data points by Barth et al. (Bart03a (2003)) have been averaged in time. Finally, for consistency we corrected the averaged (, ) values for the slightly different ISM correction applied by Barth et al. (Bart03a (2003)) in comparison to our VLT ISM correction777Barth et al. (Bart03a (2003)) applied an ISM correction given by and , in reasonable agreement with and used in the present work.. We obtain mean values of , for the Keck observations.
The results of our monitoring campaign are displayed in Table 1. Given the insufficient OA S/N ratio in the individual frames taken on 14-15/08/2002 and 16-17/08/2002, the data taken within these two nights have been co-added resulting in two single polarimetric data points. We have reported in panels A and B of Fig. 2 our nine polarimetric measurements (filled circles) along with the mean Keck data point (triangle). The VLT polarimetric points might suggest a slowly increasing trend of with time (). A linear regression to provides a satisfactory fit () consistent with a slope of degree/day. Thus, the zero slope constant line (see horizontal solid line of Fig. 2 panel A) departs at a level from the linear fit (dashed line). However, two arguments point against the suggestive smooth variation.
First, our last inferred value of (Aug. UT) is based on a measurement which is consistent with no polarization (see Fig. 2 panel B). Second, the fitted linear evolution predicts for the Keck mean observing epoch (triangle of Fig. 2 panel A) , underestimating the mean Keck polarization angle () at a level. In contrast, a constant polarization angle scenario would naturally match with the three values reported by Barth et al. (Bart03a (2003)). The polarization degree measured for the nine VLT points is fully consistent with no evolution, since a linear fit to yields a slope of (see dashed line of Fig. 2 panel B). Thus, our VLT data are more difficult to accommodate in contexts where and/or suffer violent rapid fluctuations. However, we cannot exclude that between the epoch of our data points (especially in the gap between Aug. UT and Aug. UT) there might have occurred episodes of rapid variations in and/or .
Thus, within the accuracy, sampling, and coverage of our VLT data, we can claim that there is no rotation of 90 degrees with respect to the polarization angle reported before the light curve break (Barth et al. Bart02 (2002, 2003)) as predicted in the context of several theoretical models (i.e. the nonspreading homogeneous jet, Ghisellini & Lazzati Ghis99 (1999)).
Qualitatively several models might be accommodated in the framework of the Keck plus VLT data set: ) the lack of polarimetric data 0.5 days after the burst does not allow us to exclude a potential peak coincident with the light curve break. Hence, the single peak predicted by Rossi et al. (Ross02 (2002)) might still be consistent with a maximum placed between the last Keck and our first VLT data point. ) If the jet axis was close to the observer line of sight, then also a laterally spreading homogeneous jet might show a single peak placed at the light curve break, that might agree with the joint data (Sari Sari99 (1999)). ) A third model potentially compatible with the whole data set might be the one based on a dominant large-scale ordered magnetic field, which would exist in the ISM where the shock propagates (Granot & Königl Gran03 (2003)). In this case a variable is accompanied by a roughly constant , as seen in GRB 020813.
5 Conclusion
To date, GRB polarimetric light curves have been sparsely sampled, especially after the break. Several OAs have shown small scale rapid optical fluctuations with respect to the canonical power law decay, but very few have been monitored polarimetrically.
The only two afterglows which have shown a clear evolution to date (GRB 021004, Rol et al. Rol03 (2003); GRB 030329, Greiner et al. Grei03 (2003)), are accompanied by structured light curves, showing clear deviations from smooth optical decays (Holland et al. Holl03 (2003); Guziy et al. Guzi04 (2004); Lipkin et al. Lipk03 (2003)). In contrast, the GRB 020813 optical afterglow shows a highly smooth light curve and a constant polarization angle, as it has been reported in the present work. It is suggestive to speculate whether the smoothness of the light curve might be correlated with the stability of . This speculation is only based on the three mentioned cases, so a further statistical verification would require an intensive polarization monitoring for a significant sample of OAs.
We refer to the companion paper by Lazzati et al. (Lazz04 (2004)) for a detailed theoretical discussion and interpretation of the data reported in the present work.
| Date UT | Filter | Seeing | Magnitude | |||
| Aug. 2002 | (s) | (“) | (%) | (degrees) | ||
| 13.99037 - 13.99071 | ||||||
| 13.99358 - 14.03042 | ||||||
| 14.03233 - 14.06918 | ||||||
| 14.07107 - 14.10791 | ||||||
| 14.11190 - 14.14869 | ||||||
| 14.22276 - 14.23876 | ||||||
| 14.24506 - 14.26128 | ||||||
| 14.26340 - 14.27943 | ||||||
| 15.00746 - 15.02343 | ||||||
| 15.02526 - 15.04125 | - | - | ||||
| 15.04323 - 15.05923 | - | - | ||||
| 15.06114 - 15.07715 | - | - | ||||
| 15.07915 - 15.09516 | - | - | ||||
| 15.09722 - 15.11326 | - | - | ||||
| 15.11512 - 15.13116 | - | - | ||||
| 15.14428 - 15.14451 | ||||||
| 15.14650 - 15.16247 | - | - | ||||
| 15.16428 - 15.18026 | - | - | ||||
| 16.98821 - 16.98995 | ||||||
| 17.01049 - 17.01223 | ||||||
| 17.01398 - 17.03003 | ||||||
| 17.03193 - 17.04800 | - | - | ||||
| 17.05027 - 17.06634 | - | - | ||||
| 17.06817 - 17.08429 | - | - | ||||
| 17.08614 - 17.10224 | - | - | ||||
| 17.10488 - 17.12100 | - | - | ||||
| 17.12294 - 17.13906 | - | - | ||||
| 17.14094 - 17.15707 | - | - | ||||
| 17.15920 - 17.17533 | - | - | ||||
| 17.17720 - 17.19334 | - | - | ||||
| 17.19529 - 17.21146 | - | - | ||||
| 17.21335 - 17.22953 | - | - | ||||
| 17.23241 - 17.24859 | - | - | ||||
| 17.25048 - 17.26666 | - | - | ||||
| 17.26900 - 17.28521 | - | - | ||||
| 17.28713 - 17.30334 | - | - | ||||
| 17.30525 - 17.32148 | - | - | ||||
| Not applicable. | ||||||
| Value obtained when co-adding all the polarimetric images taken on Aug. 15.00746-15.18026 UT. | ||||||
| Value obtained when co-adding all the polarimetric images taken on Aug. 17.01398-17.32148 UT. | ||||||
Acknowledgments
We thank Aaron Barth for valuable information on the reduction of the GRB 020813 spectropolarimetric data. The authors acknowledge benefits from collaboration within the Research Training Network “Gamma-Ray Bursts: An Enigma and a Tool”, funded by the EU under contract HPRN-CT-2002-00294. We acknowledge our anonymous referee for his/her useful comments.
References
- (1) Barth, A.J., Cohen, M.H., Goodrich, R.W., et al. 2002, GCN Circ. #1477.
- (2) Barth, A.J., Sari, R., Cohen, M.H., et al. 2003, ApJL 584, L47.
- (3) Barth, A.J., 2003, priv. comm.
- (4) Bersier, D., McLeod, B., Garnavich, P.M., et al. 2003, ApJ 583, L63.
- (5) Beuermann, K., Hessman, F.V., Reinsch, K., et al. 1999, A&A 352, L26.
- (6) Björnsson, G., 2002. Published in the proceedings of the 1st Niels Bohr Summer Institute on Beaming and Jets in Gamma Ray Bursts, Copenhagen, Denmark, 12-30 Aug 2002, eConf C0208122:66-72, 2002 (astro-ph/0302177).
- (7) Bremer, M., & Castro-Tirado, A.J., 2002., GCN Circ. #1487.
- (8) Butler, N.R., Marshall, H.L., Ricker, G.R., et al. 2003, ApJ 597, 1010.
- (9) Castro Cerón, J.M., et al. 2004, A&A in preparation.
- (10) Covino, S., Lazzati, D., Ghisellini, G., et al. 1999, A&A 384, L1.
- (11) Covino, S., Malesani, D., Ghisellini, G., et al. 2002, GCN Circ. #1498.
- (12) Covino, S., Malesani, D., Tavecchio, F., et al. 2003a, A&A 404, L5.
- (13) Covino, S., Ghisellini, G. Lazzati, D. & Malesani, D., 2003b, in Gamma Ray Burst in the Afterglow Era - Third Workshop, Rome 2002, ASP Conference Series in press (astro-ph/0301608).
- (14) Di Paola, A., Arkharov, A., Larionov, V., et al. 2002, GCN Circ. #1505.
- (15) di Serego Alighieri, S., 1997, in Instrumentation for Large Telescopes, VII Canary Islands Winter School of Astrophysics, ed. J.M. Rodríguez Espinosa, A. Herrero & F. Sánchez (Cambridge: Cambridge University Press), 287.
- (16) Fox, D.W., Blake, C., & Price, P.A., 2002, GCN Circ. #1470.
- (17) Frail, D.A. & Berger, E., 2002, GCN Circ. #1490.
- (18) Ghisellini, G. & Lazzati, D., 1999, MNRAS 309, L7.
- (19) Gorosabel, J., Fynbo, J.P.U., Hjorth, J., et al. 2002, GCN Circ. #1651.
- (20) Granot, J., & Königl, A., 2003, ApJL 594, L83.
- (21) Greiner, J., Klose, S., Reinsch, K., et al. 2003, Nature 426, 157.
- (22) Gruzinov, A. & Waxman, E., 1999, ApJ 511, 852.
- (23) Guziy, S., Castro-Tirado, A.J., Gorosabel, J., et al. 2004, A&A in preparation.
- (24) Henden, A.A., 2002, GCN Circ. #1503.
- (25) Holland, S.T., Weidinger, M., Fynbo, J.P.U., et al. 2003, AJ 125, 2291.
- (26) Hurley, K., Cline, T., Mazets, E., et al. 2002, GCN Circ. #1483.
- (27) Israel, G.L., Marconi, G., Covino, S., et al. 1999, A&A 348, L5.
- (28) Lazzati, D., et al. A&A 2004, this volume.
- (29) Laursen, T.L., & Stanek, K.Z., 2003, ApJ 597, L197.
- (30) Li, W., Filippenko, A.V., Chornock, R., & Jha, S., 2003, PASP 115, 844.
- (31) Lipkin, Y.M., Ofek, E.O., Gal-Yam, A., et al. 2003, ApJ in press (astro-ph/0312594).
- (32) Mészáros, P. & Rees, M.J., 1997, MNRAS 476, 232.
- (33) Price, P.A., Bloom, J.S., Goodrich, R.W., et al. 2002, GCN Circ. #1475.
- (34) Rees, M.J. & Mészáros, P., 1992, MNRAS 258, 41.
- (35) Rol, E., Wijers, R.A.M.J., Fynbo, J.P.U., et al. 2003, A&A 405, L23.
- (36) Rossi, E., Lazzati, D., Salmonson, J.D., & Ghisellini, G, 2002. Published in the proceedings of the 1st Niels Bohr Summer Institute on Beaming and Jets in Gamma Ray Bursts, Copenhagen, Denmark, 12-30 Aug, eConf C0208122:88-94, 2002 (astro-ph/0211020).
- (37) Sari, R., 1999, ApJ 524, L43.
- (38) Schlegel, D.J., Finkbeiner, D.P., & Davis, M., 1998, ApJ 500, 525.
- (39) Serkowski, K., Mathewson, D.S., & Ford, V.L., 1975, ApJ 196, 261.
- (40) Stanek, K.Z., Garnavich, P.M., Kaluzny, J., Pych, W., & Thompson, I., 1999, ApJL 522, L39.
- (41) Urata, Y., Nishiura, S., Miyata, T., et al. 2003, ApJL 595, L21.
- (42) Villaseñor, J., Graziani, C., Shirasaki, Y., et al. 2003, GCN Circ. #1471.