The relationship between the X-ray and radio components in the Compact Steep Spectrum Quasar 3C 48
Abstract
We combine results from ROSAT, Chandra, and multifrequency VLBA observations of the Compact Steep Spectrum quasar 3C 48 in an attempt to understand why the radio source is so small and unusual. The X-ray spectrum shows no evidence for the excess absorption which might have allowed us to conclude that 3C 48 is small because it is bottled up by cold neutral gas. We infer that the X-ray spectrum of the nucleus is made up of a soft, variable, steep-spectrum component, and harder, power-law emission of slope consistent with the 1 GHz radio spectrum. The similarity of 3C 48’s X-ray to radio ratio to that seen in core-dominated radio-loud quasars leads us to examine the possibility that the harder X-ray emission is inverse Compton radiation from the radio source, which is more than 99 per cent resolved in our VLBA data. The weak () evidence that we find for a proper motion of in a compact radio component about 0.05 arcsec from the core implies that if this component has a highly relativistic bulk motion, it is at a very small angle to the line of sight. However, stringent requirements on the jet opening angle make it unlikely that all the X-ray emission is from a fast jet which sees boosted Cosmic Microwave Background emission and emits beamed X-rays in the observer’s frame. If the unusual radio structures are intrinsically one-sided and unbeamed, the inverse Compton mechanism can provide an appreciable fraction of the X-ray emission if the magnetic field strength is a factor of six to ten below that which gives equal energy in radiating relativistic particles and magnetic fields and roughly minimizes the total energy in the source. It remains possible that the unresolved X-ray emission arises from close to the central engine, either as an embedded blazar or associated with the accretion processes.
keywords:
quasars: individual: 3C 48— radiation mechanisms: non-thermal — radio continuum: galaxies — X-rays: galaxies1 Introduction
Most radio-loud quasars contain a compact, parsec-scale, flat-spectrum radio core, and lower-surface-brightness extended kiloparsec lobes. The wide range in the ratio of core to total lobe emission is usually attributed to Doppler boosting of the core in those sources that contain a jet aligned close to the observer’s line of sight. But a substantial fraction of radio-loud quasars do not fit into this ‘unified model’. These are the compact steep-spectrum quasars (CSS quasars), which are characterized by a steep power-law radio spectrum, usually with a low-frequency turnover below 1 GHz due to synchrotron self absorption, and sometimes with spectral flattening at high frequencies. The radio structures extend no more than about 15 kpc. About 30 per cent of radio sources found in high-frequency surveys have spectra of this type (Peacock & Wall 1982). A review is found in O’Dea (1998).
The essential difference between CSS quasars and those with flat core spectra has not yet been identified. The CSS sources, as a class, cannot be normal extended double sources seen end-on, because in most cases the overall size is smaller than the lobe-widths of normal double sources, and the low-frequency spectral turnover occurs at higher frequencies. There are also too many CSS sources for them all to be attributed to projection effects (Fanti et al. 1990).
The role of relativistic boosting in the VLBI structures may not be as significant in CSS quasars as in their flat-spectrum counterparts (O’Dea 1998). However, in 3C 147 and 3C 309.1, for example, the X-ray flux densities from Einstein are smaller than the inverse-Compton emission predicted from the radio flux densities, thus providing evidence for bulk relativistic motion (Simon et al. 1983; Kus et al. 1990). Superluminal motion is detected in 3C 216, 3C 309.1, 3C 380 and 3C 138 (Barthel et al. 1988; Kus et al. 1993; Cotton et al. 1997), although it is now thought that 3C 216 and 3C 380 may be large doubles in projection rather than true members of the CSS class (O’Dea 1998). Less controversially, in contrast to flat-spectrum quasars it appears that the jets of CSS quasars have more complex and distorted morphology and have not escaped from the host galaxy. While the underlying cause (whether they are young or are smothered by dense interstellar gas) remains an issue of debate, some level of interaction between the radio jets and the local galactic environment would seem inevitable.
X-ray measurements of CSS quasars are important for the following reasons: (a) in conjunction with radio VLBI observations, they place lower limits on the bulk flow velocity in the emitting regions by the inverse-Compton argument; (b) they may show evidence for higher neutral gas density in these objects than in other quasars; (c) they may be able to show whether an additional emission mechanism (e.g., thermal) is operating, or whether all the radiation is consistent with a nuclear and jet origin; (d) large spectral differences between objects may indicate that they do not form a homogeneous class. Our best composite X-ray knowledge to date comes from objects drawn from the 3CRR sample (Laing, Riley & Longair 1983). Einstein observed several such CSS quasars, but the derived overall knowledge of their soft X-ray spectra is poor compared with other classes of radio-loud quasars (Figure 1). Radio-loud, flat-spectrum core-dominated quasars have spectra consistent with a power law with a typical energy spectral index111Throughout this paper we define spectral index in the sense (Worrall & Wilkes 1990), and there is a tendency for the slope to steepen with decreasing core dominance (Shastri et al. 1993). It is not known whether the large contour for CSS sources in Figure 1 is because of poor statistics or because they show a much larger spread in their X-ray spectral indices.

In this paper we report ROSAT and Chandra X-ray results for 3C 48, one of the strongest and most peculiar CSS quasars. We present previously unreported variability between the two observations with the ROSAT Position Sensitive Proportional Counter (PSPC) and within the observation with the High Resolution Imager (HRI). In comparison with an earlier Einstein Observatory observation we infer the presence of a two-component spectrum which is supported by the new Chandra data. We also present new multifrequency VLBA observations which we use to predict the non-thermal X-ray emission for comparison with the X-ray results.
To ease comparison with earlier work we use a cosmology in which km s-1 Mpc-1, . At 3C 48’s redshift of 0.367, 1 arcsec corresponds to 6.8 kpc in the source frame.
1.1 Properties of 3C 48
3C 48 was the second quasar to be recognized (Matthews & Sandage 1963; Greenstein & Matthews 1963). It is classified as a CSS source on the basis of its steep radio spectrum and its small angular size. The integrated radio spectrum shows a low-frequency peak at about 100 MHz and is reasonably straight (a slight concave curvature) from MHz to GHz with at 1 GHz (Ott et al. 1994). Most of the radio emission occurs on a scale less than about 0.6 arcsec ( kpc), although at low frequencies there is emission on scales up to 3.5 arcsec (Hartas et al. 1983; Woan 1992). VLBI images [Wilkinson et al. 1990, 1991 (1.6 GHz); Simon et al. 1990 (329 MHz); Nan et al. 1991 (608 MHz)] show a compact, inverted-spectrum ‘core’, A, at the southern end of the source, with a ‘hotspot’, B, 50 mas to the north of A, from which a one-sided, broad disrupted jet or plume extends arcsec to the north and northeast. This is unlike most other CSS sources which generally show more-or-less symmetrical double or triple structures. The VLBI images show no sign of a counterjet, but a high dynamic-range VLA image at 8 GHz (Briggs 1995) finds a component on the counterjet side, with an inferred jet-counterjet ratio around 100:1. There have been no VLBI images published at frequencies higher than 1.6 GHz. The flux density appears to be variable by a few per cent over decades at frequencies above a GHz (Ott et al. 1994).
3C 48 has associated optical nebulosity. Broad and narrow [OIII] and [OII] emission-line regions form a chain of compact knots which extends to 6 arcsec north of the core, beyond the radio structures; photoionization by the quasar nucleus is believed to play the dominant role in this gas excitation (Axon et al. 2000). Excess continuum and emission-line nebulosity closer to the quasar core, and in particular at about 1 arcsec northeast of the nucleus, is variously interpreted as the nucleus of a galaxy merging with the host galaxy of 3C 48 (Stockton & Ridgway 1991) or a radio-jet-related star-forming region (Chatzichristou, Vanderriest & Jaffe 1999). 3C 48 has unusually strong infrared emission (Neugebauer, Soifer, & Miley 1985), comparable with the most luminous infrared galaxies, and the detection of CO emission (Scoville et al. 1993) implies the presence of about twice as much molecular gas as in ultraluminous IRAS galaxies. This evidence, together with the irregular appearance of the galaxy in optical continuum (Stockton & Ridgway 1991), supports the idea of a recent merger. Fabian et al. (1987) suggest that the extensive emission-line nebulosity is photoionized gas resulting from a cooling flow of yr-1 rather than a galaxy merger.
3C 48 was detected in X-rays with the Einstein IPC on 1980 Jul 25 (Wilkes & Elvis 1987). The spectrum was consistent with a power-law with and a flux density at 1 keV of Jy (90 per cent errors for 2 interesting parameters; ). (Our reanalysis of the data shows the quoted error in flux density is more appropriate for for 2 interesting parameters; .)
2 Observations and Analysis Methods
2.1 ROSAT
The ROSAT observations, whose dates and exposure times are given in Table 1, were made with the source in the center of the telescope field of view and in normal ‘wobble’ mode during the pointed phase of the mission. 3C 48 was observed twice with the PSPC and once with the HRI. The data were corrected for instrumental effects and the motion of the satellite. Our analysis of the HRI data includes ‘dewobbling’ (Harris et al. 1998) to remove some of the time-dependent aspect uncertainties arising from pixel-to-pixel gain variations in the aspect camera CCD, as well as the use of a broadened PSF (calculated by fitting to data within 10 arcsec of the source centroid) to take account of residual aspect uncertainties. Our analysis used the Post Reduction Off-line Software (PROS X-ray package which runs in the IRAF environment.
| Source | z | Date | Inst. | Net | 1-keV flux | /dof | |||
|---|---|---|---|---|---|---|---|---|---|
| (s) | Counts | cm-2 | density (Jy) | ||||||
| 3C 48 | 0.367 | 1992 Jan 26-27 | ROSAT PSPC | 3,442 | 30.8/26 | ||||
| 1992 Aug 9 | ROSAT PSPC | 2,250 | 35.6/25 | ||||||
| 1994 Aug 11-13 | ROSAT HRI | 37,020 | – | – | – | ||||
| 2002 Mar 6 | Chandra ACIS-S | 9,225 | 81.1/64 |
a. In the annulus of the wings of the PSF used for spectral fitting.
b. Fixed to the radio-derived value of for our Galaxy of cm-2 (Elvis, Lockman & Wilkes 1989).
Errors in the spectral parameters are for 2 interesting parameters (). Flux density is before absorption. In converting the HRI count rate to a flux density, the spectral parameters derived from the PSPC data have been used, and the quoted error on flux density reflects the statistical error on the count rate only. Prieto (1996) fitted the January 1992 spectrum, as part of a study of 3C radio sources, and reports parameter values consistent with ours.
Spectral distributions were extracted for each PSPC observation using an on-source circle of 3 arcmin radius and local background from an annulus of radii 3 and 5.7 arcmin. The large on-source region relative to most of the source counts was chosen so as to avoid losing soft photons because of the ‘Ghost Image’ effect of the PSPC (Briel et al. 1994). Radial profiles were fitted to models convolved with the Point Spread Function (PSF) using home-grown software whose algorithms are described in Birkinshaw (1994). This software takes into account any contribution of the model in the background region. A fit was first made to a one-component point-source model. We then examined the reduction in when adding in a model of surface brightness , used to represent the presence of X-ray emitting gas in hydrostatic equilibrium.
The presence of an extended X-ray atmosphere in the HRI observation of 3C 48 has been reported previously (Crawford et al. 1999; Hardcastle & Worrall 1999). This is re-examined in the context of the new Chandra observations in §6. Our analysis of the ROSAT data and the comparison with earlier Einstein data was completed before the Chandra data became available in the public archive, and so was not guided by information from the higher-quality data set.
2.2 Chandra
3C 48 was observed with the back-illuminated CCD chip, S3, of the Advanced CCD Imaging Spectrometer (ACIS) on board Chandra on 2002 March 6. The observation was part of a study of a small sample of CSS and Giga-Hertz Peaked Spectrum sources by Siemiginowska et al. (2003a). Details of the instrument and its modes of operation can be found in the Chandra Proposers’ Observatory Guide, available from http://cxc.harvard.edu/proposer. The observation was made in the VFAINT data mode, with a 128-row subarray (giving a 1 by 8 arcmin field of view) to reduce the CCD readout time to 0.44 s and mitigate the effects of pileup on the spectrum of the quasar core. We have analyzed the archival data set using CIAO v2.3 and the CALDB v2.21 calibration database, and following software ‘threads’ available from Chandra X-ray Center (http://cxc.harvard.edu/ciao). Events with grades 0,2,3,4,6 are used. All X-ray spectra are binned to a minimum of 30 counts per bin, and the time-dependent decline in quantum efficiency is taken into account using the recommended methods. There were no intervals of flaring background, and the calibrated data have an observation duration of 9.225 ks.
The counts extracted from the circle of radius 2.5 arcsec centred on the nucleus give 0.35 counts/readout time, for which a pileup fraction of about 8 per cent is estimated by the PIMMS software. A similar fraction of piled-up events is deduced by examining the events with significant signal in the outer pixels of the 5 by 5 event islands read out in VFAINT data mode. The effect of pileup is to combine the energy of multiple soft X-rays in the core of the PSF into a single harder X-ray and thus flatten the spectrum. We therefore used two approaches to extract and model the X-ray spectrum. The first approach follows Gambill et al. (2003) in extracting the counts from an annular region of inner radius 0.5 arcsec and outer radius 2.5 arcsec, to exclude the piled up core. The resulting fluxes were then corrected for missing flux using a spectrally weighted PSF extracted using the ChaRT and MARX software (to model the mirror and instrument responses) and smoothed by a small fraction of an arcsec to give a good match to the radial profile of the data within 1 arcsec of the nucleus (thus taking into account residual effects of aspect uncertainties and pixelization). The second approach was to fit data extracted from a 2.5 arcsec radius circle either ignoring the effects of pileup or attempting to correct for it using the method of Davis (2001) as implemented in Sherpa. We found the pileup model overestimated the amount of pileup and steepened and increased the intensity of the spectrum so much as to be inconsistent with results from the annular extraction. We attribute this to the implementation of the pileup model running into difficulties for a spectrum with as much concave curvature as that we measure (see §3.2). The spectral indices from our fits without the pileup model to the data from the 2.5 arcsec radius circle were consistent with those found from the annulus and had smaller statistical uncertainties. However, because of systematic errors introduced by pileup, the model results and uncertainties reported in §3.2 are derived from fitting to the data from the annular extraction region, as obtained using Sherpa. Background for the nuclear spectrum was measured from a source-centred annulus of radii 6 and 20 arcsec. Our spectral model fitting was over energies between 0.3 and 7 keV. We used the PSF to search for extended emission using the method described in §2.1.
2.3 VLBA
We observed 3C 48 with the VLBA (including a single VLA antenna) at 1.5, 5.0, 8.4 and 15.4 GHz on 1996 Jan 20. The multi-frequency approach was chosen to allow us to constrain the spectra of the compact radio components. The 12 hours of observing time was evenly divided among the four frequencies.
The data were reduced in the standard manner using the AIPS software package. Pulse calibration data and observations of 3C 345 were used to perform a first calibration of the phases. We then used a point model to perform global fringe-fitting on the data, generated best maps from this process and then, because of the complex structure of the source, fringe-fitted again, using a model based on the first-generation maps, to produce the data used in the final analysis. This process was successful for all the data except for that from the 15-GHz observations, where a point model for the first iteration of fringe fitting produced unacceptably poor results. In this case we used a model based on the 8.4-GHz data for the first iteration of fringe fitting.
The final datasets were averaged to an integration time of 30 s and mapped using the AIPS task IMAGR with natural weighting of the visibilities. The different observing frequencies (four in the case of the 1.5-GHz data, two for the others) were averaged in order to make the maps, with the flux scales being corrected on the assumption of a spectral index of 0.7. The resulting maps were used in a number of iterations of antenna-based phase self-calibration until phase artifacts were largely eliminated. Amplitude self-calibration was not applied, since this might have rendered the flux scale of the maps unreliable.
3 X-ray spectrum
3.1 ROSAT
The spectrum from each PSPC observation gives an acceptable fit to a single-component power law with free , , and normalization (Table 1). The absorption is slightly low as compared with the radio-inferred value for the line of sight through our Galaxy (Elvis et al. 1989), although it is consistent within uncertainties. The spectrum is steep, and there is no evidence of excess absorption as might be expected were the X-ray emission seen through the hypothetical dense cold gas that helps to keep the radio source small. A single-temperature Raymond-Smith thermal model fits the data poorly: e.g., the best such thermal fit to the stronger detection gives = 56 for 26 degrees of freedom. The addition of a thermal component does not improve the single-component power-law fits.
Although the spectral shape remained remarkably constant between the observations, the normalization did not, and the flux of the first observation is times that of the second (Table 1 and Figure 2). The ROSAT data give a significantly steeper power-law spectrum than the earlier Einstein measurement. The X-ray emission could arise from a power law which varies both in spectral shape and normalization over time, but, since the spectral index remained constant between the two ROSAT observations, we investigate the possibility that the Einstein and ROSAT bands are primarily sampling separate components of emission. As Einstein is sensitive to higher energies than ROSAT (although the bands overlap considerably), we model the spectrum with a function which flattens to higher energies. Such a concave curvature might explain why the ROSAT data slightly prefer an absorption less than the column density through our Galaxy. We fitted each of the three observations (one Einstein and two ROSAT) to a two-component power-law model to investigate whether or not it is possible to find two power-law slopes which, with normalizations as the only free parameters, fit each observation at least as well as the single power law. For this exercise we fixed the absorption to the Galactic value. We stepped through values for one power-law index, fitting the other index and the normalizations, to find a case where the second power-law index was similar for all three observations. We then fixed both power laws and computed and the two normalizations for a fit to each data set. Table 2 gives example fits for two components. Due to the poorly constrained nature of the fitting we do not claim to have found the best two slopes. However, this does show that it is possible that ROSAT and Einstein are both sampling a power law of slope similar to that of the radio spectrum, plus a steeper soft excess, with the normalization of the soft component (and possibly the hard component) varying over time.

| Observation | /dof | ||||
| Jy | Jy | ||||
| Einstein 1980 | 1.1 | 0.62 | – | – | 10.0/7 |
| 1.0 | 0.56 | 2.2 | 0.04 | 9.5/7 | |
| 0.9 | 0.52 | 2.2 | 0.07 | 9.2/7 | |
| 0.8 | 0.47 | 2.1 | 0.11 | 9.0/7 | |
| PSPC 1992 Jan | 1.8 | 0.78 | – | – | 34.3/27 |
| 1.0 | 0.41 | 2.2 | 0.36 | 31.3/27 | |
| 0.9 | 0.39 | 2.2 | 0.38 | 31.3/27 | |
| 0.8 | 0.32 | 2.1 | 0.45 | 31.5/27 | |
| PSPC 1992 Aug | 1.7 | 0.54 | – | – | 36.7/26 |
| 1.0 | 0.30 | 2.2 | 0.23 | 36.0/26 | |
| 0.9 | 0.28 | 2.2 | 0.24 | 36.1/26 | |
| 0.8 | 0.23 | 2.1 | 0.29 | 36.1/26 | |
| Chandra 2002 | 41.9/62 |
Only the Chandra fit is truly for minimum : for Einstein and ROSAT example fits are shown. and are the 1 keV flux densities. is fixed at the Galactic value of cm-2 throughout this table. The power laws cross at an energy of , which is 1.1 keV for the best-fit Chandra parameters, and roughly 0.2 keV and 1 keV for Einstein and ROSAT, respectively.
3.2 Chandra
A fit to a single-component power law finds an absorption that, at more than 99 per cent confidence, is inconsistently small compared with the Galactic value. This is the usual indication of a soft excess. When the absorption is fixed at the radio-derived value for our Galaxy we obtain a spectral index of (Table 2) and an upper limit to any intrinsic absorption, in excess of that in our own Galaxy of cm-2. The fit is only marginally acceptable, at for 64 degrees of freedom, and shows correlated features in the residuals which suggest that the model is wrong. The spectral index is slightly larger than the value of tabulated by Siemiginowska et al. (2003b) for the same observation (no goodness-of-fit or energy-band information provided), but the fits are consistent in requiring no intrinsic absorption.
The addition of a second power law gives for 62 degrees of freedom, a highly significant improvement on an F test. The spectrum, shown in Figure 3, has best-fit power law spectral indices of , , with uncertainty contours shown in Figure 4. The 1 keV flux densities are and Jy for the hard and soft components, respectively, where uncertainties are 1 for 2 interesting parameters. There is no evidence for line emission from Fe K fluorescence at an observed energy of 4.75 keV in this or in the spectrum with more counts (but mildly piled up) from the 2.5 arcsec radius extraction region.


4 X-ray variability
In §3.1 we reported X-ray flux variability between the January and August PSPC observations (Table 1 and Figure 2). The flux had increased again by the time of the HRI observation. There is also evidence for variability on a shorter time scale. Whilst the August observation was continuous, the January measurement was made in five intervals. Table 3 lists the start times and durations of the intervals, together with the 0.2–1.9 keV net counts and count rates within a circle of radius 2 arcmin centred on 3C 48. Smaller and larger on-source regions give similar results. We find a drop in count-rate over just 3 hours on January 27 that is comparable to the average amount of decrease between January and August. Similarly, the HRI data show variability at the per cent level on time-scales of a few hours. The flux in the Chandra data is at a similar level to that in the first PSPC exposure. There is no obvious variability during the Chandra observation either below or above 1 keV, where the soft and hard components, respectively, dominate the emission. However, the observation only lasted for 2.6 hours.
| Start Time (UTC) | Exposure | Net Counts | Net Count rate |
|---|---|---|---|
| (s) | (s-1) | ||
| 1992 Jan 26 02:02:45 | 678 | ||
| 1992 Jan 26 03:41:01 | 527 | ||
| 1992 Jan 26 08:24:46 | 748 | ||
| 1992 Jan 27 06:46:45 | 694 | ||
| 1992 Jan 27 09:56:37 | 795 | ||
| 1992 Aug 9 20:03:47 | 2250 |
Our results for January 27 correspond to (0.2–2 keV) W in ksec. is above average but not wildly inconsistent with what has been seen in other quasars and Seyfert galaxies (Barr & Mushotzky 1986). We could interpret the soft excess as the high-energy tail of unbeamed emission from an accretion disc. In this case, the implied source size from the luminosity-doubling time scale is pc ( mas) which, for Eddington-limited spherical accretion and an emission region of size about three times the Schwarzschild radius, implies the presence of a black hole of about M⊙. In this paper we neither exclude nor explore further the possibility that all the X-ray emission is associated with the accretion processes. Rather we explore possible relations between the radio and hard X-ray components of the source. We also discuss briefly in §7.2 the possibility that the X-ray emission is from an embedded blazar.
5 VLBA results
Final maps at the full resolution available from the data are presented in Figure 5. Parameters of the maps are listed in Table 4.

| Freq. | Beam | Off-source | Dyn- | Approx. | ||
| (GHz) | Major | Minor | Pos- | noise (Jy | amic | las |
| axis | axis | ition | beam-1) | range | (arcsec) | |
| (mas) | (mas) | angle | ||||
| 1.5 | 10.0 | 7.47 | -1.68 | 940 | 250 | 1.3 |
| 5.0 | 3.27 | 2.28 | -1.69 | 160 | 670 | 0.7 |
| 8.4 | 2.13 | 1.45 | 8.60 | 122 | 520 | 0.4 |
| 15.4 | 1.14 | 1.00 | 16.07 | 174 | 70 | 0.04 |
The approximate largest angular scale (las) describes the largest scale to which the observations are sensitive, based on the shortest baseline present in the images.
The 1.5-GHz map reproduces well the source structure seen in the 1.6-GHz image of Wilkinson et al. (1990). Extending the notation used in that paper, we will denote the component to the north of ‘B’ ‘B2’ and the ‘warm spot’ close to the northern edge of the L-band maps ‘D’. These components are labelled on each map in Figure 5. In a rectangle covering all of the emission in the high-resolution map of Wilkinson et al. (1991), their map222Obtained from the radio-source atlas of Leahy, Bridle & Strom (http://www.jb.man.ac.uk/atlas/) contains 9.7 Jy and ours 10.5 Jy. The small difference between these flux densities is in the sense and of the magnitude expected given the steep-spectrum nature of 3C 48.
At higher frequencies much of the structure seen in the 1.5-GHz map is still visible, although the extended structure is not detectable. Component C is largely resolved out. B remains compact, but structure in components B2 and D is clearly present; B2 is resolved into an elongated structure surrounded by fainter emission while D is resolved into two components aligned roughly E-W. At 15 GHz the ‘core’ component A appears to be resolved into two components, possibly a true core and a jet component, separated by mas (20 pc); the 8-GHz core can also be modelled as two Gaussians, but otherwise there is no high-frequency evidence for the jet connecting A and B suggested by the maps of Wilkinson et al., though component A is elongated northwards in all maps.
The flux densities and deconvolved sizes of the named components are tabulated in Table 5. These were obtained with the task JMFIT, fitting a Gaussian together with zero level and slope. To reduce the effects of the different plane sampling, the longest baselines in the 5, 8.4 and 15-GHz measurements were matched and a tapered weighting scheme was used to give similar dirty beams. The same restoring beam (3.5 mas) was used for all three frequencies so that in principle the resulting maps should be sensitive to the same compact structures. Matching baselines to the 1.5-GHz data was not feasible; the map of Figure 5 was used and we have tabulated, in parentheses, the flux densities measured when the low and high observing frequencies are mapped separately. Errors quoted are those returned by JMFIT.
| Comp- | Freq. | Flux | Major | Minor | Position |
|---|---|---|---|---|---|
| onent | (GHz) | density | axis | axis | angle |
| (mJy) | (mas) | (mas) | (degrees) | ||
| A | 1.53 | 6.9 | 2.5 | 179 | |
| (1.45 | 6.1 | 3.5 | 9) | ||
| (1.61 | 9.0 | 2.4 | 4) | ||
| 4.99 | 2.2 | 0.4 | 171 | ||
| 8.42 | 2.3 | 0.3 | 174 | ||
| 15.4 | 2.4 | 0.2 | 9 | ||
| B | 1.53 | 5.0 | 2.8 | 148 | |
| (1.45 | 4.3 | 2.6 | 163) | ||
| (1.61 | 5.5 | 2.5 | 136) | ||
| 4.99 | 2.0 | 1.7 | 21 | ||
| 8.41 | 1.8 | 1.1 | 21 | ||
| 15.4 | 1.9 | 0.5 | 23 | ||
| B2 | 1.53 | 14.8 | 8.4 | 19 | |
| (1.45 | 14.3 | 8.2 | 20) | ||
| (1.61 | 15.8 | 9.2 | 21) | ||
| 4.99 | 7.3 | 4.1 | 43 | ||
| 8.41 | 6.3 | 4.3 | 49 | ||
| 15.4 | 5.0 | 0.7 | 35 |
Components B and B2 have spectra consistent with a moderately flat power law () at frequencies between 5 and 8.4 GHz, cutting off at 15 GHz. For B the power law extrapolates to 1.5 GHz. For B2 the 1.5-GHz flux density lies above the extrapolation, but this is not unexpected as the component also appears distinctly larger at this frequency. The spectra are consistent with a model in which B and B2 are physically similar to the hotspots (regions where particles are accelerated at shocks) of powerful, FRII, radio sources.
For component A, is roughly 0.6 at 1.5 GHz and between 1.5 and 5 GHz. Its faintness at 330 MHz (Simon et al. 1990) suggest that the flux density peaks at a frequency between 330 MHz and 1.5 GHz. The spectrum is very flat between 5 and 8 GHz and falls off rapidly by 15 GHz. A two-component model — perhaps consisting of a self-absorbed core and a steep-spectrum jet — may be necessary to explain this behaviour. The core is a sufficiently small contributor to the overall radio flux of the source that it would need to be undergoing large fractional variability (of order 100 per cent or more over time scales of decades) were it to account for the likely long-term variability in total flux discussed by Ott et al. (1994).
A comparison of the flux densities in individual components between the Wilkinson et al. (1991) map and ours is uncertain because the maximum-entropy algorithm VTESS was used in making the former. Using fixed extraction regions, the components labelled in Figure 5 all contain a higher flux in the Wilkinson et al. map (ranging from 16 per cent for component A to 53 per cent for B). However, due to the different mapping procedures, we are unable to conclude with any certainty the extent to which the reported variability in integrated flux (Ott et al. 1994) is located in specific source components.
We used JMFIT to search for evidence for proper motion of components B or B2 with respect to A at 1.5 GHz between the epoch of Wilkinson et al.’s observations (1984.3) and ours (1996.1). The usefulness of this measurement is limited by the accuracy with which we can align the weak components A. The only significant motion is that of component B, which appears to have moved northwards by mas, a result. Taken at face value, this corresponds to an apparent motion of 2 pc in 11.8 years, so that we have a sub-luminal .
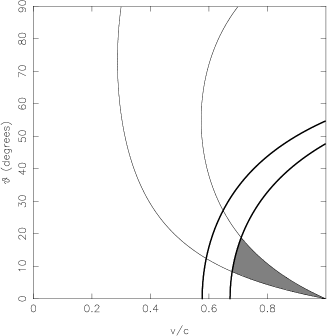
If we assume that the source is intrinsically two sided and symmetric out to a projected radius of 0.05 arcsec, we can constrain models in which the sidedness of the jet is related to relativistic beaming. Based on the off-source noise in the 5-GHz data, we can set a upper limit of mJy for the flux of a component corresponding to component B in the hypothetical undetected counterjet, so that the jet-counterjet flux ratio here is . This may be compared to the large-scale jet-counterjet ratio of determined from the VLA imaging of Briggs (1995). For an intrinsically symmetrical pair of emitting regions, the jet-counterjet ratio is given by
(the exponent 3 being appropriate for a single emitting region rather than a jet), while the apparent motion on the sky of the jet component is given by
These results restrict the possible values of and as shown in Figure 6. Only small angles to the line of sight and relativistic velocities for component B () are allowed if the radio structure of 3C 48 is intrinsically symmetrical and component B moves with the bulk jet velocity.
6 The X-ray-emitting atmosphere
An excess of counts (compared with the PSF) in the HRI radial profile of 3C 48 on scales of 10–30 arcsec (70–200 kpc) has been reported previously (Crawford et al. 1999; Hardcastle & Worrall 1999). Based on the improvement in when models of fixed parameters were added to a point-source model, it was inferred that 3C 48 lies in a luminous cluster of galaxies. When we adopted the method applied by Worrall & Birkinshaw (2001) to 3C 346, in order to determine the uncertainty in the derived parameters, we found allowed values of , (1 errors), with the unresolved core contributing of the total counts within a source-centred circle of radius of 2.5 arcmin.
There is a recent concern about the accuracy of the X-ray luminosities of clusters around 3CR quasars measured with the HRI (Crawford et al. 1999; Hardcastle & Worrall 1999). Crawford & Fabian (2003) report Chandra observations for three 3CR quasars with earlier HRI cluster detections, and in two of them the Chandra-measured luminosities are significantly lower than the HRI-measured values (by a factor of 20 to 50). Crawford & Fabian attribute this discrepancy to insufficient or erroneous wobble corrections affecting the HRI results. That this may be an issue for 3C 48 is suggested by the relatively low (but uncertain) quasar-galaxy spatial covariance found by Yee & Green (1987).
Indeed we find that Chandra does not support the existence of a cluster as luminous as found in the HRI data. Using only the best-fit HRI-derived values of and , the fit of the Chandra radial profile to a two-component model gives =8.9 for 21 degrees of freedom, as compared with =10.3 for 22 degrees of freedom for a point-like component alone, such that the probability of the improvement being by chance is 8.5 per cent on an F test. No other choice of and gives a detection that can be claimed with greater confidence, where searching through these parameters further decreases the number of degrees of freedom by two. So, the detection of any extended emission is marginal.
If we assume that the Chandra detection of extended emission is real, the component contains only counts and is a factor of 40 weaker than predicted by the HRI. If we further assume that the emission is from a hot gaseous environment of the quasar, the bolometric X-ray luminosity is W, assuming a temperature of keV so that it lies on the cluster temperature-luminosity correlation (Arnaud & Evrard 1999). We convert the X-ray parameters to estimates of physical conditions using the approach of Birkinshaw & Worrall (1993). The mass deposition rate from cooling would fall far short of that predicted by Fabian et al. (1987)’s explanation for the emission-line nebulosity. The gas pressure at a radius of 6 arcsec ( kpc) is Pa, which is insufficient to confine the extended emission-line regions if their pressures are Pa, as estimated by Fabian et al. (1987) on the basis of a photoionization model.
At a radius of about 0.5 arcsec, within which most of the radio structure is contained, the cluster pressure would be about Pa. The plume of 1.5-GHz radio emission stretching north from component B for about 0.3 arcsec, and contained within continuous contours in Figure 5, has a flux density of 8.7 Jy (roughly half of the total emission from 3C 48 at this frequency). Using an electron spectrum of the shape and energy limits described in §7 and Table 6, the minimum pressure in radiating particles and magnetic field (for no proton contribution) is found to be roughly Pa if the source is unbeamed. Thus despite the diffuse appearance, which does not suggest a strongly overpressured, rapidly expanding source, the external X-ray-emitting gas falls well short of providing pressure balance. The minimum internal pressure decreases if beaming is important. For models consistent with Figure 6, the minimum conditions for pressure balance are only met if the plume velocity is greater than c and it is at angle to the line of sight of less than 0.4 degrees. X-ray constraints from ROSAT observations of two GPS galaxies have already found pressures one to two orders of magnitude too low to confine their radio sources assuming there is no beaming (O’Dea et al. 1996), and in a sample of FRIIs, Hardcastle & Worrall (2000) find similar results for the lobes of the five sources of maximum linear size kpc
7 Radio-related X-ray emission
The radio, X-ray, and optical luminosities of samples of quasars have been investigated using a variety of different approaches, leading most authors to conclude that emission associated with the compact radio source dominates the X-radiation in core-dominated radio sources, while a ubiquitous unbeamed component takes over as the dominant source of X-ray emission in lobe-dominated sources (e.g., Zamorani 1984; Browne & Murphy, 1987; Worrall et al. 1987; Kembhavi 1993). This can explain why core-dominated radio-loud quasars exhibit an approximately linear correlation between their 1-keV X-ray and 5-GHz radio flux densities, while lobe-dominated quasars tend to lie above the line (Fig. 7).

3C 48 is interesting in this context. Using the hard non-variable component of X-ray emission and the total radio emission (which is all compact on the scale of the other quasars) it lies close to the line defined by other core-dominated quasars (Fig. 7). If the proximity of 3C 48 to the correlation is not coincidental, then we expect a substantial fraction of the hard X-ray emission to be produced by the radio-emitting components. In the remainder of this paper we test this possibility by estimating the X-ray emission from non-thermal processes in the radio components that we resolve. We also explore briefly in §7.2 the possibility that the X-ray emission arises from an embedded blazar that contributes negligibly to the observed radio emission.
Radio components can give rise to X-ray emission by two main mechanisms; synchrotron and inverse-Compton (IC) emission. There is clear evidence for the importance of both of these processes in extended components of radio sources studied with Chandra. In particular, the jets of low-luminosity, FRI, radio galaxies (which in many respects resemble the 3C 48 jet) are often synchrotron emitters in the X-ray (e.g., Worrall, Birkinshaw & Hardcastle 2001; Hardcastle, Birkinshaw & Worrall 2001) while X-ray emission likely to be due to the inverse-Compton process has been detected from the jets, hotspots and lobes of a number of powerful FRII sources (e.g., Sambruna et al. 2002; Hardcastle et al. 2002).
If the X-ray emission is of an IC origin, the spectral index should match that of the optically-thin radio emission, which is true for the hard X-ray component (Fig. 4) in both the plume, where (Ott et al. 1994), and the knots (Table 5). The variable soft X-ray component would require a separate explanation, such as the high-energy tail of the emission from an accretion disc (§4).
Estimates of the IC emission necessarily rely on assumptions about the geometry of the radio components, their bulk speed, and the magnetic field strength in the radio-emitting plasma. With a sufficiently low magnetic field strength, any radio-emitting component can give the required IC X-ray flux. However, there is now evidence that the extended components of radio sources have magnetic field strengths consistent with, or a factor of a few lower than, the values for energy equipartition between the radiating electrons and the magnetic field (e.g., Brunetti et al. 1999; Hardcastle et al. 2002). A magnetic field which is a factor of a few below the equipartition value can increase by an order of magnitude the predicted X-ray emissivity.
For IC calculations we must also make some assumptions about the electron spectrum. We model this as a single power law, between an upper and lower cutoff energy, parametrized in terms of the lower and upper limits on the Lorentz factors, and . We take to be , reproducing observed in the total radio emission. The normalization and values of and are selected based on available constraints from the broad-band synchrotron spectrum in the region of interest. We use the anisotropic IC code described by Hardcastle et al. (2002) for our calculations. This deals accurately with the effects of beaming and aberration on the illuminating photon population and the IC emission itself. The three parent photon populations we will consider are (i) the synchrotron photons themselves (SSC), (ii) the cosmic microwave background radiation (CMB/IC), and (iii) radiation from the active nucleus (NIC).
The NIC model requires some additional assumptions. For no beaming and an equipartition magnetic field, the electron population responsible for the observed radio emission produces X-ray IC most successfully through upscattering far infra-red photons. We use the ISO results of Meisenheimer et al. (2001), and model the spectrum as having a flux density of 829 mJy at Hz (observed frame), above which frequency . The results are insensitive to the upper-frequency cut-off but are sensitive to the photon spectrum below Hz. The Meisenheimer et al. data show that the spectrum flattens, and are consistent with between and down to a frequency of Hz. Photons of lower frequency still, in the range between Hz and Hz, could in principle boost the IC emission from this process considerably, but there is no justification for the introduction of a new soft population of photons in this unobserved wavelength band. We cut off the spectrum at Hz but adopt below Hz. The photons are allowed to illuminate the radio-emitting regions as though they originated at a point source at the quasar nucleus. Because some of the IR emission in 3C 48 may originate in a circumnuclear starburst, this model is not necessarily accurate. However, as long as the starburst emission does not come from a region much larger than the radio source, it is not seriously in error.
We consider separately the resolved radio emission and the radio core as possible sites of radio-related X-ray emission. The former may explain the position of 3C 48 in Figure 7.
7.1 Jet-related X-rays
The main difficulty with a synchrotron model in which both radio and X-ray emission are from a population of electrons with a single-component spectrum (power law or broken power law) is the upper limit on jet surface brightness of 22.2 mag arcsec-2 in the HST F814W filter found by Kirhakos et al. (1999). This implies an upper limit of order 1 Jy to the integrated jet emission at a frequency of Hz. Since this upper limit is comparable to the measured X-ray flux density at 1 keV, synchrotron emission could only make a significant contribution to the unresolved X-rays through a highly non-standard electron population which produces copious emission at frequencies only above the optical. The detection of optical jet emission is severely hampered by the bright nucleus and galaxy nebulosity, but in view of the Kirhakos et al. constraint we consider the possibility of significant X-ray synchrotron emission from the radio jet no further.
The brightest small-scale components in the jet are B and B2. However, these components contain less than 10 per cent of the radio flux of the overall jet, and, assuming source regions of about 2 mas in extent, none of the photon populations gives more IC X-ray emission than we find from the overall radio plume.
We model the plume described in §6 crudely as a truncated cone, with a linear gradient in electron density along the cone axis to represent the brightness gradient along the plume seen in the 1.5-GHz maps. The total 1.5-GHz flux density of 8.7 Jy for this volume provides the normalization for the electron spectrum. A single constant magnetic field strength is assumed throughout the source for numerical efficiency. We assume that the spectral shape of the plume matches that of the integrated radio emission and by default use the MHz turnover frequency (plausibly due to synchrotron self-absorption or free-free absorption; Wilkinson et al. 1990) to provide a limit on the low-energy cutoff of the electrons. The spectrum also steepens before mm-wave radiation is emitted (Steppe et al. 1995), which gives an indication of a possible high-energy cutoff. The corresponding values of and (Table 6) depend on the degree to which the extended emission is beamed and on the derived equipartition magnetic field strength.
7.1.1 Unbeamed plume model
If the plume is unbeamed and lies in the plane of the sky, the one-sidedness of the jet is a genuine intrinsic feature of the source, perhaps caused by differences in the beam’s interaction with the external medium, as suggested by Wilkinson et al. (1990). The predicted SSC, CMB/IC and NIC X-ray flux densities, assuming equipartition, are given in Table 6. The combined output is a factor of below the observed flux density of nJy (Table 2) in the hard X-ray component. We would require the magnetic field to be a factor of about 10 below the equipartition value if the mechanisms are to make an important contribution. A reduction to only a factor of six below equipartition is sufficient if is reduced to 5, allowing for the presence of electrons at energies below that for which the synchrotron emission is self-absorbed or suffers free-free absorption. The favoured interpretation of the resolved X-ray jet emission from the quasar jet PKS 0637-752 supports the presence of electrons with (Tavecchio et al. 2000).
| Model | IC flux density at 1 keV (nJy) | |||||
| SSC | CMB/IC | NIC | Total | |||
| Unbeamed | 180 | 7100 | 3.3 | 0.003 | 3.5 | 7 |
| Beamed | 200 | 8000 | 0.04 | 0.9 | 0.0002 | 1 |
The NIC contribution would be increased if the IR radiation were increased through beaming. To contribute the observed X-rays, assuming equipartition, a component of beamed IR emission would need both to be about a factor of 100 brighter than the measured IR (as seen by the jet) and have a rather large opening angle (Figure 5) to cover the whole jet. Although such extra IR emission cannot be ruled out, there are no observations of which we are aware which support the presence of dominant beamed IR emission. On the contrary, Meissenheimer et al.(̃2001) argue that radio galaxies and quasars have similar IR luminosities, implying that the emission seen is emitted isotropically. To get a maximum gain from scattering geometry, the nuclear beamed emission should be directed away from the line of sight. It then seems most likely that equal and opposite beamed emission should dominate the IR which is observed, and this is insufficient to produce the observed X-rays. We thus consider it unlikely that beamed IR radiation is the dominant photon source for producing the X-rays.
7.1.2 Beamed plume model
In Figure 6 we presented the range of beaming parameters that are consistent with the observed sidedness and the possible detection of sub-luminal motion. As a representative example we take and degrees, giving a bulk relativistic Doppler factor of . We take the projection of the velocity vector on the sky to point along the direction of apparent motion of component B, i.e. approximately N on the radio map. In this model, the boosted CMB radiation is the dominant photon population in the source frame (Table 6). Inverse-square law and Doppler effects greatly reduce the effects of the nuclear illumination. The resulting total predicted X-ray emission is two orders of magnitude below the observed value. The magnetic field would have to be considerably below the equipartition value to achieve results approaching the observed X-ray flux, and we conclude that in this beamed model the plume is highly unlikely to contribute to any significant extent to the observed X-rays.
We can ask how large the beaming would need to be to increase the CMB/IC prediction to the observed level. The result is that we would require all the electrons in the plume to have , degrees, . Unless the source has an unusually small intrinsic opening angle which is maintained for hundreds of kpc close to the line of sight, only a fraction of the electrons will participate in such boosting, and these parameters represent a lower limit to the required beaming. We thus conclude that it is unlikely that all the observed hard X-ray emission is from this mechanism.
7.2 Core-related X-rays
A possible site for radio-related X-ray emission (although not one which alone would explain the position of 3C 48 in Figure 7) is emission from within component A. Here the NIC can be high if the radio component is unbeamed. For example, modelling the photon and electron spectra as above, and providing the photon illumination from a point source embedded in the base of a cylindrical jet of radius 0.25 mas (from Gaussian fits to two components) and length 4 mas (from measurement), we predict X-ray emission of 20 nJy at 1 keV, somewhat above that from the extended plume. Our modelling of the far-infrared radiation source as point-like to component A is probably consistent with Meisenheimer et al. (2001)’s interpretation as originating from the type of dusty torus required by models unifying radio galaxies and quasars. However, if the source of this radiation is larger than component A, or if it is point-like and the quasar nucleus is south of component A, the predicted X-ray flux will be lower. Taking the adopted geometry at face value, it is possible to make the hard X-ray component with a magnetic field strength only a factor of two to three below equipartition. This is in line with the level of field deduced from X-ray inverse Compton measurements in components of powerful radio galaxies and quasars on larger scales (e.g., Brunetti et al. 1999; Hardcastle et al. 2002). Our modelling finds a declining X-ray to radio ratio with distance from the nucleus when knot A and the plume are compared under similar equipartition assumptions.
While the fast variability seen at soft X-ray energies with ROSAT may suggest unbeamed emission from the high-energy spectral tail of an accretion disc, we can consider the alternative possibility that we are seeing a somewhat larger beamed component embedded in the core. Simple models of a spherical moving blob have proved relatively successful in describing the multiwavelength spectra of blazars up to gamma-ray (and in some cases TeV) energies via SSC or inverse Compton scattering of external photons (e.g., Ghisellini et al. 1998). The energy at which the Compton-scattered emission becomes dominant as a hard component is normally in the X-ray band, and so may explain the concave spectrum that we observe. In Figure 8 we plot the spectrum of the core, together with an example SSC model. We have chosen beaming parameters consistent with the constraints at larger radii (assuming a symmetrical jet) of Figure 6, and a source size which is consistent with the observed soft X-ray variability. The model parameters are selected to describe roughly the level of X-ray emission while not overproducing emission at lower energies. The radio emission, much of the far-IR emission, and the blue bump are not described by the model, and the position of 3C 48 in Figure 7 is not explained. Measurements of gamma rays from 3C 48 could help establish the credibility of an embedded blazar explanation for the X-ray emission.

8 Conclusions
The X-ray spectrum of 3C 48 is the composite of a soft, steep-spectrum component and harder, power-law emission of slope consistent with the 1 GHz radio spectrum. The variability measured with ROSAT suggests that at least part of the X-ray emission (principally the softest) arises from a region of accretion-disc size or from a beamed blazar component.
The Chandra data give only a marginal detection of extended emission. Even if this component is real and due to cluster gas, the radio plume is over-pressured unless it is beamed towards us at an angle of less than 0.4 degrees to the line of sight and a bulk velocity of more than 0.985c. The gas pressure at the radius of the extended emission-line regions is at most Pa.
We have used our new multifrequency VLBA data to study the relationship between the X-ray and radio components. There is no excess absorption in the X-ray spectrum which might have allowed us to conclude that 3C 48 is small (most of the emission is within 0.5 arcsec of the nucleus) because it is bottled up by cold neutral gas.
We find weak () evidence for a proper motion of in the compact radio component B, about 0.05 arcsec from the core. It is quite plausible that the radio emission from 3C 48 undergoes sufficient interaction with the external medium that the source is intrinsically one sided at such distances from the nucleus. In that case relativistic beaming may not be important. However, if we assume intrinsic symmetry, the upper limit to the flux of knot B’s counterjet and the measured proper motion combine to suggest that relativistic boosting along the line of sight is important.
The X-ray emission of core-dominated radio-loud quasars is believed to be dominated by non-thermal radiation from the radio core, and indeed these sources show a good correlation between radio and X-ray flux. The fact that 3C 48 is consistent with the correlation leads to an expectation that substantial X-ray emission should arise from its radio features. At VLBI resolution, 3C 48 is unusual as compared with flat-spectrum quasars in that less than 1 per cent of its 1.5-GHz flux density arises from the core, and so X-ray emission from these extended radio regions would be required. The radio source is so compact that even Chandra’s resolution is insufficient to resolve spatially any X-ray emission from the radio structures. However, using the X-ray spectral results we find that synchrotron-emitting electrons in the radio plume could contribute significantly to the harder X-ray emission through SSC and up-scattering infra-red emission from the quasar nucleus. This requires the radio-regions to be free from relativistic boosting, in which case we would infer that the radio source is intrinsically one sided at distances of 300 pc and more from the nucleus, and it requires that the magnetic field is a factor of six to ten below the equipartition value. Stringent requirements on the jet opening angle make it unlikely that all of the X-ray emission is from a fast jet which sees boosted CMB emission and emits beamed X-rays in the observer’s frame, the model which is currently the most popular for explaining resolved X-ray emission from large-scale quasar jets.
The possibility remains that the X-ray emission from 3C 48 arises from close to the central engine. It may be unrelated to the radio emission, either from an embedded blazar or associated with the accretion processes, or the hard X-ray emission may arise from the up-scattering of infra-red emission from the quasar nucleus if the geometry is favourable and the magnetic field in the inner region is a factor of two to three below equipartition. The fact that the ratio of X-ray to radio emission is so close to that in quasars where a radio-X-ray relationship is established is then a coincidence.
Acknowledgements
We acknowledge support from NASA contract NAS8-39073 and grant NAG 5-1934 during the early stages of this work, and DMW thanks the Caltech Astronomy Department for hospitality. MJH thanks the Royal Society for a Research Fellowship. We are grateful to the anonymous referee for suggesting we consider the emission from a beamed component within the core and for other suggestions which improved the paper, and to Mark Birkinshaw for discussions. The VLBA is an instrument of the National Radio Astronomy Observatory, a facility of the National Science Foundation operated under cooperative agreement by Associated Universities, Inc.
References
- [1] Arnaud, M., Evrard, A.E., 1999, MNRAS, 305, 631
- [2] Axon, D.J., Capetti, A., Fanti, R., Morganti, R., Robinson, A., Spencer, R., 2000, AJ., 120, 2284
- [3] Barr, P., Mushotzky, R.F. 1986, Nature, 320, 421
- [4] Barthel, P.D., Pearson, T.J., Readhead, A.C.S., 1988, ApJ, 329, L51
- [5] Birkinshaw, M., 1994, in Crabtree, D.R., Hanisch, R.J., Barnes, J., eds., ASP Conference Series, Vol. 61, p. 249
- [6] Birkinshaw, M., Worrall, D.M., 1993, ApJ, 412, 568
- [7] Böhringer, H., et al., 2001, A&A 365, L181
- [8] Briel, U.G. et al. 1994, The ROSAT Users’ Handbook, Max-Planck-Institute für Extraterrestrische Physik
- [9] Briggs, D.E., 1995, Ph.D. thesis, New Mexico Institute of Mining and Technology
- [10] Browne, I.W.A., Murphy, D.W., 1987, MNRAS, 226, 601
- [11] Brunetti, G., Comastri, A., Dallacasa, D., Bondi, M., Pedani, M., Setti, G., 1999, A&A, 342, 57
- [12] Chatzichristou, E.T., Vanderriest, C., Jaffe, W., 1999, A&A, 343, 407
- [13] Cotton, W.D., Dallacasa, D., Fanti, C., Fanti, R., Foley, A.R., Schilizzi, R.T., Spencer, R.E., 1997, A&A, 325, 493
- [14] Crawford, C.S., Lehmann, I., Fabian, A.C., Bremer, M.N., Hasinger, G., 1999, MNRAS, 308, 1159
- [15] Crawford, C.S., Fabian, A.C., 2003, MNRAS, 339, 1163
- [16] Davis, J.E., 2001, ApJ, 562, 575
- [17] Elvis, M., Lockman, F.J., Wilkes, B.J., 1989, AJ, 97, 777
- [18] Elvis, M. et al., 1994, ApJS, 95, 1
- [19] Fabian, A.C., Crawford, C.S., Johnstone, R.M., Thomas, P.A., 1987, MNRAS, 228, 963
- [20] Fanti, R., Fanti, C., Schilizzi, R.T., Spencer, R.E., Nan, R., Parma, P., van Breugel, W.J.M., Venturi, T., 1990, A&A, 231, 333
- [21] Gambill, J.K., Sambruna, R.M., Chartas, G., Cheung, C.C., Maraschi, L., Tavecchio, F., Urry, C.M., Pesce, J.E., 2003, A&A, 401, 505
- [22] Ghisellini, G., Celotti, A., Fossati, G., Maraschi, L., Comastri, A., 1998, MNRAS, 301, 451
- [23] Greenstein, J.L., Matthews, T.A., 1963, Nature, 197, 1041
- [24] Hardcastle, M.J., Worrall, D.M., 1999, MNRAS, 309, 969
- [25] Hardcastle, M.J., Worrall, D.M., 2000, MNRAS, 319, 562
- [26] Hardcastle, M.J., Birkinshaw, M., Worrall, D.M., 2001, MNRAS, 326, 1499
- [27] Hardcastle, M.J., Birkinshaw, M., Cameron, R.A., Harris, D.E., Looney, L.W., Worrall, D.M., 2002, ApJ, 581, 948
- [28] Harris, D.E., Silverman, J.D., Hasinger, G., Lehman, I., 1998, A&AS, 133, 431
- [29] Hartas, J.S., Rees, W.G., Scott, P.F., Duffett-Smith, P.J., 1983, MNRAS, 205, 625
- [30] Kembhavi, A., 1993, MNRAS, 264, 683
- [31] Kirhakos, S., Bahcall, J.N., Schneider, D.P., Kristian, J., 1999, ApJ, 520, 67
- [32] Kus, A.J., Wilkinson, P.N., Pearson, T.J., Readhead, A.C.S., 1990, in Zensus J.A. & Pearson, T.J., eds., Parsec-Scale Radio Jets, Cambridge University Press, p. 161
- [33] Kus, A.J., Booth, R.S., Marecki, A., Maszkowski, R., Porcas, R.W., Pearson, T.J., Readhead, A.C.S., Wilkinson, P.N., 1993, in Davis, R.J. & Booth, R.S., eds., Sub-arcsec Radio Astronomy Cambridge University Press, p. 222
- [34] Laing, R.A., Riley, J.M., Longair, M.S., 1983, MNRAS, 204, 151
- [35] Matthews, T.A., & Sandage, A.R., 1963, ApJ, 138, 30
- [36] Meisenheimer, K., Haas, M., Müller, S.A.H., Chini, R., Klaas, U., Lemke, D., 2001, A&A, 372, 719
- [37] Nan, R., Schilizzi, R.T., Fanti, C., Fanti, R., 1991, A&A, 252, 513
- [38] Neugebauer, G., Soifer, B.T., Miley, G.K., 1985, ApJ, 295, L27
- [39] O’Dea, C.P., 1998, PASP, 110, 493
- [40] O’Dea, C.P., Worrall, D.M., Baum, S.A., Stanghellini, C., 1996, AJ., 111, 92
- [41] Ott, M., Witzel, A., Quirrenbach, A., Krichbaum, T.P., Standke, K.J., Schalinski, C.J., Hummel, C.A., 1994, A&A, 284, 331
- [42] Peacock, J.A., Wall, J.V., 1982, MNRAS, 198, 843
- [43] Prieto, M.A., 1996, MNRAS, 282, 421
- [44] Sambruna, R.M., Maraschi, L., Tavecchio, F., Urry, C.M., Cheung, C.C., Chartas, G., Scarpa, R., Gambill, J.K., 2002, ApJ, 571, 206
- [45] Scoville, N.Z., Padin, S., Sanders, D.B., Soifer, B.T., Yun, M.S., 1993, ApJ, 415, L75
- [46] Shastri, P., Wilkes, B.J., Elvis, M., McDowell, J., 1993, ApJ, 410, 29
- [47] Siemiginowska, A., Aldcroft, T.L., Bechtold, J., Elvis, M., 2003a, ApJ, in preparation
- [48] Siemiginowska, A., Aldcroft, T.L., Bechtold, J., Brunetti, G., Elvis, M., Stanghellini, C., 2003b, PASA, 20, 113
- [49] Simon, R.S., Readhead, A.C.S., Moffet, A.T., Wilkinson, P.N., Allen, B., Burke, B.F., 1983, Nature, 302, 487
- [50] Simon, R.S., Readhead, A.C.S., Moffet, A.T., Wilkinson, P.N., Booth, R., Allen, B, Burke, B.F., 1990, ApJ, 354, 140
- [51] Steppe, H., Jeyakumar, S., Saikia, D.J., Salter, C.J., 1995, A&AS, 113, 409
- [52] Stockton, A., Ridgway, S.E., 1991, AJ, 102, 488
- [53] Tavecchio, F., Maraschi, L., Sambruna, R.M., Urry, C.M., 2000, ApJ, 544, L23
- [54] Wilkes, B.J., Elvis, M., 1987, ApJ, 323, 243
- [55] Wilkinson, P.N., Tzioumis, A.K., Akujor, C.E., Benson, J.M., Walker, R.C., Simon, R.S., 1990, in Zensus J.A. & Pearson, T.J., eds., Parsec-Scale Radio Jets, Cambridge University Press, p. 152
- [56] Wilkinson, P.N., Tzioumis, A.K., Benson, J.M., Walker, R.C., Simon, R.S., Kahn, F.D., 1991, Nature, 352, 313
- [57] Woan, G., 1992, A&A, 254, 25
- [58] Worrall, D.M., 1989, in AGN and the X-ray Background, Proc. 23rd ESLAB Symposium, Noordwijk: ESA SP-296, p. 719
- [59] Worrall, D.M., Birkinshaw, M., 2001, ApJ, 551, 178
- [60] Worrall, D.M., Wilkes, B.J., 1990, ApJ, 360, 396
- [61] Worrall, D.M., Giommi, P., Tananbaum, H., Zamorani, G., 1987, ApJ. 313. 596
- [62] Worrall, D.M., Lawrence, C.R., Pearson, T.J., Readhead, A.C.S. 1994, ApJ, 420, L17
- [63] Worrall, D.M., Birkinshaw, M., Hardcastle, M.J., 2001, MNRAS, 326, L7
- [64] Yee, H.K.C., Green, R.F., 1987, ApJ, 319, 28
- [65] Zamorani, G., 1984, in Fanti, R., Kellermann, K., Setti, G., eds, IAU Symposium 110, VLBI and compact radio sources, Reidel, Dordrecht, p. 85