GRB 011121: A collimated outflow into wind-blown surroundings††thanks: Based on observations collected at the European Southern Observatory, La Silla and Paranal, Chile (ESO Programme 165.H-0464).
Abstract
We report optical and near-infrared follow-up observations of GRB 011121 collected predominantly at ESO telescopes in Chile. We discover a break in the afterglow light curve after 1.3 days, which implies an initial jet opening angle of about 9°. The jet origin of this break is supported by the fact that the spectral energy distribution is achromatic during the first four days. During later phases, GRB 011121 shows significant excess emission above the flux predicted by a power law, which we interpret as additional light from an underlying supernova. In particular, the spectral energy distribution of the optical transient approximately 2 weeks after the burst is clearly not of power-law type, but can be presented by a black body with a temperature of 6000 K. The deduced parameters for the decay slope as well as the spectral index favor a wind scenario, i.e. an outflow into a circum-burst environment shaped by the stellar wind of a massive GRB progenitor. Due to its low redshift of =0.36, GRB 011121 has been the best example for the GRB-supernova connection until GRB 030329, and provides compelling evidence for a circum-burster wind region expected to exist if the progenitor was a massive star.
1 Introduction
In the presently favoured scenario for classical gamma-ray bursts (GRBs), occurring at cosmological distances (measured redshift range so far ; van Paradijs et al. 1997; Andersen et al. 2000), the explosion of a very massive star leads to a fireball and a short, beamed flash of gamma-rays (Woosley 1993; Fryer et al. 1999; Mészáros 2002), resulting in three physically distinct observational phenomena, namely the GRB itself, a long-lasting afterglow and the classical supernova (SN) light. Whereas the afterglow emission is probably fed by the kinetic energy of the collimated, relativistic outflow, the supernova light is caused by the decay of radioactive nuclei created and released during the stellar explosion. The maximum of the supernova light is expected at 10–20 (1+) days after the explosion, though at present it is not clear whether or not the GRB and the supernova explosion are delayed (Vietri & Stella 1998). One of the basic consequences of this hypernova scenario is that it predicts (and links) the occurrence of a GRB with a jet, the unavoidable strong wind from the massive progenitor star, and the supernova light (Heger et al. 2003).
Earlier evidence on the GRB-SN connection was initially based on the coincidence of GRB 980425 and SN1998bw (Galama et al. 1998), and subsequently some supernova light contribution was found in the late-time light curves of GRB 980326 (Castro-Tirado & Gorosabel 1999, Bloom et al. 1999), GRB 970228 (Galama et al. 2000), GRB 970508 (Sokolov et al. 2002) and possibly GRB 980703 (Holland et al. 2001), GRB 990712 (Björnsson et al. 2001), GRB 991208 (Castro-Tirado et al. 2001) and GRB 000911 (Lazzati et al. 2001).
Observations of massive stars in our Galaxy have shown that they lose matter via strong stellar winds in the LBV and in the Wolf-Rayet evolutionary phase. GRB progenitors are expected to be very massive stars and perhaps physically related to Ib/c supernovae (Heger et al. 2003). The progenitors of these stars should develop fast winds at the end of their lives and thus, wind features are expected to be seen in afterglow light curves. The evolution of classical supernova remnants into wind-blown bubbles has been a target of detailed investigations since years (e.g., Benetti et al. 1999; Landecker et al. 1999). What has been missing in GRB research until GRB 030329 (Hjorth et al. 2003), however, was a strong observational link between an underlying supernova component in an afterglow light curve and evidence for a fireball expanding into a stellar wind profile. Significant work into this direction has been done over the past years by many groups from the theoretical as well as from the observational side (e.g., Mészáros, Rees, & Wijers 1998; Chevalier & Li 2000) and GRBs with wind-profile interactions have been identified in some cases, including GRB 980425/SN 1998bw (Chevalier & Li 2000). However, if one excludes GRB 980425 from this list, prior to GRB 011121 the observational data base was rather poor. The burst 011121 changed this observational situation, though in a less spectacular way than GRB 030329. Not only was the distance of the burster relatively small but also the light curve steepened 1 day after the burst so that a bright supernova component became visible.
GRB 011121 was detected by the GRBM/WFC onboard BeppoSAX on 2001 November 21, 18:47:21 UT and localized to initially 5 arcmin (Piro 2001a). Subsequent analysis refined this position to 2 arcmin accuracy (Piro 2001b), and the triangulation of the GRB arrival times as measured by Ulysses, BeppoSAX (Hurley et al. 2001) and HEND (Hurley et al. 2002) further refined the coordinates. A follow-up X-ray observation with the BeppoSAX narrow-field instruments revealed a fading X-ray afterglow (Piro et al. 2001).
Follow-up optical/NIR observations of GRB 011121 were quickly started by several groups, leading to independent discoveries of the afterglow (e.g., Wyrzykowski et al. 2001; Greiner et al. 2001). Further observations revealed a rather small distance, (Infante et al. 2001), and excess emission above the early power-law decay (Garnavich et al. 2001). The interpretation of this excess light as a possible supernova bump attracted much attention and resulted in the so far best sampling of GRB afterglow emission at late times.
Here we report the results of observations obtained by the GRACE111http://zon.wins.uva.nl/grb/grace/ (GRB Afterglow Collaboration at ESO) consortium.
2 Observations
2.1 X-rays/Gamma-rays
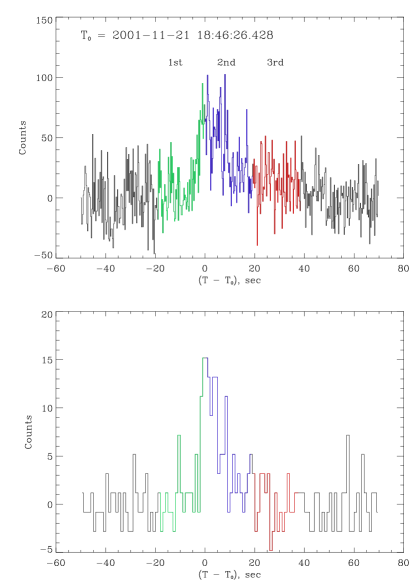
The light curves of GRB 011121 measured with the two detectors of HEND are shown in Fig. 1. Integrated into the Third Interplanetary Network, the “Mars Odyssey” satellite has two instruments with GRB detection capabilities: the Gamma-Ray Spectrometer and the High Energy Neutron Detector (HEND). HEND combines four detectors to measure the spectra of neutrons and gamma-rays (Mitrofanov et al. 2003). In particular, the inner/outer CsI-scintillators can measure gamma-ray photons in the 30–1000 keV range, at commandable integration times, and in case of a GRB-trigger (or solar flare), time histories at 1.0/0.25 sec resolution are recorded.
Fig. 1 shows that the gamma-ray emission is characterized by a main peak with 10 sec duration, followed by a 20 sec tail. Thus, GRB 011121 clearly belongs to the long-duration sub-class of GRBs.
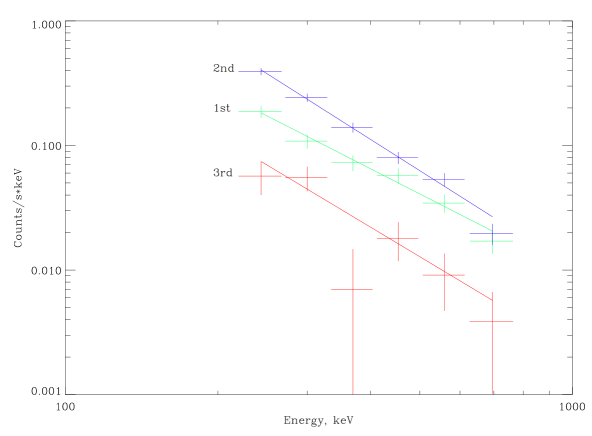
According to the HEND energy spectra (Fig. 2) there is no obvious spectral evolution along the light curve of GRB 011121. All three 20 sec segments of the time profile have spectra with the same power law slope with a photon index of –2.350.25 (after backwards folding of the model with the instrument response). There is no evidence in the HEND data that the early afterglow emission started already at the time of the last segment of the burst.
Based on the power law spectral slope of 2.35, the fluence is erg cm-2 in the 250–700 keV range. This corresponds to an (isotropic) energy release of = 2.71052 erg at the given redshift (luminosity distance of 2.07 Gpc) and the cosmological parameters = 0.3, and km s-1 Mpc-1.
2.2 Optical and NIR Imaging
About 9 hours after the GRB, - and -band images were obtained at La Silla (ESO) with SOFI (equipped with a 10241024 HgCdTe HAWAII array with 18.5 m pixels and a plate scale of 029/pixel) at the 3.58m NTT, and with EFOSC2 (equipped with a 20482048 thinned Loral/Lesser CCD with 15 m pixels and a plate scale of 0157/pixel) at the 3.6m telescope, respectively. After our independent discovery of the afterglow, second epoch observations plus some exposures with additional filters were obtained ( 4 hrs later) at the end of that night. Multi-colour photometry continued at the NTT and 3.6 m telescope during the next three days and at the VLT thereafter. Due to the rapidly decreasing afterglow brightness we switched to the instruments at the 8.2 m Very Large Telescopes (VLT) starting on day 3 after the GRB. For our near-infrared (NIR) observations, the short wavelength (0.9–2.5 m) arm of the infrared spectrometer ISAAC (equipped with a 10241024 pixel Rockwell HgCdTe array and a plate scale of 0147/pixel) on the VLT-telescope Antu was used, and for the optical observations the Focal Reducer and Spectrograph FORS (equipped with a SITE CCD with 24 m pixels and a plate scale of 02/pixel) at VLT/Yepun.
Additional imaging was performed in the and bands at the ESO 1.54 m Danish telescope on La Silla (Chile), in the band at the Anglo-Australian Telescope (AAT) and in the and bands at the 4-m Blanco telescope of the Cerro Tololo Interamerican Observatory (CTIO). The 1.54 m Danish telescope was equipped with a 20484096 EEV/MAT frame-transfer CCD (illuminated area is 20482048 pixel) with 15 m pixels, which provides a plate scale of 039/pixel. At the AAT the IRIS2 instrument with a 10241024 Rockwell HAWAII-1 HgCdTe detector was used, having a pixel scale of 0446/pixel. At CTIO, the Ohio State InfraRed Imager/Spectrometer (OSIRIS) with a 10241024 HAWAII-1 HgCdTe detector was used, having a plate scale of 0161/pixel.
| Date (UT) | Telescope/Instrument | Filter/Grism(a) | Exposure (sec) | Seeing | Brightness (mag)(b) |
|---|---|---|---|---|---|
| 2001 Nov 22 03:03–03:25 | ESO NTT/SOFI | 1063 | 07 | 15.190.07 | |
| 2001 Nov 22 04:03–04:14 | ESO 3.6 m/EFOSC2 | 3180 | 15 | 18.860.02 | |
| 2001 Nov 22 07:30–08:01 | ESO 3.6 m/EFOSC2 | 3600 | 10 | 19.510.01 | |
| 2001 Nov 22 07:47–08:22 | ESO NTT/SOFI | 2570 | 08 | 17.470.04 | |
| 2001 Nov 22 08:23–08:47 | ESO NTT/SOFI | 1770 | 07 | 16.720.05 | |
| 2001 Nov 22 08:47–09:06 | ESO NTT/SOFI | 1370 | 09 | 16.090.07 | |
| 2001 Nov 22 14:00–14:14 | AAO AAT/IRIS2 | 1060 | 27 | 17.300.25 | |
| 2001 Nov 23 00:04–00:20 | ESO NTT/SOFI | 1170 | 12 | 17.710.10 | |
| 2001 Nov 23 00:20–00:39 | ESO NTT/SOFI | 1370 | 16 | 19.380.10 | |
| 2001 Nov 23 04:30–04:40 | ESO 3.6 m/EFOSC2 | 3180 | (c) | 21.230.05 | |
| 2001 Nov 23 04:41–04:57 | ESO 3.6 m/EFOSC2 | 3300 | (c) | 22.400.50 | |
| 2001 Nov 23 04:58–05:08 | ESO 3.6 m/EFOSC2 | 3180 | (c) | 21.950.15 | |
| 2001 Nov 23 08:29–08:45 | ESO NTT/SOFI | 1170 | 09 | 19.730.10 | |
| 2001 Nov 23 08:45–09:01 | ESO NTT/SOFI | 1170 | 09 | 18.290.10 | |
| 2001 Nov 23 08:29–08:39 | ESO 3.6 m/EFOSC2 | 3180 | 13 | 21.750.08 | |
| 2001 Nov 23 08:39–08:44 | ESO 3.6 m/EFOSC2 | 300 | 16 | 21.70 | |
| 2001 Nov 23 06:45–08:34 | ESO Yepun/FORS2 | 600B | 22400+1500 | 15,10,12 | — |
| 2001 Nov 23 07:22–08:34 | ESO Antu/ISAAC | 1.1–1.4 m | 3600 | 12 | — |
| 2001 Nov 24 06:24–06:48 | ESO Antu/ISAAC | 1560 | 07 | 19.300.08 | |
| 2001 Nov 24 06:53–07:16 | ESO Antu/ISAAC | 1560 | 07 | 19.810.05 | |
| 2001 Nov 24 07:18–07:36 | ESO Antu/ISAAC | 1090 | 06 | 20.930.10 | |
| 2001 Nov 24 07:53–08:59 | ESO Antu/ISAAC | 1.95–2.55 m | 3600 | 12 | — |
| 2001 Nov 24 07:43–08:01 | ESO Yepun/FORS2 | 3300 | 08 | 23.700.30 | |
| 2001 Nov 24 08:02–08:14 | ESO Yepun/FORS2 | 3180 | 08 | 23.370.05 | |
| 2001 Nov 24 08:15–08:27 | ESO Yepun/FORS2 | 3180 | 08 | 22.930.08 | |
| 2001 Nov 25 06:43–06:59 | ESO Antu/ISAAC | 1090 | 09 | 21.640.30 | |
| 2001 Nov 25 07:01–07:24 | ESO Antu/ISAAC | 1560 | 06 | 20.730.10 | |
| 2001 Nov 25 07:27–07:52 | ESO Antu/ISAAC | 1560 | 08 | 20.020.10 | |
| 2001 Nov 25 06:34–08:10 | ESO Yepun/FORS2 | 150I | 31800 | 05 | — |
| 2001 Nov 25 08:10–08:22 | ESO Yepun/FORS2 | 3180 | 08 | 23.680.15 | |
| 2001 Nov 25 08:23–08:34 | ESO Yepun/FORS2 | 3180 | (d) | 24.40 | |
| 2001 Nov 25 07:41–08:13 | ESO 1.54 m Danish | 1880 | 11 | 23.600.40 | |
| 2001 Nov 30 08:05–08:51 | CTIO OSIRIS | 1960 | 07 | 19.40 | |
| 2001 Dec 01 08:07–08:39 | CTIO OSIRIS | 8120 | 09 | 20.10 | |
| 2001 Dec 03 07:50–08:25 | CTIO OSIRIS | 10120 | 12 | 20.10 | |
| 2001 Dec 05 06:28–07:01 | ESO Melipal/FORS1 | 3600 | 09 | 24.300.02 | |
| 2001 Dec 05 07:02–07:33 | ESO Melipal/FORS1 | 3600 | 09 | 23.200.08 | |
| 2001 Dec 05 07:34–08:07 | ESO Melipal/FORS1 | 3600 | 09 | 22.350.25 | |
| 2001 Dec 05 06:53–08:09 | ESO Antu/ISAAC | 4090 | 06 | 22.410.15 | |
| 2001 Dec 07 06:45–08:02 | ESO Antu/ISAAC | 4090 | 06 | 22.690.10 | |
| 2001 Dec 08 06:20–06:30 | ESO Melipal/FORS1 | 600 | 08 | 24.090.02 | |
| 2001 Dec 09 06:49–08:05 | ESO Antu/ISAAC | 4090 | 07 | 22.520.15 | |
| 2001 Dec 09 07:33–07:43 | ESO Melipal/FORS1 | 600 | 10 | 23.940.02 | |
| 2001 Dec 10 06:47–06:57 | ESO Melipal/FORS1 | 600 | 08 | 23.650.08 | |
| 2001 Dec 11 07:33–08:06 | ESO Melipal/FORS1 | 3600 | 06 | 23.450.08 | |
| 2001 Dec 11 08:07–08:29 | ESO Melipal/FORS1 | 2600 | 07 | 24.180.02 | |
| 2001 Dec 12 05:12–07:30 | ESO Yepun/FORS2 | 300I | 41800 | 07-12 | — |
| 2001 Dec 13 07:19–08:46 | ESO Antu/ISAAC | 4090 | 07 | 22.890.15 | |
| 2001 Dec 15 05:10–05:27 | ESO 1.54m Danish | 4900 | 12 | 24.70 | |
| 2001 Dec 16 04:51–05:08 | ESO 1.54m Danish | 2900 | 13 | 23.90 | |
| 2001 Dec 17 04:55–05:12 | ESO 1.54m Danish | 4900 | 20 | 23.80 | |
| 2001 Dec 17 07:20–08:47 | ESO Antu/ISAAC | 4090 | 10 | 22.790.30 | |
| 2001 Dec 18 04:45–05:01 | ESO 1.54m Danish | 2900 | 11 | 23.80 | |
| 2002 Feb 09 04:04–05:24 | ESO Antu/ISAAC | 4090 | 05 | 24.85 |
(a) The filter is about
10% broader than the standard . Filters and
are narrower with respect to the canonical and bands,
respectively: has a width of 0.16 m (instead of 0.29
m), and has a width of 0.29 m centered at 2.16
m (instead of 0.35 m centered at 2.20 m).
However, since both narrow-band filters have a higher transmission than the
canonical filters, the net effect is that
0.05 ( 0.02)
when comparing the ISAAC vs. the SOFI filter.
The grisms 150I, 300I and 600B are described in the text.
(b) Not corrected for Galactic foreground extinction.
(c) Image quality affected by guiding problems.
(d) Variable seeing due to varying cirrus.
2.3 Spectroscopy
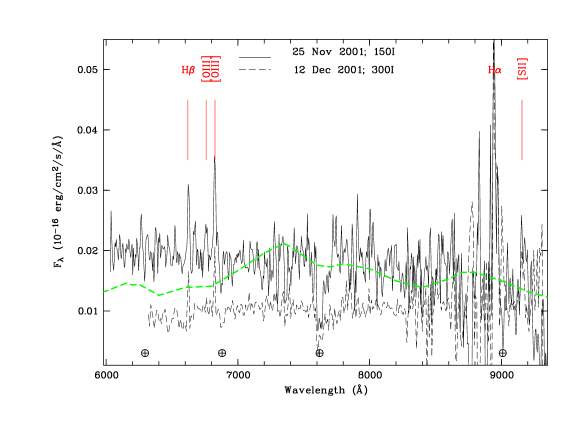
Spectroscopic observations were performed during the first two days in several wavelength bands to derive the redshift and during the maximum of the late-time bump to search for signatures of the potential supernova and to derive host galaxy parameters. In the bands the short-wavelength arm of ISAAC was used at low resolution (with a final dispersion of 3.6 Å/pixel in the band, and 7.2 Å/pixel in the band), The 10 slit was used. The band spectra were both taken at 12 seeing, thus giving a FWHM resolution of 29 Å ( band) and 59 Å ( band).
Optical spectra were taken with FORS2 at the Yepun telescope at three different occasions, each with a different grism (see Tab. 1). The 150I grism has a mean 5.5Å/pixel scale, which at the 05 seeing and the use of a 07 slit led to a resolution of 14 Å (FWHM). Grism 300I has a mean 2.59 Å/pixel scale, leading to a resolution of 13 Å (FWHM) at 07–12 seeing and use of the 10 slit. Finally, grism 600B with a mean 1.2 Å/pixel scale at 12–15 seeing and the 10 slit led to a FWHM resolution of 6 Å. The pixel scale changes by less than 5% from the red to the blue end of each grism. The peak spectral response for the 150I, 300I and 600B grism is at 5000 Å, 7500 Å and 4000 Å, respectively.
| Star | Coordinates (J2000.0) | ||
|---|---|---|---|
| B1 | 11h34m189 –76°01′37′′ | 20.110.01 | 18.930.01 |
| B2 | 11h34m197 –76°02′06′′ | 20.950.01 | 19.950.02 |
| B3 | 11h34m272 –76°01′52′′ | 22.930.03 | 21.930.04 |
| B4 | 11h34m272 –76°02′34′′ | 23.940.07 | 22.490.05 |
| B5 | 11h34m274 –76°02′22′′ | 21.580.01 | 20.350.02 |
| B6 | 11h34m299 –76°02′36′′ | 23.690.05 | 22.270.05 |
| B7 | 11h34m333 –76°01′33′′ | 20.640.01 | 19.590.01 |
| B8 | 11h34m362 –76°01′07′′ | 23.000.05 | 21.410.04 |
| B9 | 11h34m389 –76°01′38′′ | 20.370.01 | 19.030.01 |
| B10 | 11h34m419 –76°01′04′′ | 25.250.16 | 23.010.09 |
| B11 | 11h34m529 –76°01′31′′ | 23.500.05 | 21.570.03 |
B4=R5, B6=R6, B7=J2.
| Star | Coordinates (J2000.0) | ||
|---|---|---|---|
| R1 | 11h34m108 –76°02′50′′ | 20.870.05 | 20.060.02 |
| R2 | 11h34m112 –76°03′23′′ | 20.960.02 | 20.350.02 |
| R3 | 11h34m154 –76°00′37′′ | 19.970.04 | 19.340.01 |
| R4 | 11h34m180 –76°02′32′′ | 23.430.10 | 22.950.08 |
| R5 | 11h34m272 –76°02′34′′ | 21.750.04 | 21.090.03 |
| R6 | 11h34m299 –76°02′36′′ | 21.480.04 | 20.800.03 |
| R7 | 11h34m333 –76°02′30′′ | 21.820.06 | 21.130.03 |
| R8 | 11h34m408 –76°02′36′′ | 20.470.03 | 19.980.01 |
| R9 | 11h34m419 –76°01′35′′ | 22.360.05 | 21.840.05 |
| R10 | 11h34m438 –76°01′27′′ | 22.780.07 | 21.490.04 |
| R11 | 11h34m454 –76°01′32′′ | 19.360.08 | 18.870.01 |
R5=B4, R6=B6.
| Star | Coordinates (J2000.0) | |||
|---|---|---|---|---|
| J1 | 11h34m390 –76°01′17′′ | 15.210.05 | 14.810.05 | 14.910.05 |
| J2 | 11h34m333 –76°01′33′′ | 17.280.05 | 16.740.05 | 16.820.05 |
| J3 | 11h34m258 –76°01′37′′ | 18.560.05 | 18.280.05 | 18.270.05 |
| J4 | 11h34m356 –76°01′53′′ | 17.150.05 | 16.310.05 | 16.310.05 |
|
3 Data reduction, analysis, and basic results
3.1 Photometry
The optical and near-infrared images were reduced in standard fashion using IRAF222IRAF is distributed by the National Optical Astronomical Observatories, which is operated by the Associated Universities for Research in Astronomy, Inc., under contract to the National Science Foundation. as well as ESO’s eclipse package (Devillard 2002). Photometric calibration of the GRB field was performed using SExtractor (Bertin & Arnouts 1996). Airmass correction was done according to the coefficients provided by ESO’s Web pages (in units of mag airmass-1): , , , for VLT FORS1 and FORS2, and =0.06, =0.06, =0.07 for VLT ISAAC at Paranal, =0.20, =0.11, =0.05, =0.02 for La Silla. For the optical observations, the Landolt standard fields observed were SA 92-249, MarkA, Rubin 152, GD 108 and SA 100. For the NIR calibration the UKIRT infrared standard star FS 12 was used.
Local photometric standards (Tables LABEL:bstand, LABEL:rstand, 4) were selected according to their detection in by SExtractor and a small scatter in their measured magnitudes on the images taken at different observing epochs. Moreover, care was taken that the difference between the deduced Bessel- band magnitudes (FORS1) and the magnitudes (FORS2) of these stars was less than about 0.1 mag. These local photometric standards were then used to derive the magnitude of the optical transient (Tab. 1) after removal of the host galaxy.
 |
 |
 |
 |
The accuracy of the photometry in the different filters has been cross-checked on the set of images taken on 24 November 2001 via a comparison of the observed stellar brightnesses versus those of expected synthetic stars. For this we have first measured the magnitudes of our local standard stars using YODA (Drory 2003), after having convolved the images to the common worst seeing of 14. In a second step, we took synthetic stellar spectra from the Pickles spectral library and convolved those with the filter transmission curves and efficiencies of the corresponding instrument (FORS2+ISAAC). Finally, we overplotted the measured standards over the synthetic stars in various color-color diagrams (Fig. 5). This shows that the photometric calibration is of coherent quality over all the 7 filter bands used.
3.2 The light curve
GRB 011121 occurred at galactic coordinates . The Schlegel, Finkbeiner, & Davis (1998) extinction maps predict mag along this line of sight through the Galaxy. Assuming the usual ratio of visual-to-selective extinction of 3.1, this gives 1.4 mag. The HI maps of Dickey & Lockman (1990) give cm-2 which translates into 0.9 mag using the extinction to absorption correlation of Predehl & Schmitt (1995). We used the higher of the above two values, and then followed standard procedures (Rieke & Lebofsky 1985; Cardelli, Clayton, & Mathis 1989; Reichart 2001) to calculate the extinction in the other photometric bands, resulting in: = 1.87 mag, = 1.15 mag, = 0.83 mag, = 0.40 mag, = 0.25 mag and = 0.17 mag. In all the light curve plots this extinction has been corrected for.
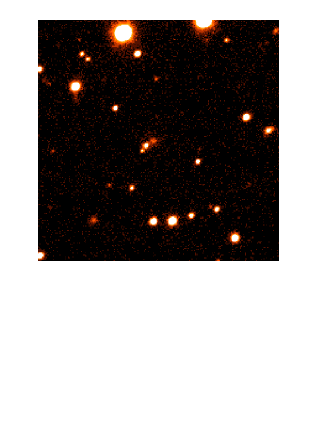
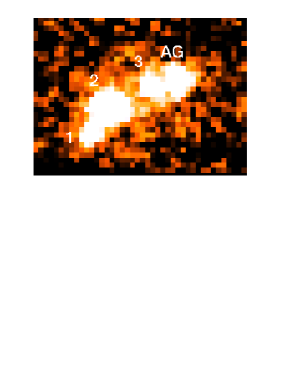
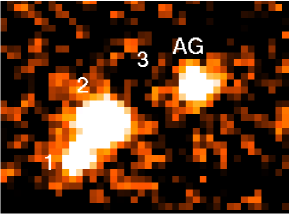
Accurate photometry of the afterglow requires a careful removal of contaminating light from the underlying GRB host galaxy which has an angular extent of two arcseconds (Fig. 4). This was accomplished with a two-component intensity profile model, as described in more detail in §4.4. The model is derived from the J band image of 9 February 2002, taken at a seeing of 045. We assume that the radial profile of the host galaxy is the same in all filter bands, as justified by a comparison of the scale lengths of 86 face-on galaxies in the filter bands by de Jong (1996), who finds that they are identical within the errors (the disk scale length ratio of vs. band is 1.070.08). The subtraction is done in count space on the images before the photometry, and for each image the host model is first convolved with the seeing of that exposure, and then iteratively adjusted in intensity until the area around the afterglow is best matched to the undisturbed background somewhat further away. As a consistency test we computed the host magnitude for each image taking into account the seeing convolution and the final intensity normalization, and found that the host magnitude differs at most by 0.07 mag (two instances) from the values given in §4.4. In addition, star 1 from Fig. 3 has been used to monitor the quality of the subtraction, which was always accurate to better than 0.05 mag. This ensures that the light curve shape is not contaminated by this subtraction procedure. An example of the result is shown in Fig. 6.
|
3.2.1 Light curve based on observations prior to t = 10 days
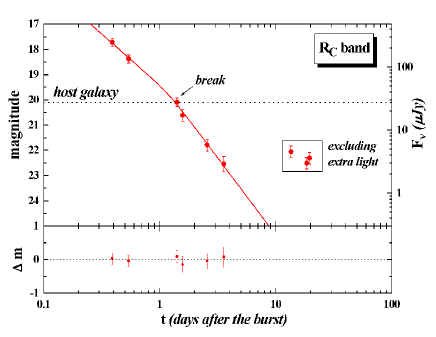
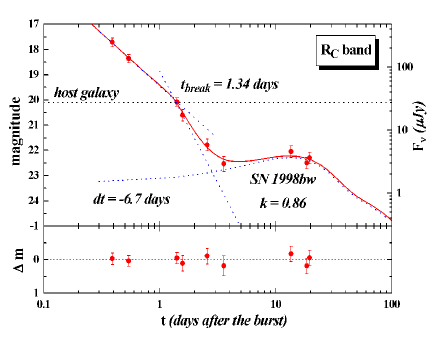
Figure 7 shows the afterglow light curve in the -band after removal of the flux from the underlying host galaxy, and after correcting for galactic extinction. Theoretical fits were obtained with the formula of Beuermann et al. (1999) in the representation of Rhoads & Fruchter (2001):
| (1) |
Here is the flux density, the break time (in days), and the parameter which describes the smoothness of the break. In all cases we fitted apparent magnitudes. Here and in the following we use the standard notation for the time and frequency dependence of the flux density in the simple fireball model: .
The fit of the -band data excluding the measurements at days gives an early-time slope of , a late-time slope of , and a break time days (d.o.f. = 0.45; d.o.f. degrees of freedom). The parameter which measures the sharpness of the break, was fixed at = 10, corresponding to a sharp break. However, values as low as = 1 give similarly good fits.
At early times (22 November 2001, 3:30 UT) we measure mag (after correction for galactic extinction). Hence, the spectral slope of the afterglow is . Two days later, on 24 November 2001, 7:00 UT, we find based on our data, which is consistent with the earlier result, and which is fully in agreement with the results obtained by Garnavich et al. (2003) and Price et al. (2002). These afterglow parameters are fully consistent with those expected from the simple versions of the fireball as well as observations of previous gamma-ray burst afterglows (e.g., van Paradijs, Kouveliotou, & Wijers 2000).
We can improve the fit by adding more data points as follows. First, using the deduced spectral index of the early afterglow we can estimate that at the time of the single AAO observations (Table 1), i.e. before the deduced break time, the -band magnitude of the optical transient was 20.120.25. Second, we can include in our fit the -band data from Garnavich et al. (2003) for days. In doing so, we get , , days, d.o.f. = 1.11.
3.2.2 Light curve based on all observations
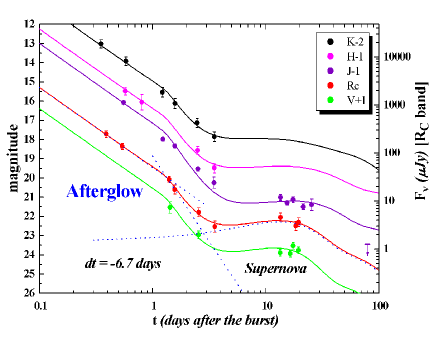
Including the “late-time” data (after = 10 days) to the fits adds substantially more freedom, since different model components can now compensate each other. As before, we only use -band data for the analysis. In order to account for the excess light after = 10 days, we assume that this “bump” is due to light from an underlying supernova. In fact, it has been officially designated as SN 2001ke (Garnavich et al. 2003). To model this supernova component we employ the observed light curves of SN 1998bw (Galama et al. 1998) as a template.
The effects of the redshift of GRB 011121 (=0.36) were taken into account assuming the cosmological parameters as given in section 2.1. For SN 1998bw we used a redshift of (Tinney et al. 1998). The entire numerical procedure is in detail explained in Zeh & Klose (2003). It interpolates smoothly between the light curves of SN 1998bw (Galama et al. 1998)333see also http://zon.wins.uva.nl/ titus/grb980425.html, so that for any given time a set of flux densities is calculated. The predicted time-dependent supernova light curve of a redshifted GRB-supernova based on the SN 1998bw template is then calculated according to the procedure outlined by Dado et al. (2002a). The apparent magnitude of a redshifted SN 1998bw in a given photometric band is finally obtained by integrating over the flux densities (transformed into per unit wavelength), multiplied by the corresponding filter response function, and by applying the usual normalization factors. The entire procedure has been succesfully applied for GRB 030329/SN 2003dh (Hjorth et al. 2003; Zeh et al. 2003) and has been successfully tested against the results obtained by others for other bursts (e.g., Masetti et al. 2003; Dado et al. 2002a). The results are shown in Figs. 8 and 9.
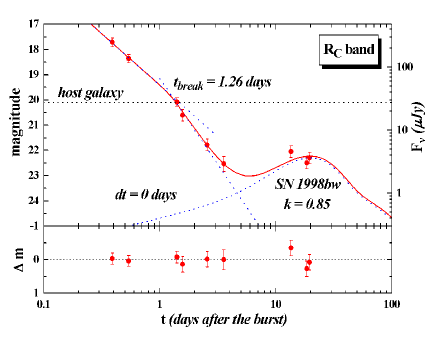
The resulting parameters are: days and with d.o.f. = 1.11. Here, is the luminosity ratio in the band between the GRB 011121 supernova and SN 1998bw at maximum (at ). As before, the parameter was held constant at 10 because otherwise the sparse data would not allow convergence of the numerical fitting algorithm. Our conclusions are not sensitive to the exact value of this parameter. On the other hand, we emphasize that the value we get for the parameter assumes a ’perfect’ SN 1998bw light curve at the redshift of the burster. Any potential relation between luminosity and light curve shape of a supernova in a certain photometric band is neglected here. In particular, does not say anything about the bolometric luminosity of the GRB supernova compared to SN 1998bw. This parameter is also sensitive to potential additional parameters which one can introduce in order to improve the fit of the SN light curve (see § 4.2.2).
For SN 1998bw we assumed zero extinction along the line of sight through our Galaxy. Accordingly, our results obtained for the luminosity of the supernova accompanying GRB 011121 in units of the luminosity of SN 1998bw, the parameter , scale as , if such an extinction is taken into account. Note also that we assumed a Galactic extinction along the line of sight of (Gal)= 1.4 mag. If smaller values are preferred (Bloom et al. 2002), has to be corrected/reduced again.
Figures 4 (middle panel), 8 and 9 show that the SN light already affected the afterglow light a few days after the GRB. This implies a substantial impact on the measurement of the parameter . Unfortunately, due to instrumental constraints, we have a data gap between days 4 and 10 after the burst trigger so that the 1 error of the deduced rises substantially when we include the SN light in the fit. Note that most of the data published previously are not host subtracted, and therefore cannot be simply added to our data set (Brown et al. 2001; Phillips et al. 2001; Price et al. 2001; Stanek & Wyrzykowski 2001). Despite this added uncertainty, our analysis clearly indicates the presence of a break about one day after the burst. The exact time of the break is sensitive to the details of the fit (compare the results we obtain by fitting data prior to = 10 days vs. fitting all the data), but the existence of the break at 1 day is clearly established. Previous studies of the afterglow light curve of GRB 011121 did not find this break (e.g., Price et al. 2002; Garnavich et al. 2003), which can be attributed to sparse sampling of the afterglow at this particular time. It remains difficult to explain why the radio data of the afterglow do not agree with a jet model (Price et al. 2002).
3.3 The spectrum of the afterglow
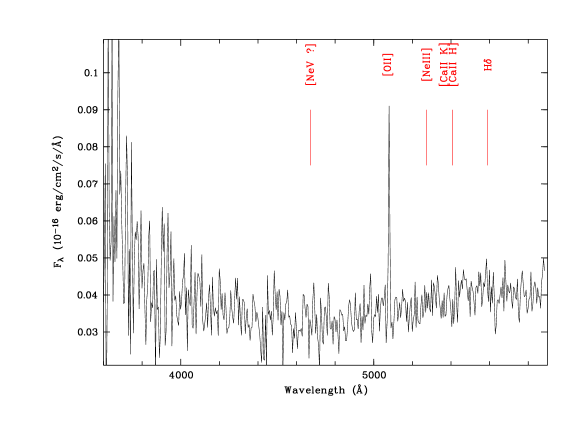
The VLT/FORS2 spectrum of the afterglow (including light from the host galaxy and the underlying supernova) contains several strong emission lines (Figs. 10, Tab. 3.3), but no absorption lines. The redshift determined from these lines is = 0.3620.001 (see the figures for line identifications), consistent with results of Infante et al. (2001). This redshift corresponds to a luminosity distance of 2.07 Gpc (assuming the cosmological parameters of section 2.1), and a distance modulus of 41.59 mag.
Using the foreground (§3.2), we have determined the extinction values in the lines , and corrected the measured line fluxes according to = exp(), where = 1/1.086 is the continuum extinction according to the galactic .
| Line | Flux | Luminosity | ||
|---|---|---|---|---|
| (Å) | (10-16 erg/cm2/s) | (1040 erg/s) | ||
| 5079 | 0.363 | 0.410.03 | 8.6 | |
| H | 6625 | 0.362 | 0.220.04 / 0.140.04(1) | 3.2/2.0 |
| 6760 | 0.362 | 0.110.06 / 0.080.05(1) | 1.6/1.1 | |
| 6821 | 0.362 | 0.350.05 / 0.160.04(1) | 4.9/2.2 | |
| H | 8945 | 0.363 | 0.960.08 / 0.810.09(1) | 9.2/7.7 |
| Pa | 25550 | 0.362 | 2.580.12 | 14.8 |
(1) The first number is measured from the 150I spectrum on 25 November 2001, while the second number is measured from the 300I spectrum on 12 December 2001.
4 Results and Discussion
4.1 The afterglow model and the relations
Since our finding of a jetted explosion is crucial for an understanding of the observational data we have carefully checked this result. When we fit our -band data (Table 1) with a single power-law plus SN component we get with d.o.f. = 1.49. Not only is the fit worse in comparison to the fit based on the Beuermann equation, the value we now get for is notably larger (3 deviation) than the one deduced for the early-time slope of the afterglow light curve (Price et al. 2002; Garnavich et al. 2003). This again points to a change in the fading behavior of the afterglow between about 0.4 and 2 days after the burst. Moreover, our deduced for the early-time slope of the afterglow light curve is fully consistent with the result obtained by Price et al. (2002) and Garnavich et al. (2003) based on their optical/NIR data. In fact, when we fit their data we confirm that they do not show evidence for a break in the light curve. We attribute this to the lack of data around day. This makes us confident that the break in the light curve which we deduce based on our observations is a real effect.
In Tab. 6 we list the predicted spectral slope corresponding to the measured ’s for various afterglow scenarios. Basically, we have to decide here between an ISM and a wind model for a jetted explosion and to constrain the position of the cooling break frequency in the spectral energy distribution (SED) of the afterglow light at the time of the observation. From the comparisons of the predicted , based on the theoretical relations, with the observed one on 22 November 2001, 3:30 UT, and on 24 November 2001, 7:00 UT, we conclude (see also Fig. 15):
-
1.
The model predictions agree best with the observations for the wind scenario. In this model, the presence of a late “bump” is the natural consequence of the supernova following the stage of rapid mass loss in a massive progenitor star.
-
2.
The data favor the interpretation that during our observations the cooling break frequency , which separates the contribution of fast-cooling electrons from slow-cooling electrons in the afterglow light (see Sari et al. 1998 for their original definition), was above the optical/NIR bands ( Hz). This is in agreement with the conclusions drawn by Price et al. (2002) based on their observational data; we refer the reader to this publication for a further discussion of this point.
-
3.
The power-law index of the electron energy distribution, was close to the expectations from particle acceleration in relativistic shocks (e.g., Sari et al. 1999).
Within our measurement errors, there is no need for an additional extinction by dust in the GRB host galaxy. A wavelength-dependent extinction by cosmic dust in the GRB host galaxy would tend to increase , i.e., redden the afterglow light. For example, this was observed in the optical/near-infrared afterglow of GRB 000418 (Klose et al. 2000). The low value of we and others (Garnavich et al. 2003; Price et al. 2002) find for the afterglow of GRB 011121 however, after correction for the influence of reddening by Galactic dust, compared with various model predictions based on the observed light curve shape (Tab. 6), gives us no strong hint for an additional dust component acting along the line of sight. Grey dust in the GRB host galaxy could still be there (wavelength-independent scattering cross section in the considered photometric bands), but this cannot be deduced from our data.
On the other hand, one should be aware of the fact that the results obtained are sensitive to the adopted Galactic extinction, (Gal), along the line of sight. For example, if we had used (Gal) = 0.9 mag, as it suggested by the H I maps (§ 3.2), then the extinction corrected for the intrinsic optical afterglow would have been 1.1, based on our measured color of the optical transient on 22 November 2001, 3:30 UT. We favor the higher extinction value (1.4 mag), however. The early multi-color observations of the GRB afterglow by Garnavich et al. (2002) give a best fit for the Galactic reddening along the line of sight of mag. For a standard ratio of total-to-selective extinction of 3.1, this is basically consistent with our chosen value for (Gal). We note also that an adopted extinction of (Gal) = 1.4 mag is still consistent with the result deduced by Price et al. (2001) within their claimed 1 error bar ((Gal) = 1.16 0.25 mag).
| afterglow model | predicted | electron | |
|---|---|---|---|
| ISM, iso, case 1 | 1.410.26 | 0.52 | |
| ISM, iso, case 2 | 1.080.26 | 0.52 | |
| ISM, jet, case 1 | 1.220.17 | 0.34 | |
| ISM, jet, case 2 | 0.720.17 | 0.34 | |
| wind, iso, case 1 | 1.410.26 | 0.52 | |
| wind, iso, case 2 | (2)/3 | 0.750.26 | 0.52 |
| wind, jet, case 1 | 1.220.17 | 0.34 | |
| wind, jet, case 2 | 0.720.17 | 0.34 |
We note that the observed change in the decay slope of the light curve around the break time is in agreement with the predictions of the jet-wind model, provided that the steepening of the light curve is due to the sideways expansion of the jet (Rhoads 1999).
It has been argued (Kumar & Panaitescu 2000) that for an external density profile as the jet break in the light curve is expected to be very gradual, taking at least two decades in time before most of the steepening sets in. In the case of GRB 011121, the break in the light curve is certainly shallower, extending no more than one decade in time (even with fits using =1 the “break” extends only from 0.5–2.5 days, still less than a decade). While this may be considered a problem, more extensive considerations have shown a large diversity of light curve shapes, depending not only on the density profile but also on the evolution of the Lorentz factor, whether jets are uniform or non-uniform, and the difference of viewing and jet angle (e.g., Wei & Jin 2003).
4.2 The supernova and the wind signature
4.2.1 Supernova features
The light curve of GRB 011121 provides the clearest case to date for excess emission above the usual power law extrapolation. The excess in this case appears to become significant about one week after the burst (Fig. 9). This feature has been heralded as strong evidence for a supernova component (Bloom et al. 2002; Dado et al. 2002b; Garnavich et al. 2003; Price et al. 2002). Garnavich et al. (2003) proposed the supernova label SN 2001ke for this afterglow, although no obvious supernova features were apparent in their Magellan/LDSS2 spectrum obtained on Dec 7, 2001. While it is far from proven that the late emission observed in GRB 011121 is in fact due to a supernova, this interpretation is most natural. If we believe the SN-bump picture, the observations of Garnavich et al. (2003) provide a stern warning: SN1998bw (used in our analysis) may not be appropriate as a “template” for SN-light associated with gamma-ray bursts. Given that to date we have a rather limited sample of supernovae associated with GRBs (see the recent review by Weiler et al. 2002), we are limited in what we can conclude from the bump in the afterglow of GRB 011121, except that it is obvious that the simple afterglow model is unable to explain features like these. Shock rejuvenation and inhomogeneities in the GRB environment or energy injection can explain the kind of bumpy afterglow observed in the case of GRB 021004 (e.g., Lazzati et al. 2002, Holland et al. 2003), but does not account for the long-term (weeks), sustained bump observed in GRB 011121. Supernovae, on the other hand, provide a natural explanation for the energy and also the time scale involved in the late bump we are considering here.
During the maximum of the SN bump (Fig. 13), the observed brightnesses of the afterglow are = 22.80.1, = 23.40.1, and = 22.80.1. This is about 3.6 mag, 3.3 mag, and 3.7 mag fainter than the total light of the host galaxy (see below). Although not all of the host was covered by the slit, the host galaxy still dominated the collected light – even for the spectrum taken on 12 December 2001, around the maximum of the bump. Thus, the lack of any supernova signature in the spectrum is no argument against the supernova interpretation of the bump (Fig. 11), as pointed out by Garnavich et al. (2003).
The extinction-corrected (§3.2) absolute magnitudes for the supernova with a -correction in the bands of 0.85 mag (Leibundgut 1990), 0.55 mag and zero, respectively, are = –19.18, = –19.79, and = –19.83. Comparison with the absolute magnitudes of SN 1998bw suggest that the supernova in GRB 011121 is slightly brighter in the band, but fainter at longer wavelengths.
4.2.2 The GRB-supernova connection
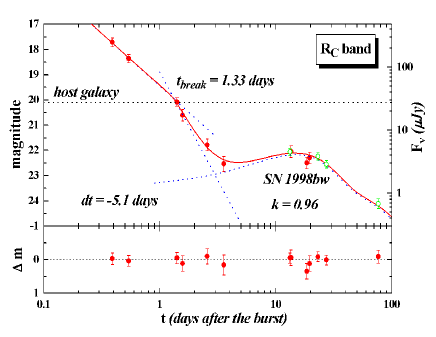
While we use SN 1998bw as a template supernova, we added one degree of freedom to the fitting procedure by allowing for a shift of the observed SN maximum () with respect to the predicted one for a redshifted SN 1998bw (), i.e.
| (2) |
With this extra degree of freedom added, the best fit parameters become: days, , and days with /d.o.f. = 0.74. As before, the parameter was fixed at = 10 (Figs. 12, 13). The fact that is less-well determined when we include the data points obtained after day 10 is not surprising. It is basically due to the lack of data between day 4 and 10 combined with the early and rapidly dominating SN component that makes the error of the deduced relatively large. This is also the reason why in Tab. 6, where we discuss the appropriate afterglow model, we used the fitting results obtained for those data when the SN component is still negligible.
The fit improves after inclusion of published late-time HST data (Bloom et al. 2002). With these additional data we find for the -band light curve: days, , and days with /d.o.f. = 0.60 (Figs. 14). Finally, if we follow section 3.2.1 and include the transformed -band data point and the early-time data from Garnavich et al (2003) we get basically the same result with slightly reduced error bars for and .
It was already previously noted (Bloom et al. 2002) that a negative time delay (Eq. 2) of order of a few days provides a better fit to the data than setting days, i.e. GRB and SN start at the same time. Basically, two scenarios could explain such a delay. First, this phenomenon could be intrinsic to the ejected supernova shell itself in the sense that light curve shapes of type Ibc/II supernovae are a function of the mass of the progenitor and other details of the explosion (as already remarked by Bloom et al. 2002). The more exciting alternative is that this delay could point to a genuine time delay between the supernova explosion (formation of a neutron star) and the GRB (interpreted as the subsequent formation of a black hole; see Vietri & Stella 2000). It is tempting to use the negative delay found in our fitting procedure as an argument in support of the supranova model (Vietri & Stella 2000). However, it is worth to remember that the supranova model requires a delay between the supernova and the GRB of many weeks to months (Vietri & Stella 2000), not days. If this delay is shortened, then the original goal of the model, namely to explain the long-lived iron lines, is dismissed. Much better data on both the GRB afterglow and the SN light curve are required to establish the reality of such an offset. GRB 011121 has not been sampled enough to allow rigorous statements about the temporal relationship between SN and GRB, and the use of SN1998bw as a template is also a rather unreliable assumption of our modeling, as pointed out above, and further discussed below.
4.2.3 Alternative explanations for extra light
We note that there are three observational details that do not fit the generally used template SN 1998bw:
-
1.
Rapid intensity decay: The -band flux on 9 February 2002 is far below the prediction of SN 1998bw. While there exist supernovae with rapidly decaying light curves, this faster decline applies only for times days. These supernovae are thought to possibly produce less Ni, but more Ti. In the case of GRB 011121, the observed faster decay happened within less than 60 days after the maximum, and thus cannot be explained with a low Ni production.
-
2.
Atypical color evolution: SN decay slower at longer wavelength, e.g., SN 1998bw or SN 2002ap. The light curve of GRB 011121 shows that the brightness decay in the band is very rapid. Moreover, the HST data demonstrate that the decay in the band is not only slower than that in the band, but also the -band decay is slower than the -band decay. Thus, in GRB 011121 the color dependence is just inverted relative to a supernova: the longer the wavelength, the faster the decay.
-
3.
Different spectral energy distribution: The excess light in GRB 011121 is substantially bluer than that of SN 1998bw, as already noted by Garnavich et al. (2003). This is most easily recognized in the different values for the different filters: while for the band (see previous section; excluding the HST data), we find in the band and in the band.
We investigated the alternative to the supernova interpretation, namely a dust echo due to scattered light (Esin & Blandford 2000; Waxman & Draine 2000; Reichart 2001). In the absence of extinction within the host galaxy, as in the case of GRB 011121, the dust echo is expected to be bluer than prescattered light, just as observed. This would suggest that a thermal dust echo is clearly ruled out since it would peak in the near-infrared band (Reichart 2001). However, in the dust echo scenario there seems to be a severe problem with the temporal evolution. Dust echoes due to scattered light do not peak as sharply as thermal dust echoes or supernovae (Reichart 2001). The time dependence comes from the angular dependence of the escape probability of the scattered photons. Using the values of the differential escape probability as presented by Esin & Blandford (2000), we find that the inferred temporal decay should be much smaller than the observed decay rate after the bump maximum. Other alternatives are neutrons in the blast wave (Beloborodov et al. 2003), the scenario of a refreshed relativistic shock in the GRB outflow caused by the wind profile of the GRB progenitor (Ramirez-Ruiz et al. 2001), the shell collision model (Kumar & Piran 2000) or continuous injection (Björnsson et al. 2002). However, these scenarios are not yet detailed enough to be tested against observational data.
4.3 The break in the light curve
One might be concerned that the break in the R band light curve happens at an intensity level which just corresponds to the R band brightness of the host. However, this is chance coincidence, and only applies to the band. There are three arguments in favor of the break being unaffected by the host brightness: (1) A subtraction of a constant flux could potentially produce a jump in the light curve, but no break with increasing deviation at later times. (2) The R band brightness of the host is the brightness integrated over the area of the host. In contrast, the additional flux which the host would add to the PSF area of the afterglow is at least a factor of 4 smaller. Thus, if the break would have been “produced” by a wrong host subtraction, it would occur at a level nearly 2 magnitudes fainter. (3) The brightness of the host is different in different filter bands ( mag). This color is different than that of the afterglow ( mag; both values not corrected for extinction). Yet, the break is found at the same time in all filter bands, irrespective of the relative brightness of the host to the afterglow.
The break time we deduce has an 1 error of 0.5 days so that one might tentatively conclude that any break occurred between about 1 and 2 days after the burst. Whereas a break at very early times ( day) is excluded by the data obtained by Price et al. (2002) and Garnavich et al. (2003), a break at days could be hidden by the bright SN component. The following discussion relies on the deduced break time of 1.3 days.
According to Livio & Waxman (2000), for a jetted explosion into a wind-blown surroundings with an gas density profile it is
| (3) |
where is the mass loss rate of the star in units of M⊙ yr-1, is the wind velocity in units of km s-1 and is the isotropic equivalent energy of the fireball in units of erg. We introduced a factor in order to correct for the redshift. Using =0.36, =0.27 and assuming we obtain . This corresponds to a beaming factor () of about 100.
Usually it is assumed that can be approximated by the isotropic equivalent energy release in the gamma-ray band during the burst phase. According to Garnavich et al. (2003), for GRB 011121 it was erg (see also §3.4). After correcting for the beaming factor this gives an energy release of about erg, in agreement with the typical energy releases of GRBs (Frail et al. 2001).
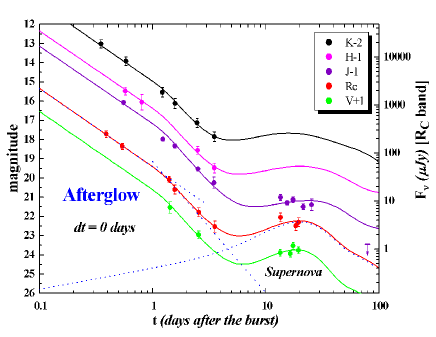
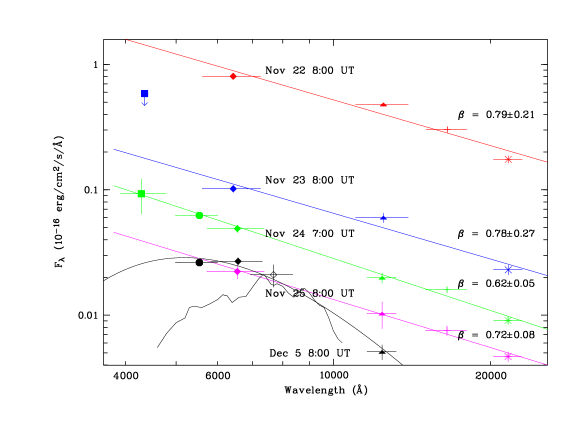
Given the many multi-filter observations during the first 4 days (Tab. 1), we have constructed broad-band spectra from the optical to the near-infrared region. These are shown in Fig. 15 with a separation of about 24 hrs between each other. The spectral energy distributions of the first four days are consistent with a power-law. This suggests that the break in the light curve was achromatic, in agreement with the predictions of the jet model. We note in passing that we do not see to evolve towards an asymptotic value of 1.1 as has been argued by Dado et al. (2002b) and assumed for the cannonball interpretation of the GRB 011121 afterglow light curve.
4.4 The host galaxy
4.4.1 Morphology
Images in , and show that the host galaxy starts affecting the brightness estimate of the afterglow already after November 24, 2001. We have therefore taken the -band image from February 9 to model the shape and intensity distribution of the host galaxy in order to subtract the host flux from the earlier images. The February 9 exposure consists of two sub-exposures, each with 30 min exposure time, and taken at a mean seeing of 045 and 055, respectively. We used the 045 part and modelled the host galaxy using a bulge component
| (4) |
and a disk component
| (5) |
For each of these two components, the four parameters , (), effective radius , position angle (PA) and eccentricity () are derived using the IRAF/SPP package GIM2D (Simard 1998). The resulting fit parameters are:
-
•
Bulge component: = 14.78 mag/arcsec2, = 5.0 pixel, = 0.19, PA = –41∘
-
•
Disk component: = 22.18 mag/arcsec2, = 19.5 pixel, = 0.19, PA = –46∘ .
The eccentricity derived from the galaxy profile in the band corresponds to an inclination of 10 degrees.
The fit to the radial profile is given in Fig. 16. To subtract the host galaxy emission from the images taken in November/December 2001, this model of the host galaxy was convolved with the corresponding seeing of each image, and then subtracted. For filters other than , the total brightness of the model was modified to achieve good subtraction in the corresponding band, i.e. the normalization was varied to minimize the residuals. Aperture photometry on the subtracted images was then applied to obtain the magnitudes of the afterglow (see Tab. 1 and Fig. 9).
Using the model parameters given above, and integrating over the galaxy, we obtain the following apparent magnitudes of the host galaxy: = 19.10.1, = 20.10.1, and = 20.40.1.
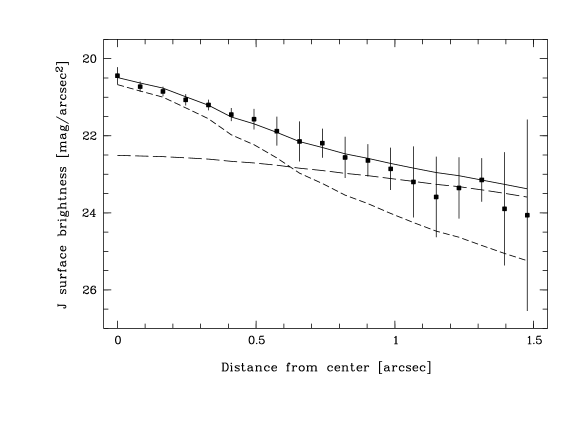
The decomposition of the surface brightness profile of the galaxy into a disk and a bulge component shows that the bulge dominates within the inner 05 only. The bulge contributes about 22% to the total light. This can be interpreted as a Sbc morphological type. The observed brightnesses of the host galaxy in the , and band correspond, after correction for foreground absorption and applying the -correction, to absolute magnitudes of –22.580.53, –22.240.24, and –22.090.25, respectively. This is at the very bright end of the range populated by spirals (e.g., Binggeli et al. 1988); the host galaxy of GRB 011121 is thus among the brightest 5% Sbc galaxies.
The gamma-ray burst happened at an offset of 09 from the center of the host galaxy (as measured on a VLT image taken at 06 seeing), corresponding to a physical distance of 9 kpc (see also Ryder et al. 2001). The above derived disk radius is = 29 kpc. This offset location of the gamma-ray burst with its supernova is consistent with the general supernova picture, as well as with offsets found for earlier GRBs (Bloom et al. 2002).
4.4.2 The star-formation rate
Using the extinction corrected line fluxes of [O II] and H (Tab. 3.3) and the relations given by Kennicutt (1998), i.e. SFR (/yr) = 1.410-41 L(OII) and SFR (/yr) = 7.910-42 L(H), we deduce a star formation rate of 1.2 M⊙/yr and 0.72/0.61 M⊙/yr, respectively. In contrast, Subrahmanyan et al. (2001) derive a star-formation rate of 13–70 M⊙/yr from their radio detection of the host galaxy at 0.05 mJy and assuming a spectral slope of –0.5 between 1.4 and 8.5 GHz. The rate derived here is at the low end of the range found previously in GRB host galaxies. However, also for these earlier cases different results are obtained for different methods/lines, in particular also a large difference between radio- vs. optically-based data (Vreeswijk et al. 2001).
We have no explanation for the fact that the host galaxy appears to be among the brightest 5% Sbc galaxies, and yet the derived star-formation rate is rather low. Also, the lack of clear evidence for dust in the GRB host along the line of sight is somewhat surprising in the supernova picture, though there is also no strong intrinsic extinction in most previous GRB hosts.
5 Concluding remarks
While our and values are consistent within the errors with those reported by Garnavich et al. (2003) and Price et al. (2002), the change in our values due to the discovery of the break and the evolution during the four days after the GRB leads to a preference of the jet-wind model. The observed break and its interpretation is in contradiction with the interpretation of the radio data by Price et al. (2002) suggesting a break at times later than 8 days after the GRB. We cannot offer a solution to this problem, as the break is observationally evident from a dozen of data points spread over several filter bands.
Our observations reveal a light curve break at early times and the appearance of extra light at late times. The former is believed to be evidence for a collimated outflow (a fireball jet), whereas the latter could be due to supernova light. Finally, the -relations favor a wind model (Table 6). The afterglow of GRB 011121 thus provides another case in support of the current standard paradigm of long-duration gamma-ray bursts: the collapsar model (Woosley 1993, Hartmann & Woosley 1995) in which the birth of a black hole inside a rapidly rotating massive star is announced via jet formation, breakout, and propagation into a stellar environment that was shaped by the strong winds of the pre-collapse star. In fact, GRB 011121 is the first case, where all three signatures (jet break, wind density profile and supernova bump) have been found, while in earlier cases only two of these three ingredients could be found (e.g., Jaunsen et al. 2001). However, even with GRB 011121 this line of reasoning remains circumstantial, and many more afterglows have to be observed, and better sampled than is presently the case, to seriously establish the GRB-collapsar picture.
6 Acknowledgments
We are highly indebted to the ESO staff, in particular N. Ageorges, S. Bagnulo, H. Böhnhardt, V. Doublier, O.R. Hainaut, S. Hubrig, A.O. Jaunsen, E. Jehin, R. Johnson, A. Kaufer, M. Kürster, E. Mason, E. Pompei, Th. Szeifert for prompt execution of the observing requests and all the additional effort related to that. We thank the anonymous referee for the extensive comments on the original version of this paper. J. Gorosabel acknowledges the receipt of a Marie Curie Research Grant from the European Commission, and J.M. Castro Cerón the receipt of a FPI doctoral fellowship from Spain’s Ministerio de Ciencia y Tecnología. This work was supported by the Danish Natural Science Research Council (SNF), by “IUAP P5/36” Interuniversity Attraction Poles Programme of the Belgian Federal Office for Scientific, Technical and Cultural Affairs, and the Belgian Fund for Scientific Research (FWO). This research has made use of the USNOFS Image and Catalogue Archive operated by the United States Naval Observatory, Flagstaff Station (http://www.nofs.navy.mil/data/fchpix/).
References
- (1) Andersen M.I., Hjorth J., Pedersen H., Jensen B.L., Hunt L.K., et al. 2000, A&A 364, L54
- (2) Beloborodov A.M., 2003, ApJ 585, L19
- (3) Benetti S. et al. 1999, MN 305, 811
- (4) Bertin E., Arnouts S. 1996, A&AS 117, 393
- (5) Beuermann K. et al. 1999, A&A 352, L26
- (6) Binggeli B., Sandage A.R., Tammann G.A., 1988, ARAA 26, 509,
- (7) Björnsson G., Hjorth J., Jakobsson P., Christensen L., Holland S., 2001, ApJ 552, L121
- (8) Björnsson G., et al. 2002, ApJ 579, L59
- (9) Bloom J.S., et al. 1999, Nat 401, 453
- (10) Bloom J.S., Kulkarni S.R., Price P.A., et al., 2002, ApJ 572, L45
- (11) Bloom J.S., Kulkarni S.R., Djorgovski S.G., 2002, AJ 123, 1111
- (12) Brown M., Schommer R., Olsen K., Jannuzi B., Dey A., Fruchter A., Rhoads J., 2001, GCN 1158
- (13) Cardelly J.A., Clayton G.C. & Mathis J.S., 1989, ApJ 345, 245
- (14) Castro-Tirado A.J., Gorosabel J., 1999, A&AS 138, 449
- (15) Castro-Tirado A.J., Sokolov V.V., Gorosabel J., et al. 2001, A&A 370, 398
- (16) Chevalier R.A., Li Z.-Y, 2000, ApJ 536, 195
- (17) Dado S., Dar A., De Rujula A., 2002a, A&A 388, 1079
- (18) Dado S., Dar A., De Rujula A., 2002b, ApJ 572, L143
- (19) de Jong R.S., 1996, A&A 313, 45
- (20) Devillard N., 2002, Eclipse Users Guide, at URL www.eso.org/projects/aot/eclipse/eug/eug/eug.html
- (21) Dickey J.M., Lockman F.J., 1990, ARAA 28, 215
- (22) Drory N., 2003, A&A 397, 371
- (23) Esin A. A., Blandford R., 2000, ApJ 534, L151
- (24) Frail, D. A. et al. 2001, ApJ 562, L55
- (25) Fryer C.L., Woosley S.E., Hartmann D.H., 1999, ApJ 526, 152
- (26) Galama, T. J. et al. 1998, Nature 395, 670
- (27) Galama, T. J. et al. 2000, ApJ 536, 185
- (28) Garnavich P.M., Holland S.T., Jha S., et al., 2001, GCN 1273
- (29) Garnavich P.M., Stanek K.Z., Wyrzykowski L., et al., 2003, ApJ 582, 924
- (30) Greiner J., Klose S., Zeh A., Lamer G., Scholz R.D., et al., 2001, GCN 1166
- (31) Hartmann D.H., Woosley S.E., 1995, Adv. Space Res. 15(5), 143
- (32) Heger A., Fryer C.L., Woosley S.E., Langer N., Hartmann D.H., 2003, ApJ (subm., astro-ph/0212469)
- (33) Hjorth J., Sollermann J., Moller P., et al. 2003, Nat. 423, 847
- (34) Holland S.T., Fynbo J.P.U., Hjorth J., Gorosabel J., Pedersen H. et al., 2001, A&A 371, 52
- (35) Holland S.T., Weidinger M., Fynbo J.P.U., Gorosabel J., Hjorth J., Pedersen K., 2003, AJ (subm; astro-ph/0211094)
- (36) Hurley K., Cline T., Guidorzi C., Montanari E., Frontera F., Feroci M., 2001, GCN 1148
- (37) Hurley K., Cline T., Mitrofanov I., Anfimov D., Kozyrev A. et al. 2002, GCN 1372
- (38) Infante L., Garnavich P.M., Stanek K.Z., Wyrzykowski L., 2001, GCN 1152
- (39) Jaunsen, A.O., Hjorth J., Björnsson G., et al. 2001, ApJ, 546, 127
- (40) Kennicutt R.C., 1998, ARAA 36, 189
- (41) Klose S., Stecklum B., Masetti N., et al. 2000, ApJ 545, 271
- (42) Kumar P., Piran T., 2000, ApJ 532, 286
- (43) Kumar P., Panaitescu, A. 2000, ApJ 541, L9
- (44) Landecker, T. L. et al. 1999, APJ 527, 866
- (45) Lazzati D., Covino S., Ghisellini G., Fugazza D., Campana S., et al. 2001, A&A 378, 996
- (46) Lazzati D., Rossi E., Covino S., Ghisellini G., Malesani D., 2002, A&A 396, L5
- (47) Livio, M., & Waxman, E. 2000, ApJ, 538, 187
- (48) Masetti N., Palazzi E., Pian E., et al. 2003, A&A 404, 465
- (49) Mészáros P., Rees M.J. & Wijers R.A.M.J. 1998, ApJ 499, 301
- (50) Mészáros P., 2002, ARA&A 40, 137
- (51) Mitrofanov I., et al. 2003 (in prep)
- (52) Patat F., Cappellaro E., Danziger J., et al. 2001, ApJ 555, 900
- (53) Phillips M.M., Krisciunas K., Garnavich P.M., Holland S., Jha S., Stanek K.Z., McCarthy P., 2001, GCN 1164
- (54) Piro L., 2001a, GCN 1147
- (55) Piro L., 2001b, GCN 1149
- (56) Piro L., Soffitta P., Antonelli L.A., in’t Zand J., Heise J., et al. 2001, GCN 1172
- (57) Predehl P., Schmitt J.H.M.M., 1995, A&A 293, 889
- (58) Price P.A., McCarthy P., Fox D.W., Koviak K., Bloom J.S., 2001, GCN 1153
- (59) Price P.A., Berger E., Reichart D.E., et al., 2002, ApJ 572, L51
- (60) Ramirez-Ruiz E., et al. 2001, MN 327, 829
- (61) Reichart D.E., 2001, ApJ 554, 643
- (62) Rhoads, J. 1999, ApJ 525, 737
- (63) Rhoads J.E. & Fruchter A.S., 2001, ApJ 546, 117
- (64) Rieke, G.H., Lebofsky, M.J. 1985, ApJ 288, 618
- (65) Ryder S., Gunn K., Seymour N., Price P.A., Schmidt B.P., Axelrod T.S., 2001, GCN 1163
- (66) Sari R., Piran T., Narayan R., 1998, ApJ 497, L17
- (67) Sari, R., Piran, T., Halpern, R. 1999, ApJ 519, L17
- (68) Schlegel, D., Finkbeiner, D., Davis, M. 1998, ApJ 500, 525
- (69) Simard L., 1998, in Astronomical Data Analysis Software and Systems VII, ASP Conf. Ser. 145, eds. R. Albrecht, R.N. Hook and H.A. Bushouse, p. 108
- (70) Stanek K.Z., Wyrzykowski L., 2001, GCN 1160
- (71) Subrahmanyan R., Kulkarni S.R., Berger E., Frail D.A., 2001, GCN 1156
- (72) Tinney C., Stathakis R., Cannon R., Galama T., 1998, IAU Circ. 6896
- (73) van Paradijs J., Groot P.J., Galama, T., et al., 1997, Nature 386, 686
- (74) van Paradijs J., Kouveliotou C., Wijers R., 2000, ARAA 38, 379
- (75) Vietri M., Stella M., 1998, ApJ 507, L45
- (76) Vietri M., Stella M., 2000, ApJ 527, L43
- (77) Vreeswijk P.M., Fender R.P., Garrett M.A., Tingay S.J., Fruchter A.S., Kaper L., 2001, A&A 380, L21
- (78) Waxman E., Draine B.T., 2000, ApJ 537, 796
- (79) Wei D.M., Jin Z.P., 2003, A&A 400, 415
- (80) Weiler K.W., Panagia N., Montes M., Sramek, R. A. 2002, ARAA 40, 387
- (81) Woosley S.E., 1993, ApJ 405, 273
- (82) Wyrzykowski L., Stanek K.Z., 2001, GCN 1154
- (83) Wyrzykowski L., Stanek K.Z., Garnavich P.M., 2001, GCN 1150
- (84) Zeh A., Klose S., Henden A., Greiner J., 2003, GCN 2115
- (85) Zeh A., Klose S., 2003, ApJ (submitted)