Sunyaev-Zel’dovich Effects from Quasars in Galaxies and Groups
Abstract
The energy fed by active galactic nuclei to the surrounding diffuse baryons changes their amount, temperature, and distribution; so in groups and in member galaxies it affects the X-ray luminosity and also the Sunyaev-Zel’dovich effect. Here we compute how the latter is enhanced by the transient blastwave driven by an active quasar, and is depressed when the equilibrium is recovered with a depleted density. We constrain such depressions and enhancements with the masses of relic black holes in galaxies and the X-ray luminosities in groups. We discuss how all these linked observables can tell the quasar contribution to the thermal history of the baryons pervading galaxies and groups.
Subject headings:
cosmic microwave background - galaxies: clusters: general - quasars: general1. Introduction
The thermal energy content of the hot interstellar (ISM) or the intracluster medium (ICM) pervading galaxies or their groups and clusters can be probed with the Sunyaev-Zel’dovich (1980, SZ) effect. This arises when the hot electrons Compton upscatter some of the CMB photons crossing the structure; then the black body spectrum is tilted toward higher frequencies.
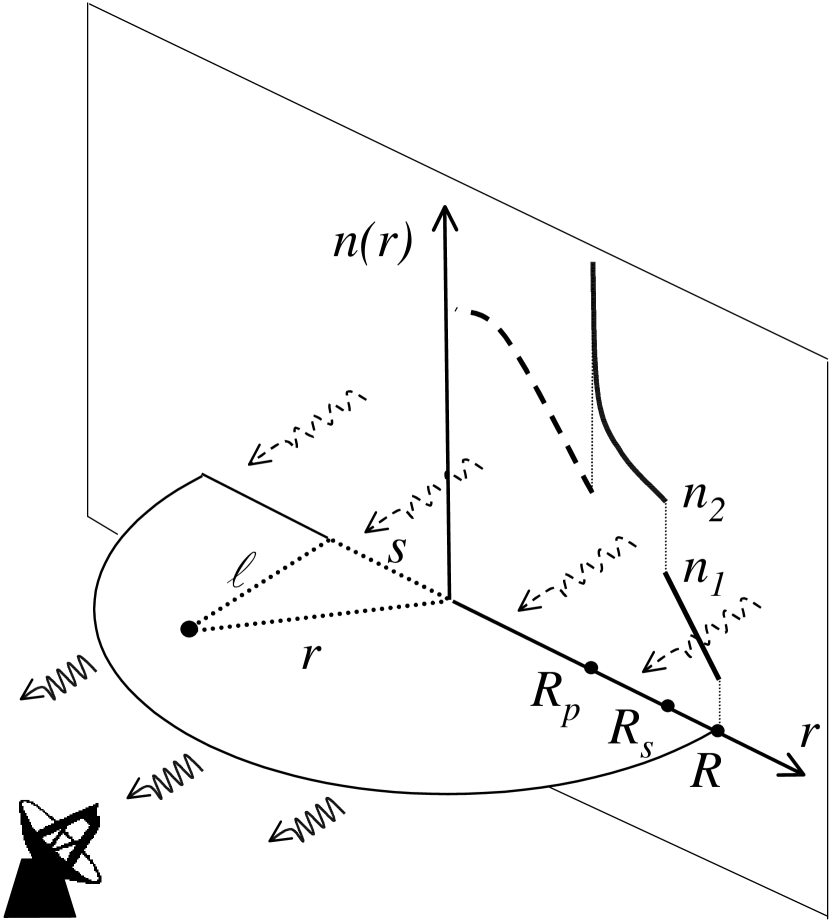
In the wave band the tilt mimics a diminution K of the CMB temperature, proportional to the Comptonization parameter . This is evenly contributed by the electron density and the temperature ; in fact, what matters is the electron pressure integrated along a line of sight (see Fig. 1):
| (1) |
To now, SZ signals have been measured in many rich clusters at levels or mK (see Rephaeli 1995; Birkinshaw 1999; Zhang & Wu 2000; Reese et al. 2002). These levels are consistent with ICM temperatures keV, sizes of a few Mpcs, and central densities cm-3. Similar values are indicated by the standard cluster view based on gravitational potential wells of virial depth dominated by the mass of the dark matter (DM). In such wells ICM masses are settled in hydrostatic equilibrium at specific energies .
The above values also fit in with the X-ray luminosities ergs s-1 emitted through thermal bremsstrahlung by the ICM. Groups, on the other hand, are underluminous relative to clusters; they emit far less than the baseline level scaled at constant after the DM rules. The observed correlation is clearly steeper, and goes from in clusters to or in poor groups, albeit with a wide variance (O’Sullivan, Ponman & Collins 2003). In other words, the ICM in groups appears to be underdense compared to clusters.
The origin of such lower densities is currently debated. One view centers on extensive radiative cooling (Bryan 2000) which would remove much low entropy gas. An alternative line of explanations (see Cavaliere, Lapi & Menci 2002, CLM02; and refs. therein) focuses on the energy injections affecting the ICM equilibrium while the DM is hierarchically accrued over dynamical timescales . The inputs are provided when the baryons in galaxies condense to form stars possibly in starbursts, which then explode as SNe; alternatively or correlatedly (Menci et al. 2003, in prep.), the baryons accrete onto supermassive black holes (BHs) energizing active galactic nuclei (AGNs). Such feedback actions deplete the ICM density in the shallower potential wells by causing from inside thermal outflow and dynamical blowout; they also preheat the gas exterior to the newly forming structures, and so hinder its inflow.
In any case, for groups in equilibrium the values of can be anticipated from the continuum through the model-independent relation (Cavaliere & Menci 2001)
| (2) |
Here is the baseline value scaled to the formation redshift (Cole & Kaiser 1988). So for groups where holds we expect depressed .
Are enhanced SZ effects also possible, or even likely? What can these tell about the processes affecting and in groups and galaxies? Here we propose that a specific answer will come from SZ observations.
2. The transient regime
We start from recasting in terms of the gas thermal energy at equilibrium. A small group or an early massive galaxy with their virial temperatures or keV would produce SZ signals or . Larger energies added to the ICM/ISM are expected to enhance the SZ signals yielding .
Such may be the case with the AGNs (see Valageas & Silk 1999; Wu, Fabian & Nulsen 2000; Roychowdhury & Nath 2002) that produce large total outputs, typically around ergs over times around yr comparable to of their host structures. Such outputs can drive a blastwave sweeping out the gas mass and raising its pressure (see Platania et al. 2002; also Yamada & Fujita 2001).
We will see that the blast is constrained by the coupling of the AGN outputs to the surrounding gas, and restrained by the initial pressure and the DM gravity. We describe the blast flow on using the self-similar hydrodynamical solutions presented by CLM02. The simplest one obtains when the energy is delivered over times of order at the center of an isothermal configuration for the DM and for the gas with . Then the leading shock moves out with uniform Mach number , i.e., with radius ; the kinetic, the thermal and the gravitational energies of the perturbed gas all scale like . So we can consistently define inside the total initial energy (modulus); most important, our solutions provide realistic predictions not only for strong blasts but also for the weak ones driven by constrained values of .
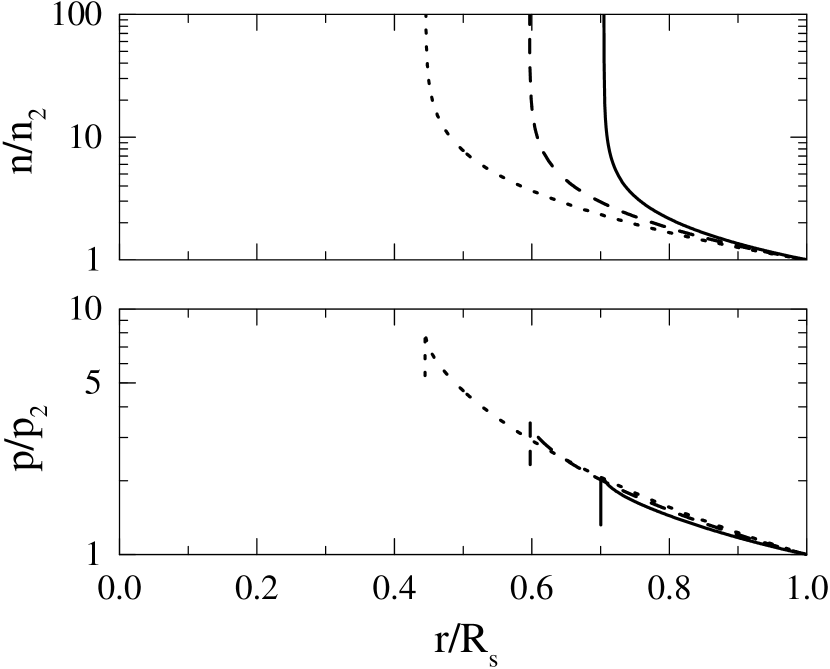
Detailed profiles are presented in Fig. 2. Note that the perturbed flow is confined to a shell; this is bounded by the leading shock at , and by a trailing contact surface (“piston”) located at where the density diverges weakly while the pressure is finite. So the relevant quantities may be also obtained from the simple and precise “shell approximation” (see Ostriker & McKee 1988), which provides the energy balance in the form
| (3) |
Here is the mean pressure within the shell volume , important for the SZ signals; and are the DM and the gas masses within . The Rankine-Hugoniot jump conditions yield the postshock quantities: the velocity , the pressure and the density , given the preshock values , .
As to the energy actually injected over , the paradigm of supermassive BHs for the AGNs implies ergs when the mass is accreted with conversion efficiency of order . The fractional energy coupled to the surrounding gas is poorly known. Including inefficiencies due to low momentum transfer, non-spherical geometries and covering factors it may range from for radio-quiet, to some for strongly absorbed (BAL) or radio-loud quasars, a small minority. Average values are shown below to be consistent with the observations both of the relic BHs in galaxies and of in groups.
The ratio is seen from Eq. (3) to be uniform, and to constitute a key parameter for the shock strength. Table 1 presents quantities relevant to our computations of SZ signals.
We have extended our basic solution to initial density runs , with . Then the initial temperature declines as , and the shock decelerates as , again under self-similarity; this also implies declining source luminosities with . Table 1 shows that larger yields somewhat higher and at given .
3. Transient and equilibrium SZ effects
In computing how is enhanced during the blast transit, we focus on averaged over the structure area, which will subtend small angles for an early group or galaxy. Normalizing the shock position as , we find the full signal
| (4) |
in terms of . The last approximation applies for , which maximizes the transit time in the structure and optimizes the observability.
Strong SZ signals are seen from Eq. (4) and Table 1 to require substantial blasts driven through the ISM or the ICM, i.e., input competing with the equilibrium value . For the latter writes ergs; so the ratio reads
| (5) |
Here is the mass accreted within by the central BH in a massive galaxy, or by the sum of BHs shining within a group. Eq. (5) yields close to for a poor group with keV and . In going toward local, rich clusters clearly lags behind , so will decrease strongly, see CLM02 for details.
At the other end, toward galaxies is constrained not to exceed a few, lest the gas contained within kpcs and the accretion it feeds are cut down (see Silk & Rees 1998). The pivotal value recast in terms of the DM velocity dispersion reads
| (6) |
Converting to the bulge dispersion (see Ferrarese 2002) yields . For values the relation accords with the observations in Tremaine et al. (2002).
| 0.3 | 1.2 | 3.6 | 2.1 | 17.8 |
| 1 | 1.5 | 4.6 | 3.0 | 21.7 |
| 3 | 1.9 | 6.3 | 4.7 | 32.6 |
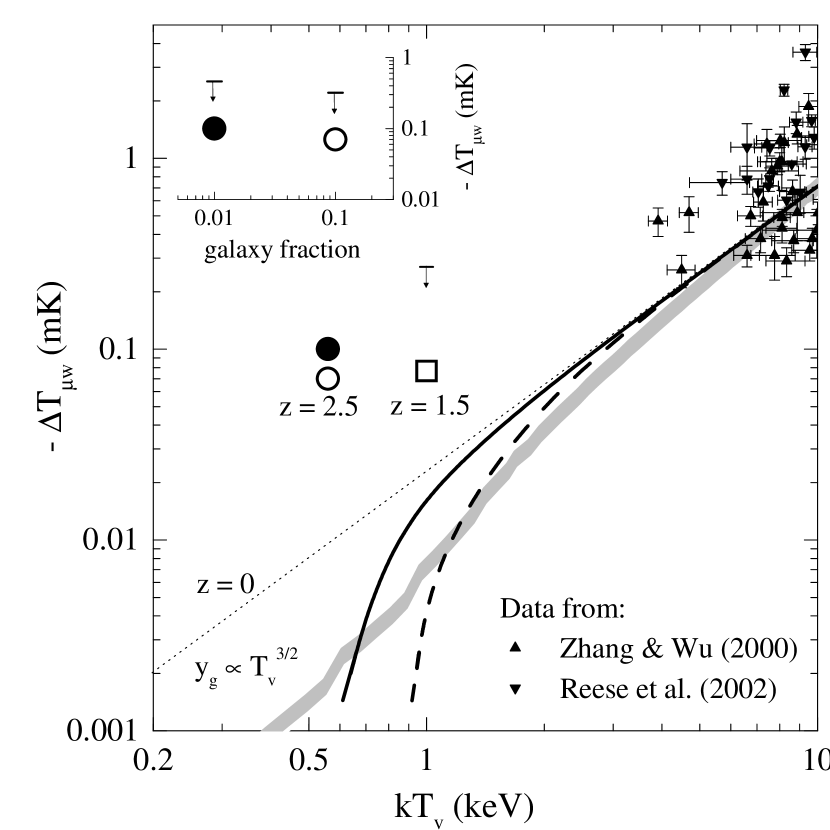
Our results are represented in Fig. 3 vs. the depth of the host potential well. The square illustrates the minimal enhancement we expect from an early group at with keV, and , so with . The bar gives a realistic upper bound for structures with steeper , namely, with ; here is larger but the energy release is more impulsive, resulting (see Table 1) in stronger signals. With radii kpc, the angular sizes are close to their minimum in the concordance cosmology (cf. Bennett et al. 2003). Comparable resolutions will soon be achieved, see § 4.
The circles in Fig. 3 represent our results for a massive ( km s-1, kpc) and still gas-rich () protogalaxy at . The open circle refers to or ; the filled one to or , just compatible with the scatter in the correlation. The related angular sizes are around ; with resolution fixed at , the signals will be diluted after and scaled down to K.
The inset represents the corresponding statistics. This is evaluated on inserting the related blue luminosities and ergs s-1 (with a bolometric correction ) in the quasar luminosity function observed for by Boyle et al. (2000), and discussed by Cavaliere & Vittorini (2000, CV00). In terms of the cumulative fraction of bright galaxies hosting a type 1 quasar brighter than , this reads
| (7) |
beyond the break at ergs s-1. The same luminosity function interpreted in terms of interactions of the host galaxy with its group companions (CV00) yields a few signals per poor groups, with the strength represented by the square in Fig. 3.
After the passage of the blast, the gas recovers hydrostatic equilibrium. This may be described by for a nearly isothermal ICM in the (normalized) DM potential well , see Cavaliere & Fusco-Femiano (1976). The blast heats up the gas so decreasing the value of the parameter , that we reset on using averaged over the mass in the shell. The blast also ejects gas and depletes all densities; we reset by requiring the volume integral of to equal the gas mass left by the blast inside at .
The equilibrium SZ effect is then computed after Eq. (1), and the resulting signals are also plotted in Fig. 3. We recall from CLM02 that the equilibrium also provides good fits to the observed in groups for the same coupling , consistent with Eq. (6).
4. Discussion and Conclusions
This Letter centers on how the SZ effect is affected by the energy fed back by AGNs into the surrounding gas. We predict both transient, enhanced and long-term, depressed SZ signals to be produced by an energy addition to the equilibrium value .
In keV groups the condition holds, and the AGN feedback has a considerable impact. A blast is driven through the gas; during its transit the area-averaged SZ signal is enhanced as the gas is just redistributed while its pressure is raised. But eventually a considerable gas fraction is ejected; so is depleted and is decreased at equilibrium. We have computed these effects under the restraints set to (weak) blast propagation by initial pressure and DM gravity.
The result on the SZ effect is twofold: on scales we predict transient enhancements up to K (a representative example at is given in Fig. 3), followed by long-term depressions. The latter correlate after Eq. (2) with the equilibrium X-ray luminosities which are very depressed.
Larger , yet constrained by Eq. (6), yield stronger SZ enhancements in gas-rich massive protogalaxies with halo radii kpc; representative examples are shown by the circles in Fig. 3. With angular sizes , these may be diluted down to K when observed at a resolution around .
Such resolutions will be achieved by several instruments now being built or designed, enabling “blind” sky surveys for SZ signals to K sensitivities over tens of square degrees (see Carlstrom, Holder & Reese 2002). In particular, promising perspectives are offered by multi-beam, high frequency radio receivers like OCRA (Browne et al. 2000), and also by interferometers equipped with wide-band correlators like ATCA, SZA (Holder et al. 2000), AMI (Jones 2002), and AMiBA (Lo 2002). The SZ signals we consider may contribute equally or more than clusters to the excess power already detected at high multipoles with BIMA (Dawson et al. 2002). In the (sub)millimetric band the SZ signal is positive, and will be accessible to large bolometer arrays like BOLOCAM, whose developments will enable deep, wide surveys (Mauskopf et al. 2002). Eventually, ALMA (http://www.alma.nrao.edu/) will provide in selected areas higher resolution for both sides of the SZ effect.
Enhanced signals as discussed here would constitute signatures of strong feedback caught in the act. This is specific of AGNs, since SNe feed back at most keV/particle (see CLM02); on the other hand, extended cooling which depletes without increasing hardly could enhance . Interlopers might be introduced by merging events; however, these primarily govern the growth of the DM halos and set the virial included in our baseline . Only an exceptional major merging may contribute an energy step sizeable but still bound by . Even this produces transonic inflows in the high- partner gas, originating limited warmer features as picked up by highly resolved X-ray studies of clusters. Still smoother inflows are produced by SN preheating (see Voit et al. 2003), while stronger blasts are driven by AGNs, in the galaxies and groups that we propose here as primarily SZ objects.
Detecting such signals will require surveys over arcmin2 at resolution, based on the conservative surface density of powerful quasars/deg2 consistent with Eq. (7). For groups our evaluations (Fig. 3) lead to SZ enhancements in the range over a depressed if wrinkled landscape. In fact, for keV the baseline is affected mainly by SNe (see Fig. 3); these depress the average levels somewhat, and cause at a relative scatter (at confidence). This landscape may be sampled or bounded from independent groups catalogued at comparable . For massive protogalaxies intrinsically stronger enhancements, less depression and narrower scatter obtain. The candidate peaks are to be followed up with ALMA for higher resolutions; in addition, optical , and optical or X-ray will require current or moderately extrapolated techniques (cf. Rosati, Borgani & Norman 2002; Shields et al. 2003).
In conclusion, we expect that AGN energy outputs around ergs with coupling leave two consistent relics: the depressed X-ray luminosities in local galaxies and groups (see CLM02); the relation on subgalactic scales (Eq. 6). Relatedly, on intermediate scales we evaluate here (Fig. 3) transient SZ signals standing out of a generally depressed landscape. Such signals can provide real time evidence of AGN feedback acting on the diffuse baryons in galaxies and groups. The evidence should be looked for primarily in the SZ surveys that will be soon available.
References
- (1)
- (2) Bennett, C.L., et al. 2003, ApJS, 148, 1
- (3)
- (4) Birkinshaw, M. 1999, Phys. Rept., 310, 97
- (5)
- (6) Boyle, B.J., Shanks, T., Croom, S.M., Smith, R.J., Miller, L., Loaring, N., & Heymans, C. 2000, MNRAS, 317, 1014
- (7)
- (8) Browne, I.W., Mao, S., Wilkinson, P.N., Kus, A.J., Marecki, A., & Birkinshaw, M. 2000, Proc. SPIE 4015, 299
- (9)
- (10) Bryan, G.L. 2000, ApJ, 544, L1
- (11)
- (12) Carlstrom, J.E., Holder, G.P., & Reese, E.D. 2002, ARAA, 40, 643
- (13)
- (14) Cavaliere, A., & Fusco-Femiano, R. 1976, A&A, 49, 137
- (15)
- (16) Cavaliere, A., & Vittorini, V. 2000, ApJ, 543, 599 (CV00)
- (17)
- (18) Cavaliere, A., & Menci, N. 2001, MNRAS, 327, 488
- (19)
- (20) Cavaliere, A., Lapi, A., & Menci, N. 2002, ApJ, 581, L1 (CLM02)
- (21)
- (22) Cole, S., & Kaiser, N. 1988, MNRAS, 233, 637
- (23)
- (24) Dawson, K.S., Holzapfel, W.L., Carlstrom, J.E., Joy, M., & LaRoque, S.J. 2002, AAS Meeting, 201, 59.03
- (25)
- (26) Ferrarese, L., 2002, ApJ, 578, 90
- (27)
- (28) Holder, G.P., Mohr, J.J., Carlstrom, J.E., Evrard, A.E., & Leitch, E.M. 2000, ApJ, 544, 629
- (29)
- (30) Jones, M.E. 2002, ASP Conf. Ser. 257, 35
- (31)
- (32) Lo, K.Y. 2002, ASP Conf. Ser. 257, 3
- (33)
- (34) Mauskopf, P., et al. 2002, AIP Conf. Proc. 616, 107
- (35)
- (36) Ostriker, J.P., & McKee, C.F. 1988, Rev. Mod. Phys., 60, 1
- (37)
- (38) O’Sullivan, S., Ponman, T.J., & Collins, R.S. 2003, MNRAS, 340, 1375
- (39)
- (40) Platania, P.,Burigana, C., De Zotti, G., Lazzaro, E., & Bersanelli, M. 2002, MNRAS, 337, 242
- (41)
- (42) Reese, E.D., Carlstrom, J.E., Joy, M., Mohr, J.J., Grego, L., & Holzapfel, W.L. 2002, ApJ, 581, 53
- (43)
- (44) Rephaeli, Y. 1995, ARAA, 33, 541
- (45)
- (46) Rosati, P., Borgani, S., & Norman, C. 2002, ARAA, 40, 539
- (47)
- (48) Roychowdhury, S., & Nath, B.B. 2002, JAA, 23, 101
- (49)
- (50) Shields, G.A., et al. 2003, ApJ, 583, 124
- (51)
- (52) Silk, J., & Rees, M.J. 1998, A&A, 331, L1
- (53)
- (54) Sunyaev, R.A., & Zel’dovich, Ya.B. 1980, ARAA, 18, 537
- (55)
- (56) Tremaine, S., et al. 2002, ApJ, 574, 740
- (57)
- (58) Valageas, P., & Silk, S. 1999, A&A, 350, 725
- (59)
- (60) Voit, G.M., Balogh, M.L., Bower, R.G., Lacey, C.G., & Bryan, G.L. 2003, ApJ, 593, 272
- (61)
- (62) Wu, K.K.S., Fabian, A.C., & Nulsen, P.E.J. 2000, MNRAS, 318, 889
- (63)
- (64) Yamada, M., & Fujita, Y. 2001, ApJ, 553, L145
- (65)
- (66) Zhang, T., & Wu, X. 2000, ApJ, 545, 141
- (67)