Tracing a Z-track in the M31 X-ray binary RX J0042.6+4115
Four XMM-Newton observations of the core of M31, spaced at 6 month intervals, show that the brightest point X-ray source, RX J0042.6+4115, has a 0.4–10 keV luminosity of 5 1038 erg s-1, and exhibits significant variability in intensity and X-ray spectrum over a time scale of 100 s including hard flares; such behaviour is only observed in Z-sources and transient black hole binaries in our Galaxy. The lightcurves, X-ray spectra and hardness-intensity data from the four XMM-Newton observations all strongly suggest that it is a Z-source, bringing the total number of known Z-sources to nine.
Key Words.:
X-rays: general – Galaxies: individual: M31 – X-rays: binaries1 Introduction
The Andromeda galaxy (M31) is the nearest spiral galaxy, at a distance of 760 kpc (van den Bergh 2000). The X-ray emission from M31 is dominated by point sources. While the study of variability in X-ray sources in external galaxies has been limited by the sensitivity of observatories prior to XMM-Newton, its three large X-ray telescopes can make variability within a single observation visible down to fluxes of 10-14 erg cm-2 s-1 in the 0.3 – 10 keV band (e.g. Jansen et al. 2001), equivalent to luminosities of 1036 erg s-1 in M31. The XMM-Newton observations of M31 have already revealed a persistent, stellar-mass black hole binary (Barnard et al. 2003a, Paper 1), periodic intensity dips in the M31 globular cluster X-ray source Bo158 (Trudolyubov et al. 2002) and pulsations in a white-dwarf transient (Osborne et al. 2001).
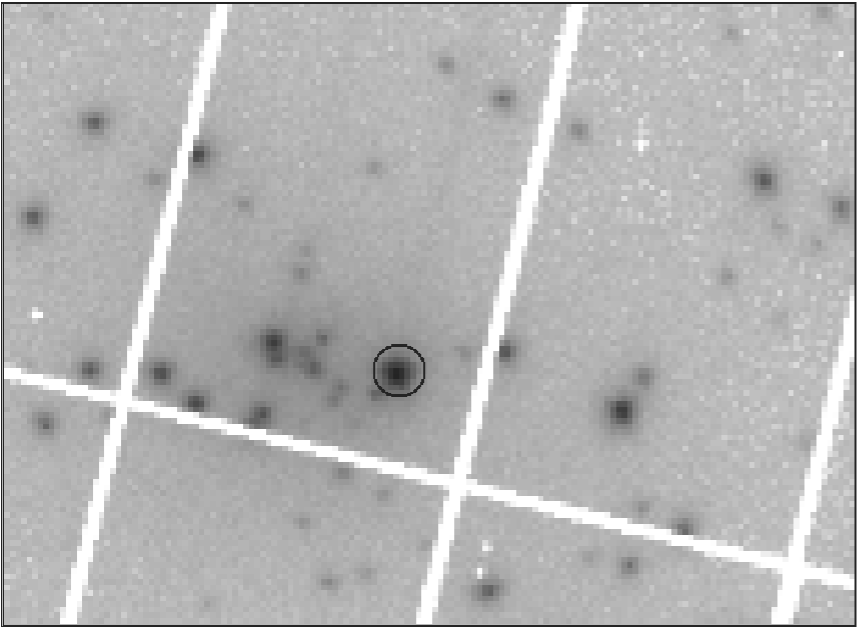
RX J0042.6+4115, the subject of this paper, was discovered in the Einstein survey of Trinchieri & Fabbiano (1991), and was named by Supper et al. (1997), who associated it with a globular cluster. However, its location was more accurately given in a recent Chandra survey (Kong et al. 2002) as 00h 42m 38581 +41 16 0380 with a positional error of 001, and was not associated with any foreground object, globular cluster or background AGN. Kong et al. (2002) found variability in the lightcurves and spectra of RX J0042.6+4115 and report a luminosity in the 0.3–7 keV band of 1.5 1038 erg s-1, assuming a standard absorbed power law spectral model with an index of 1.7 and absorption equivalent to 1021 hydrogen atom cm-2. Our results from four XMM-Newton observations of RX J0042.6+4115 reveal 0.3–7 keV luminosities of 3–4 times that reported by Kong et al. (2002) while spectral fits required a blackbody component in addition to a power law component. Furthermore, significant variability is observed over time-scales of 100 s. Of the Galactic X-ray binary population, such behaviour is only observed in Z-sources and X-ray transients. As this object is clearly not a transient, we argue that RX J0042.6+4115 is the 9th Z-source.
The paper is constructed as follows: the properties of Z-sources are briefly reviewed in the next section; the XMM-Newton observations and analysis techniques are then discussed; lightcurves, colour-colour diagrams and energy spectra are presented in the Results section and the case for classifying RX J0042.6+4116 as an analogue to the Galactic Z-sources presented in the Discussion section.
2 Properties of Z-sources
The Z-source subclass of low mass X-ray binaries (LMXB) is characterised by high X-ray luminosities (1038 erg s-1, Hasinger & van der Klis 1989) and intensity variations of up to 100% over timescales of minutes (White et al. 1976, and references within); they are named after the patterns traced on their colour-colour diagrams. If X-ray lightcurves of a source are obtained in several energy bands, then one can define hard and soft colours to see spectral variations over time; the commonly used colour-colour diagram (CD) is a plot of hard colour vs. soft colour. Z-sources exhibit three-branched, approximately Z-shaped CDs, with temporal properties that are strongly correlated to the position of the source on the CD (Hasinger & van der Klis 1989). The branches are historically named the horizontal branch (HB), normal branch (NB) and flaring branch (FB). During spectral evolution, the Z-source moves smoothly along the branches without jumping from one branch to another; the mass accretion rate is thought to increase as the source travels in the sense HB to NB to FB (Hasinger & van der Klis 1989). The Z-sources exhibit significant branch movement over time-scales of 100 s or less and trace out their complete pattern in 1 day (Muno et al. 2002). All Galactic Z-sources exhibit kilohertz quasi-periodic oscillations (see Liu et al. 2001, and references within). This tells us that they all contain neutron star primaries, since the power density spectra of LMXB with black hole primaries are not thought to contain any power at 500 Hz (Sunyaev & Revnivtsev 2000). These Z-sources may be divided further into two subsets: Cygnus X-2, GX 5$-$1 and GX 340+0 have strong, horizontal HBs and weak flaring branches while Sco X-1, GX 17+2 and GX 349+2 have strong FBs and weak, vertical HBs (Hasinger & van der Klis 1989). The underlying differences that account for this division of Z-sources is unknown. Two additional Z-source candidates have recently been identified: Circinus X-1 (e.g. Iaria et al. 2001) and the first extra-galactic Z-source LMC X-2 (Smale & Kuulkers 2000). It is highly likely that the set of 6–7 known Z-sources in our Galaxy is complete, due to their high X-ray luminosities, yet they account for only of the Galactic LMXB (Liu et al. 2001).
The spectral evolution of Sco X-1 along its flaring branch was studied by Barnard et al. (2003b), using data from the Rossi-XTE observatory (Bradt et al. 1993); luminosities of 5–12 1038 erg s-1 were observed in the 1–30 keV energy band. This exceeds the Eddington luminosity for an accreting, 1.4 M⊙ neutron star, the luminosity where the radiation pressure on accreting material balances the gravitation forces (2 1038 erg s-1), (Frank et al. 2002). However, the majority of the X-ray emission comes from an extended accretion disc corona and only 10–30% of the 1–30 keV emission comes from the neutron star surface, in the form of blackbody emission; the luminosity of the neutron star is generally sub-Eddington (Barnard et al. 2003b). We can therefore expect the X-ray spectrum of an analogue of Sco X-1 to contain a strong blackbody component as well as the standard power law component fitted by Kong et al. (2002).
3 Observations
Four XMM-Newton observations were made of the core of M31; data from the three EPIC detectors in each observation were analysed for variation between observations and variability within observations. The three imaging CCD instruments, two MOS (Turner et al. 2001) and one PN (Strüder et al. 2001) share a common, circular field of view with a radius of 30 (Jansen et al. 2001). A journal of the XMM-Newton observations of the core of M31 are presented in Table 1.
| Observation | Date | Exp | Filter |
|---|---|---|---|
| 1 | 25/07/00 (rev0100) | 34 ks | Medium |
| 2 | 27/12/00 (rev0193) | 13 ks | Medium |
| 3 | 29/06/01 (rev0285) | 56 ks | Medium |
| 4 | 06/01/02 (rev0381) | 61 ks | Thin |
Lightcurves of RX J0042.6+4115 were obtained in the 0.3–2.5, 2.5–10, 4.0–10 and 0.3–10 keV energy bands from the PN and MOS detectors at their highest time resolutions. The analysis closely follows that performed in Paper 1, with two minor differences. Firstly, the background contribution to the lightcurves was very small, and all good data were used.
| Observation | /dof | P0.3-2.5keV | /dof | P2.5-10keV | /dof | P0.3-10keV |
|---|---|---|---|---|---|---|
| 1 | 100/77 | 0.04 | 143/77 | 7 10-6 | 162/77 | 6 10-6 |
| 2 | 33/24 | 0.10 | 23/24 | 0.52 | 28/24 | 0.26 |
| 3 | 513/131 | 10-6 | 412/131 | 259/131 | 10-6 | |
| 4 | 730/152 | 10-6 | 497/152 | 10-6 | 441/152 | 10-6 |

Secondly, spectra from the PN only were analyzed; the data were accumulated into 250 eV bins and bins below 0.4 and above 10 keV were ignored.
4 Results
Observations 1, 3 and 4 exhibit significant variability in all energy bands, while the lightcurves from observation 2 exhibit no significant variability; each lightcurve was fitted with a line of constant intensity and the resulting best fit /dof and probability of randomly getting a larger /dof (P) are presented in Table 2. Strong intensity enhancements occur at the start of observations 3 and 4; in fact, the lightcurves of RX J0042.6+4115 closely resemble the 1998, January RXTE lightcurves of Sco X-1, which captured a transition between the FB and the NB (Barnard et al. 2003b). The flares in Sco X-1 last for a few thousand seconds and are hard, meaning that the fractional amplitude of the flares increases with energy (White et al. 1976). Combined EPIC (PN + MOS1 + MOS2) lightcurves of RX J0042.6+4115 from observation 4 in the 0.3–2.5 and 2.5–10 keV energy bands are given in Fig. 2 with 400 s binning; clearly the relative amplitude of flaring is higher in the 2.5–10 keV energy band (100%) than in the 0.3-2.5 keV band (%).
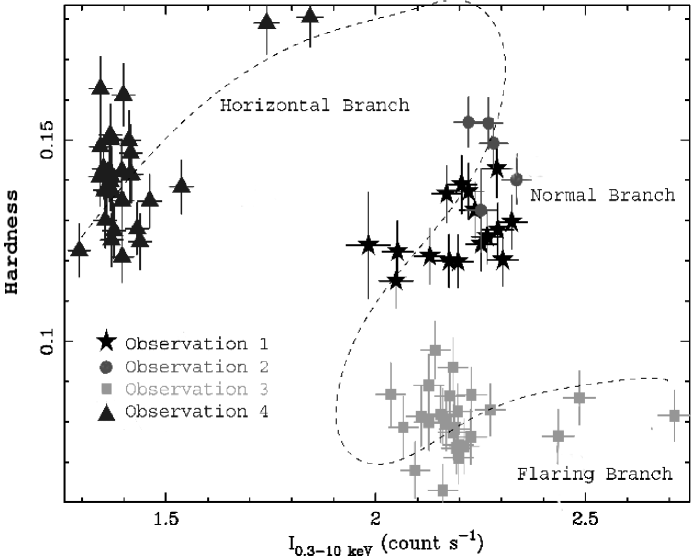
Hardness-intensity data was obtained for the 4 observations of RX J0042.6+4115; the hardness was defined as the ratio of the 4.0–10 keV intensity to the 0.3–2.5 keV intensity, and data were integrated over 2000 s. The high energy band 4.0–10 keV was chosen to better separate the three branches; Z-sources are more variable at higher energies than at low energies (see e.g. White et al. 1976, who modelled the X-ray spectrum as bremsstrahlung emission and interpreted the increase in hardness with intensity as an increase in temperature). Fig. 3 shows the hardness vs intensity diagram (HID) for all observations of RX J0042.6+4115; stars, circles, triangles and squares represent data from observations 1, 2, 3 and 4 respectively. The resulting HID appears to show fragments of the Z-pattern characteristic of the Cygnus X-2 like Z-sources (Hasinger & van der Klis 1989); it appears that observation 1 is on the NB, observation 2 is near the HB/NB apex, observation 3 is on the FB, and observation 4 is on the HB.
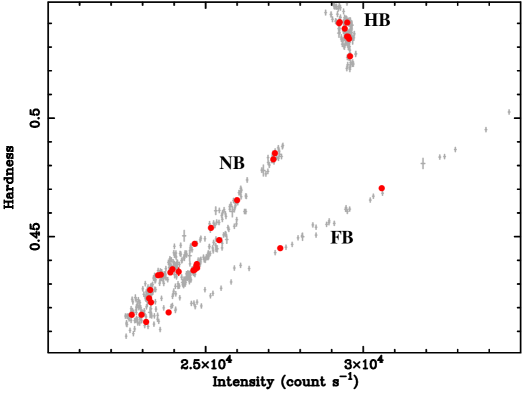
In order to illustrate the effects of long integration times on HID for Z-sources, we present in Fig. 4 hardness vs. intensity data from 400 ks of RXTE data on Sco X-1 using 96 s binning and 2000 s binning. We see that using 2000 s bins preserves the shape of the HID that would be seen at 96 s resolution, although the curve is more sparsely sampled; hence we can be confident that our HID of RX J0042.6+4115 is consistent with Z-source HID.
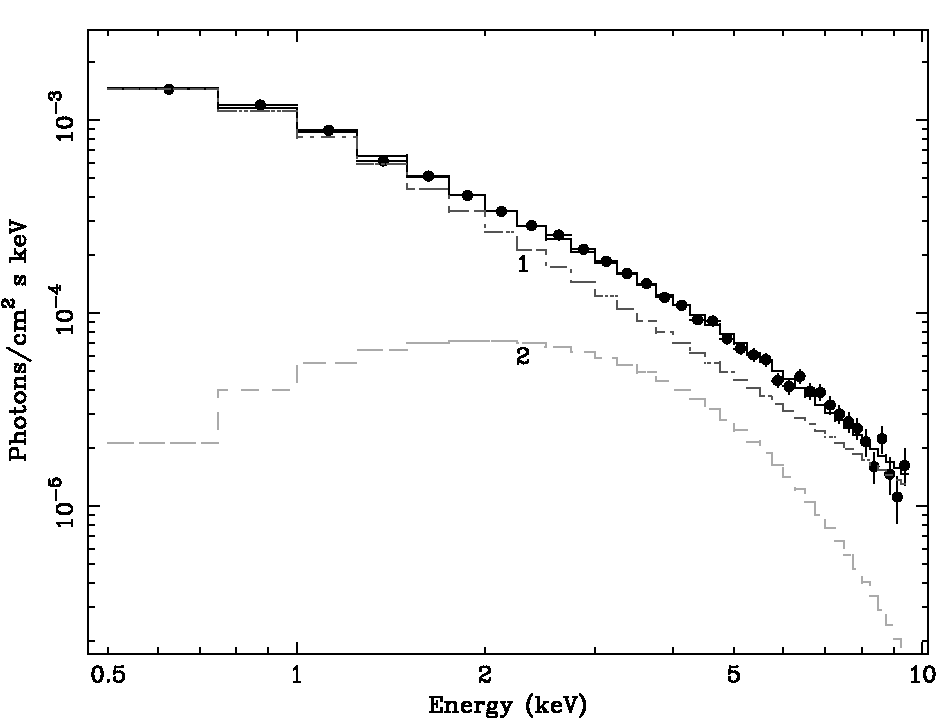
The intervals of high intensity variability were omitted from spectral analysis, because the hardness ratios of these data (and therefore spectra) significantly varied; as a result, the spectrum from observation 1 had an exposure of only 10 ks, while the spectra of observations 3 and 4 both had exposures of 50 ks. The PN spectra from the four observations of RX J0042.6+4115 were first fitted by simple power law models (A1–A4). None of these fits were statistically acceptable. Fits to the spectrum of observation 4 using models consisting of a single bremsstrahlung component (/dof=103/29) or a single comptt component (/dof = 247/27) were also rejected. Hence a two component emission model was applied, consisting of a blackbody and a power law. These two component models (B1–B4) all provided good fits to their respective spectra. All models incorporated freely-fitted, line-of-sight absorption. The unfolded, 0.4–10 keV PN spectrum of RX J0042.6+4115 from observation 1 is presented in Fig. 5; the data are shown (filled circles) along with the power law (1) and blackbody (2) components, and the sum for the best fit model. The best fit parameters, /dof and fluxes of each model are presented in Table 3; 90% confidence errors were obtained for the two-component models, but not the single component models since the fits were unacceptable. The spectra were then tested for the presence of line emission. There is evidence for a 6.4 keV line, corresponding to fluorescent iron K emission in observation 3 only: F-testing showed that the improvement in /dof due to fitting the line had a 3% probability of being random.
| Model | /1022 | k | /1034 | /10-3 | /dof | |||
|---|---|---|---|---|---|---|---|---|
| atom cm-2 | keV | erg s-1 | photon cm-2 | erg cm-2 s-1 | erg cm-2 s-1 | |||
| at 10 kpc | at 1 keV | |||||||
| A1 | 0.14 | 1.9 | 1.4 | 49/29 | 8.1 | |||
| A2 | 0.15 | 1.8 | 1.4 | 49/24 | 8.0 | |||
| A3 | 0.14 | 1.8 | 1.2 | 351/30 | 7.3 | |||
| A4 | 0.14 | 1.8 | 1.16 | 258/29 | 7.2 | |||
| B1 | 0.14(3) | 1.08(10) | 1.28(18) | 2.02(3) | 1.36(3) | 34/27 | 8(3) | 1.1(4) |
| B2 | 0.14(2) | 1.05(8) | 1.87(15) | 1.95(4) | 1.22(3) | 23/22 | 8(2) | 1.5(5) |
| B3 | 0.16(2) | 1.11(3) | 2.79(8) | 2.24(2) | 1.12(1) | 37/28 | 7.3(8) | 2.3(3) |
| B4 | 0.13(2) | 1.08(3) | 2.65(10) | 2.10(3) | 1.00(2) | 33/27 | 7.0(9) | 2.2(3) |
The spectral shape parameters from the two component models are fairly consistent from observation to observation, with line-of-sight absorption of 0.14 1022 H atom cm-2, a blackbody temperature equivalent to kT 1.1 keV, and a photon index of 2.1. However, the normalisations of the two emission components change significantly. This is entirely consistent with the spectral evolution of Sco X-1 (Barnard et al. 2003b). The total 0.4–10 keV luminosity ranges over 4.8–5.6 1038 erg s-1, or 2.5 times the Eddington limit for a 1.4 M⊙ neutron star, while the blackbody contribution is 0.7–1.6 1038 erg s-1, which is sub-Eddington. The total 0.4–10 keV luminosity decreases by 10% over the 4 observations, while the blackbody luminosity increases by 100%. The peculiar softness of observation 3 data appears to be due to the steep photon index, bearing out the association of observation 3 data with the flaring branch – the photon index steepens along the flaring branch in Sco X-1 (Barnard et al. 2003b). Meanwhile the hardness of observation 4 data may be explained by the increased blackbody contribution to the X-ray flux, since its fractional contribution to the 4.0–10 keV flux is greater than for the 0.3–2.5 keV flux, as demonstrated in Fig. 5.
5 Discussion
In order to place RX J0042.6+4115 in M31, we must show that it is not a foreground object or a background AGN. If RX J0042.6+4115 was local, it would have to be within a few kpc, and so the 0.4–10 keV luminosity would be reduced by a factor of 106, to 5 1032 erg s-1. Thus RX J0042.6+4115 would be too faint to be a persistently bright LMXB (Lewin et al. 1995) and would be either a cataclysmic variable or soft X-ray transient (SXT) in quiescence. However, the observed X-ray spectra for RX J0042.6+4115 are completely unlike any observed in cataclysmic variables (see Kuulkers et al. 2003, and references within). Also the blackbody temperatures in our spectra are many times higher than expected for a quiescent SXT (c.f. 0.3 keV, Menou & McClintock 2001). Finally, they are inconsistent with observed spectra from AGN, which in the 0.5–10 keV energy range are described by a simple power law (Page 1998) whereas the spectra of RX J0042.6+4115 require a second component. It would be hard to understand this object if it were in our Galaxy or in a distant background galaxy, whereas it is easily comprehensible as a member of M31.
RX J0042.6+4115 is therefore a high luminosity X-ray binary, with a total 0.4–10 keV luminosity of 5–6 1038 erg s-1, including 0.8–1.7 1038 erg s-1 from a 1 keV blackbody component. The total luminosity exceeds the Eddington limit for a 1.4 M⊙ neutron star, however the blackbody component does not. Two Galactic Z-sources are known to regularly exceed the Eddington limit: Sco X-1 and GX 51 (e.g. Liu et al. 2001), while of the black hole XB, only transients in outburst (Chen et al. 1997) or extreme oddballs such as GRS 1915+105 (e.g. Belloni et al. 2000) reach the luminosities we have observed in RX J0042.6+4115.
Outbursts in X-ray transients generally rise in intensity quickly (a few days) and decay exponentially; the decline time-scales cluster around 30 days, although time-scales of 400 days are known (Chen et al. 1997). The first detection of RX J0042.6+4115 was over 20 years ago by the Einstein satellite, when the 0.2-4.0 keV luminosity was 2.4 1038 erg s-1 (Trinchieri & Fabbiano 1991), and it has been persistently bright in every observation since (e.g. Supper et al. 1997 2001), and so is highly unlikely to be a transient.
Since the three branches of the Z were observed over 18 months, it is possible that RX J0042.6+4115 is a very luminous atoll source. However, Muno et al. (2002) report that three-branched colour diagrams in atoll sources are only observed in systems where the intensity varies by a factor of 80; atoll sources that vary in X-ray intensity by no more than a factor of 10 only ever display a portion of the pattern (Muno et al. 2002). The 0.3–10 keV intensity of RX J0042.6+4115 varies by a factor of 2 over the four XMM-Newton observations, and yet three patterns of hardness-intensity behaviour are observed. In this regard, RX J0042.6+4115 is unlike any Galactic atoll source.
The lightcurves, hardness-intensity diagram, and the luminosities and composition of the X-ray spectra all strongly suggest that RX J0042.6+4115 is a Z-source; its luminosity and Z-pattern suggest that it is a super-Eddington, Cyg X-2-like Z-source analogous to GX 51. If RX J0042.6+4115 is a Z-source, it would be only the 9th to be found.
Acknowledgements.
We thank the referee for providing useful suggestions for improving the paper. This work is supported by PPARC. Data from the HEASARC public data archive for RXTE were used in constructing Fig. 4.References
- Barnard et al. (2003a) Barnard, R., Osborne, J. P., Kolb, U., & Borozdin, K. N. 2003a, A&A, 405, 505
- Barnard et al. (2003b) Barnard, R., Church, M. J., & Bałucińska-Church, M. 2003b, A&A, 405, 237
- Belloni et al. (2000) Belloni, T., Klein-Wolt, M., Méndez, M., van der Klis, M., & van Paradijs, J. 2000, A&A, 355, 271
- Bradt et al. (1993) Bradt, H. V., Rothschild, R. E., & Swank, J. H. 1993, A&AS, 97, 355
- Chen et al. (1997) Chen, W., Shrader, C. R., & Livio, M. 1997, ApJ, 491, 312
- Frank et al. (2002) Frank, J., King, A. R., & Raine, D. 2002, Accretion Power in Astrophysics, 3rd Edition (Cambridge University Press)
- Hasinger & van der Klis (1989) Hasinger, G. & van der Klis, M. 1989, A&A, 225, 79
- Iaria et al. (2001) Iaria, R., Burderi, L., Di Salvo, T., La Barbera, A., & Robba, N. R. 2001, ApJ, 547, 412
- Jansen et al. (2001) Jansen, F., Lumb, D., Altieri, B., et al. 2001, A&A, 365, L1
- Kong et al. (2002) Kong, A. H. K., Garcia, M. R., Primini, F. A., et al. 2002, ApJ, 577, 738
- Kuulkers et al. (2003) Kuulkers, E., Norton, A., Schwope, A., & Warner, B. 2003, in Compact Stellar X-ray sources (Cambridge University Press, astro-ph/0302351)
- Lewin et al. (1995) Lewin, W. H. G., van Paradijs, J., & van den Heuvel, E. p. J. 1995, X-ray Binaries (Cambridge University Press)
- Liu et al. (2001) Liu, Q. Z., van Paradijs, J., & van den Heuvel, E. P. J. 2001, A&A, 368, 1021
- Menou & McClintock (2001) Menou, K. & McClintock, J. E. 2001, ApJ, 557, 304
- Muno et al. (2002) Muno, M. P., Remillard, R. A., & Chakrabarty, D. 2002, ApJ, 568, L35
- Osborne et al. (2001) Osborne, J. P., Borozdin, K. N., Trudolyubov, S. P., et al. 2001, A&A, 378, 800
- Page (1998) Page, M. J. 1998, MNRAS, 298, 537
- Smale & Kuulkers (2000) Smale, A. P. & Kuulkers, E. 2000, ApJ, 528, 702
- Strüder et al. (2001) Strüder, L., Briel, U., Dennerl, K., et al. 2001, A&A, 365, L18
- Sunyaev & Revnivtsev (2000) Sunyaev, R. & Revnivtsev, M. 2000, A&A, 358, 617
- Supper et al. (2001) Supper, R., Hasinger, G., Lewin, W. H. G., et al. 2001, A&A, 373, 63
- Supper et al. (1997) Supper, R., Hasinger, G., Pietsch, W., et al. 1997, A&A, 317, 328
- Trinchieri & Fabbiano (1991) Trinchieri, G. & Fabbiano, G. 1991, ApJ, 382, 82
- Trudolyubov et al. (2002) Trudolyubov, S., Borozdin, K. N., Priedhorky, W. C., et al. 2002, ApJL
- Turner et al. (2001) Turner, M. J. L., Abbey, A., Arnaud, M., et al. 2001, A&A, 365, L27
- van den Bergh (2000) van den Bergh, S. 2000, The galaxies of the Local Group, by Sidney Van den Bergh. Published by Cambridge, UK: Cambridge University Press, 2000 Cambridge Astrophysics Series Series, vol no: 35, ISBN: 0521651816.
- White et al. (1976) White, N. E., Mason, K. O., Sanford, P. W., Ilovaisky, S. A., & Chevalier, C. 1976, MNRAS, 176, 91