172 ks Chandra Exposure of the LALA Boötes Field:
X-ray Source Catalog

J. X. Wang11affiliation: Johns Hopkins University, Charles and 34th Street, Bloomberg center, Baltimore, MD 21218; jxw@pha.jhu.edu, heckman@pha.jhu.edu, norman@stsci.edu. , S. Malhotra22affiliation: Space Telescope Science Institute, 3700 San Martin Drive, Baltimore, MD 21218; san@stsci.edu, rhoads@stsci.edu. , J. E. Rhoads22affiliation: Space Telescope Science Institute, 3700 San Martin Drive, Baltimore, MD 21218; san@stsci.edu, rhoads@stsci.edu. , M. J. I. Brown33affiliation: National Optical Astronomy Observatory, 950 North Cherry Avenue, Tucson, AZ 85719; mbrown@noao.edu, dey@noao.edu, jannuzi@noao.edu. , A. Dey33affiliation: National Optical Astronomy Observatory, 950 North Cherry Avenue, Tucson, AZ 85719; mbrown@noao.edu, dey@noao.edu, jannuzi@noao.edu. , T. M. Heckman11affiliation: Johns Hopkins University, Charles and 34th Street, Bloomberg center, Baltimore, MD 21218; jxw@pha.jhu.edu, heckman@pha.jhu.edu, norman@stsci.edu. , B. T. Jannuzi33affiliation: National Optical Astronomy Observatory, 950 North Cherry Avenue, Tucson, AZ 85719; mbrown@noao.edu, dey@noao.edu, jannuzi@noao.edu. , C. A. Norman11affiliation: Johns Hopkins University, Charles and 34th Street, Bloomberg center, Baltimore, MD 21218; jxw@pha.jhu.edu, heckman@pha.jhu.edu, norman@stsci.edu. 22affiliation: Space Telescope Science Institute, 3700 San Martin Drive, Baltimore, MD 21218; san@stsci.edu, rhoads@stsci.edu. , G. P. Tiede44affiliation: Department of Physics and Astronomy, Bowling Green State University, Bowling Green, OH 43403; tiede@astro.ufl.edu , and P. Tozzi55affiliation: Istituto Nazionale di Astrofisica (INAF) - Osservatorio Astronomico, Via G. Tiepolo 11, 34131 Trieste, Italy; tozzi@ts.astro.it
Abstract

We present an analysis of a deep, 172 ks Chandra𝐶𝑎𝑛𝑑𝑟𝑎Chandra observation of the Large Area Lyman Alpha Survey (LALA) Boötes field, obtained with the Advanced CCD Imaging Spectrometer (ACIS-I) on the Chandra𝐶𝑎𝑛𝑑𝑟𝑎Chandra X-ray Observatory. This is one of the deepest Chandra𝐶𝑎𝑛𝑑𝑟𝑎Chandra images of the extragalactic sky; only the 2 Ms CDF-N and 1 Ms CDF-S are substantially deeper. In this paper we present the X-ray source catalog obtained from this image, along with an analysis of source counts, and optical identifications. The X-ray image is composed of two individual observations obtained in 2002, and reaches 0.5 – 2.0 and 2.0 – 10.0 keV flux limits of 1.5 ×\times 10-16 and 1.0 ×\times 10-15 ergs cm-2 s-1, respectively, for point sources near the aim point. A total of 168 X-ray sources were detected: 160 in the 0.5 – 7.0 keV band, 132 in the 0.5 – 2.0 keV band, and 111 in the 2.0 – 7.0 keV band. The X-ray source counts were derived and compared with those from other Chandra𝐶𝑎𝑛𝑑𝑟𝑎Chandra deep surveys; the hard X-ray source density of the LALA Boötes field is 33% higher than that of CDF-S at the flux level of 2.0 ×\times 10-15 ergs cm-2 s-1, confirming the field-to-field variances of the hard band source counts reported by previous studies. The deep exposure resolves greater-than-or-equivalent-to\gtrsim 72% of the 2.0 – 10.0 keV X-ray background.

Our primary optical data are R𝑅R-band imaging from NOAO Deep Wide-Field Survey (NDWFS), with limiting magnitude of R𝑅R = 25.7 (Vega, 3σ𝜎\sigma, 4″ diameter aperture). We have found optical counterparts for 152 of the 168 Chandra𝐶𝑎𝑛𝑑𝑟𝑎Chandra sources (90%); 144 of these are detected on the R𝑅R-band image, and 8 have optical counterparts in other bands (either BWsubscript𝐵𝑊B_{W},V𝑉V,I𝐼I,zsuperscript𝑧z^{\prime}). Among the R𝑅R-band non-detected sources, not more than 11 of them can possibly be at z>𝑧absentz> 5, based on the hardness ratios of their X-ray emission and nondetections in bluer bands (BWsubscript𝐵𝑊B_{W},V𝑉V). The majority (similar-to\sim 76%) of the X-ray sources are found to have log(fXsubscript𝑓𝑋f_{X}/fRsubscript𝑓𝑅f_{R}) within 0.0±plus-or-minus\pm1, which are believed to be AGNs. Most of the X-ray faint/optically bright sources (log(fXsubscript𝑓𝑋f_{X}/fRsubscript𝑓𝑅f_{R}) << -1.0) are optically extended, which are low-z normal galaxies or low luminosity AGNs. There is also a population of sources which are X-ray overluminous𝑜𝑣𝑒𝑟𝑙𝑢𝑚𝑖𝑛𝑜𝑢𝑠overluminous for their optical magnitudes (log(fXsubscript𝑓𝑋f_{X}/fRsubscript𝑓𝑅f_{R}) >> 1.0), which are harder in X-ray and are probably obscured AGNs.

catalogs — galaxies: active — galaxies: high-redshift — X-rays: diffuse background — X-rays: galaxies

1 Introduction

A new era of X-ray astronomy has begun with the launch of the Chandra𝐶𝑎𝑛𝑑𝑟𝑎Chandra X𝑋X-Ray𝑅𝑎𝑦Ray Observatory𝑂𝑏𝑠𝑒𝑟𝑣𝑎𝑡𝑜𝑟𝑦Observatory on 1999 July 23, thanks to its very high sensitivity, broad energy range and high angular resolution (Weisskopf et al. 2002). The two deepest X-ray surveys ever conducted, 2 Ms Chandra𝐶𝑎𝑛𝑑𝑟𝑎Chandra Deep Field North (Brandt et al. 2003, Alexander et al. 2003) and 1 Ms Chandra𝐶𝑎𝑛𝑑𝑟𝑎Chandra Deep Field South (Giacconi et al. 2002; Rosati et al. 2001), were obtained using the Advanced CCD Imaging Spectrometer detector (ACIS; Garmire et al. 2003) on Chandra𝐶𝑎𝑛𝑑𝑟𝑎Chandra X𝑋X-Ray𝑅𝑎𝑦Ray Observatory𝑂𝑏𝑠𝑒𝑟𝑣𝑎𝑡𝑜𝑟𝑦Observatory. These two surveys are similar-to\sim 50 times more sensitive than the deepest pre-Chandra𝐶𝑎𝑛𝑑𝑟𝑎Chandra observations in the soft X-ray band (0.5 – 2.0 keV, e.g., Hasinger et al. 1998) and greater than 100 times more sensitive than those deepest pre-Chandra𝐶𝑎𝑛𝑑𝑟𝑎Chandra observations in the hard X-ray band (2.0 – 10.0 keV, e.g., Ueda et al. 1999; Fiore et al. 1999). With these surveys, the “diffuse” X-ray background discovered four decades ago (Giacconi et al. 1962) has been almost entirely resolved into discrete sources (i.e. >> 90% in the soft band, and similar-to\sim 80% in the hard band).

Many other deep X-ray blank-sky surveys from Chandra𝐶𝑎𝑛𝑑𝑟𝑎Chandra (Stern et al. 2002a; Yang et al. 2003; Mushotzky et al. 2000; Manners et al. 2003) and XMM (Hasinger et al. 2001) were also performed in the past few years. Along with multi-band observations of the detected X-ray sources, these deep surveys have brought us many interesting results and more important science issues to be addressed. These include the large scale structures from 2D (Yang et al. 2003) and 3D (Gilli et al. 2003; Barger et al. 2002) analyses, type 2 QSOs (Norman et al. 2002; Stern et al. 2002b), very high redshift X-ray selected Active Galactic Nuclei (AGN, e.g., Barger et al. 2003), and much more.

Here we present a new deep (172 ks) Chandra𝐶𝑎𝑛𝑑𝑟𝑎Chandra ACIS exposure, obtained originally for the follow-up of Lyα𝛼\alpha sources from the Large Area Lyman Alpha (LALA) survey’s Boötes field. The Large Area Lyman Alpha (LALA) Survey (Rhoads et al. 2000, 2003; Rhoads & Malhotra 2001, Malhotra & Rhoads 2002) was designed to search for Lyman α𝛼\alpha emitters at high redshifts through narrowband imaging. The survey comprises two primary fields, 36′×\times36′ in size each, located in Boötes (at 14:25:57 +35:32 J2000.0) and in Cetus (at 02:05:20 -04:55 J2000.0). Both fields were chosen to be inside the large areas of the NOAO Deep Wide-Field Survey (NDWFS), which is a deep optical and IR (BWRIJHKsubscript𝐵𝑊𝑅𝐼𝐽𝐻𝐾B_{W}RIJHK) imaging survey of 18 deg2superscriptdeg2{\rm deg}^{2} of the sky with the primary goal of studying the evolution of large-scale structure from z<5𝑧5z<5 (Jannuzi and Dey 1999; Brown et al. 2003; Jannuzi et al. 2004, in preparation). Five broadband optical images (BWsubscript𝐵𝑊B_{W}, R𝑅R, I𝐼I from NDWFS, and V𝑉V, zsuperscript𝑧z^{\prime} as part of LALA) and eight narrowband images are used to search for Lyman-α𝛼\alpha emitters at z similar-to\sim 4.5, 5.7, and 6.5 respectively. The X-ray image presented here was originally obtained to investigate the X-ray properties of the detected high redshift Lyα𝛼\alpha emitters. This study was presented by Malhotra et al. (2003), where we placed stringent upper limits on the typical X-ray flux of Lyα𝛼\alpha sources and conclude that AGN (obscured or otherwise) cannot constitute a dominant portion of the Lyα𝛼\alpha source population.

This Chandra𝐶𝑎𝑛𝑑𝑟𝑎Chandra exposure (172 ks) is among the deepest yet obtained by Chandra𝐶𝑎𝑛𝑑𝑟𝑎Chandra of the extragalactic sky; only the CDF-N and CDF-S are substantially deeper. In this paper we present a full catalog of the detected X-ray sources, along with an analysis of the X-ray source counts, and the R𝑅R-band magnitudes (or 3σ𝜎\sigma upper limits) for their optical counterparts. To study the nature of these sources, spectroscopic follow-up observations for these sources are under way.

The present paper is structured as follows: we present the X-ray observations and data reduction in Section 2, source detection and catalog in Section 3, LogN-LogS in section 4, and optical identifications in Section 5. Our conclusions and summary are presented in Section 6.

2 X-ray Observations and Data Reduction

An 178 kilo-second exposure, composed of two individual observations, was obtained using the Advanced CCD Imaging Spectrometer (ACIS) on the Chandra X-ray Observatory in the very faint (VFAINT) mode. The first observation, with 120 ks exposure, was taken on 2002 April 16-17 (Chandra Obs ID 3130). The second observation, with 58 ks exposure, was taken on 2002 June 9 (Obs ID 3482). All four ACIS-I chips and ACIS-S2, ACIS-S3 chips were used, with the telescope aimpoint centered on the ACIS-I3 chip for each exposure. The aimpoint of Obs ID 3130 is 14:25:37.791 +35:36:00.20 (J2000.0111Coordinates throughout this paper are J2000.), and the aimpoint of Obs ID 3482 is 14:25:37.564 +35:35:44.32, 16\arcsec away from that of Obs ID 3130. The Galactic column density NH towards our field is 1.15 ×\times 1020 cm-2 (Hartmann et al. 1996). Due to their large off-axis angle during the observations, the ACIS-S chips have worse spatial resolution and lower effective area relative to the ACIS-I chips. In this paper, data from any ACIS-S CCD were therefore ignored.

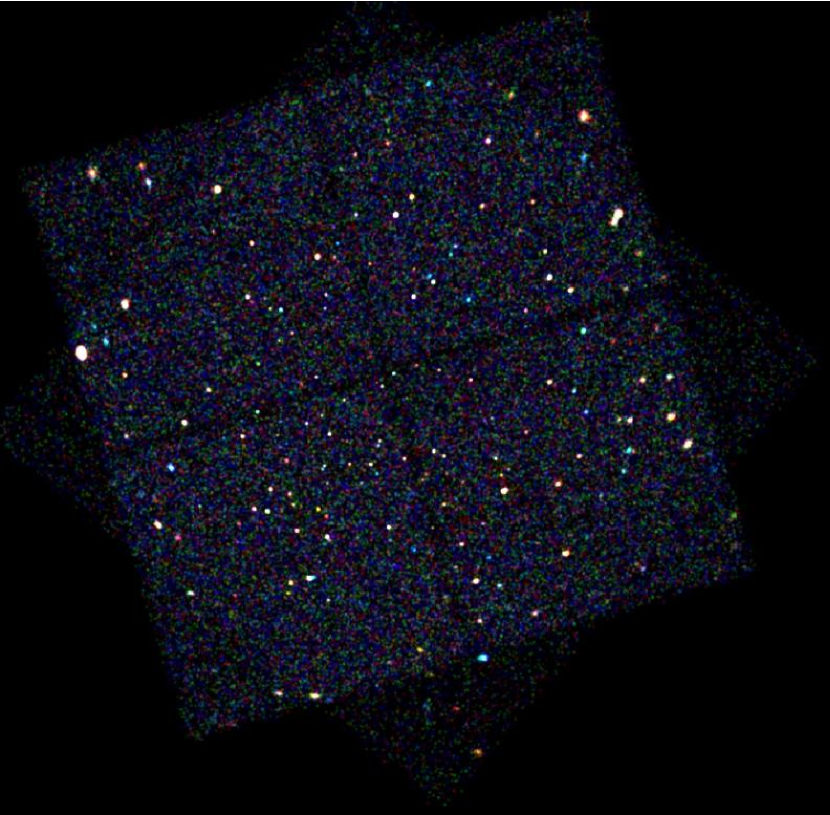
The data were reduced and analyzed using the Chandra𝐶𝑎𝑛𝑑𝑟𝑎Chandra Interactive Analysis of Observations (CIAO) software (version 2.2.1, see http://asc.harvard.edu/ciao). The data were reprocessed to clean the ACIS particle background for very faint mode observations, and then filtered to include only the standard event grades 0,2,3,4,6222see http://asc.harvard.edu/proposer/POG/html/ACIS.html##\#sec:GRADES. All bad pixels and columns were also removed, not only from the photon events files, but also when calculating the effective exposure maps. The high background time intervals were manually removed by checking the total event rates. The total net exposure time is 172 ks (120 ks from Obs ID 3130, and 52 ks from Obs ID 3482). The offset between the astrometry of the two observations was obtained by registering the X-ray sources showing up in both exposures. The two event files were merged after correcting the small offset (0.3″), and the combined data have the same coordinate system as Obs ID 3130. We present the color composite X-ray image of the combined exposure in Fig. 1.

3 Source Detection and Catalog

Three images were extracted from the combined event file for source detection: a soft image (0.5 – 2.0 keV), a hard image (2.0 – 7.0 keV) and a total image (0.5 – 7.0 keV). The hard and total bands were cut at 7 keV since the effective area of Chandra𝐶𝑎𝑛𝑑𝑟𝑎Chandra decreases above this energy, and the instrumental background rises, giving a very inefficient detection of sky and source photons. The WAVDETECT program (Freeman et al. 2002), which is included with the CIAO software package, was run on the extracted images. A probability threshold of 1 ×\times 10-7 (corresponding to 0.5 false sources expected per image), and wavelet scales of 1,2,4,8,16 pixels (1 pixel = 0.492″) were used. A total of 168 X-ray sources were detected: 160 in the total band (0.5 – 7.0 keV), 132 in the soft band (0.5 – 2.0 keV), and 111 in the hard band (2.0 – 7.0 keV). We present the catalog of the detected sources in Table 1. Note that the number of total detected X-ray sources will be increased to 196 if we use a probability threshold of WAVDETECT (1 ×\times 10-6), however, considering the increased number of possible false detections (similar-to\sim 5 expected per image), we prefer to publish a conservative catalog with fewer false detections. We also tried to search for X-ray sources with scales much larger than the PSF by running WAVDETECT with wavelet scales of 32,64,128 pixels on the images. However, we didn’t detect any new source beyond those in the catalog. Below we give explanations to the columns in Table 1.

Column(1)-(4): the source ID, IAU name, right ascension and declination respectively. The IAU name for the sources is CXOLALA1 JHHMMSS.s+DDMMSS. The positions were determined by WAVDETECT. Whenever possible, we use positions derived in the soft band, which has the best spatial resolution among the three bands. For sources which are not detected in the soft band, we use total band positions instead if available, and hard band positions were quoted for those sources detected only in the hard band.

Column(5): 3 σ𝜎\sigma uncertainties of the centroid positions directly given by WAVDETECT.

Column(6)-(8): the net counts in the soft, hard and total bands. The counts were calculated using circular aperture photometry. For each source, we defined a source region which is a circle centered at the position given in column (3) and (4), with radius Rs set to the 95% encircled-energy radius of Chandra𝐶𝑎𝑛𝑑𝑟𝑎Chandra ACIS PSF at the source position. Rs varies in the range of 2\arcsec to 15\arcsec from the center to the edge of the field. Source photons were then extracted from the regions, and the local background was extracted from an annulus with outer radius of 2.4 ×\times Rs and inner radius of 1.2 ×\times Rs, after masking out nearby sources. The aperture correction (×\times 1/0.95) was applied to the source counts. The derived net counts and 1 σ𝜎\sigma Poisson uncertainties (e.g., Gehrels 1986) are given for each source in each band.

Column(9): indication of source detection. We mark the source with “T”, “S” and “H” for source detected in total, soft and hard band respectively. Multiple letters are used for sources detected in more than one band. For example, “TS” means detections in both the total band and the soft band, but non-detected in the hard band.
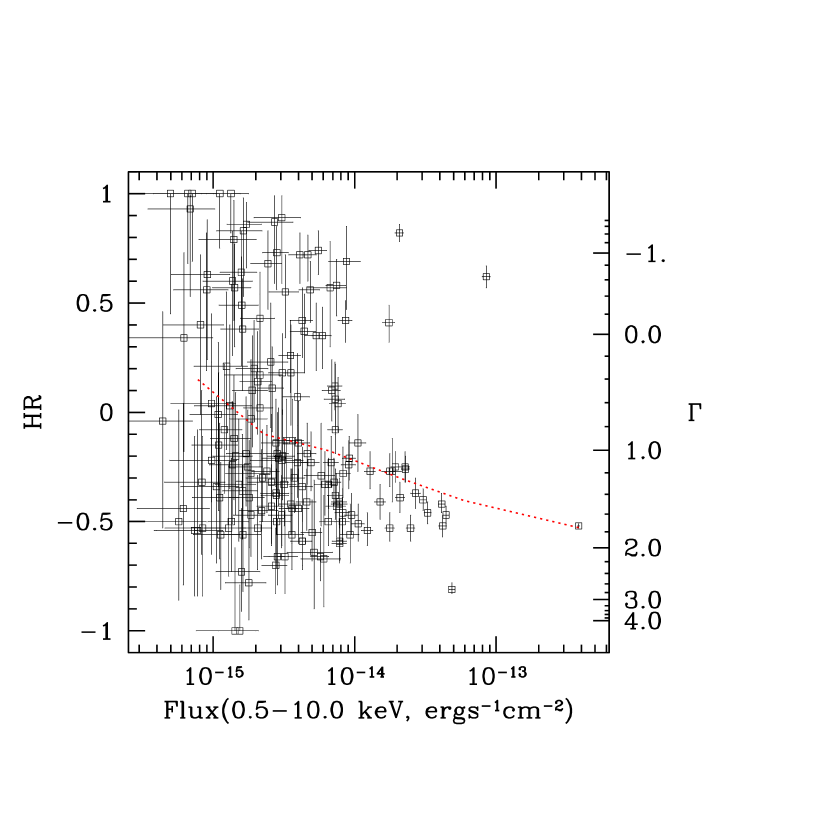
Column(10): hardness ratio defined as HR𝐻𝑅HR = (H-S)/(H+S), where H and S are the vignetting-corrected net counts in the hard and soft band respectively. The hardness ratios vs 0.5 – 10.0 keV band X-ray fluxes for the detected X-ray sources are plotted in Fig. 2. Assuming a power-law spectrum with the Galactic HI column density (1.15 ×\times 1020 cm-2), the observed hardness ratio can be converted to the photon index ΓΓ\Gamma of the spectrum, which is also presented in the figure. As presented in earlier surveys, harder sources are seen at fainter fluxes, most of which are believed to be obscured AGNs.

Column(11)-(13): X-ray fluxes (Galactic absorption corrected) of three bands in the unit of 10-15 ergs cm-2 s-1. A power-law spectrum with the Galactic column density was assumed to calculate the conversion factors from net counts to X-ray fluxes. The photon index of the power-law was chosen at ΓΓ\Gamma = 1.4, which was also used in Giacconi et al. (2002) and Stern et al. (2002a). Three band net count rates were calculated by dividing the net counts in column 6-8 by the effective exposure time333The effective exposure time was calculated through multiplying 172 ks by the ratio of the exposure map at the aim point to the value of the exposure map averaged within the extraction region for each source. Such a correction was done in each band separately. at each source position in each band, and then converted into X-ray fluxes of 0.5 – 10.0 keV, 0.5 – 2.0 keV, and 2.0 – 10.0 keV respectively. These settings make our results directly comparable with those from other surveys. The conversion factors used were 1.25 ×\times 10-11 ergs cm-2 count-1 from the 0.5 – 7.0 keV band observed count rates to the Galactic absorption corrected X-ray fluxes in the band 0.5 – 10.0 keV, 4.67 ×\times 10-12 ergs cm-2 count-1 from the 0.5 – 2.0 keV band count rates to the 0.5 – 2.0 keV band fluxes, and 2.96 ×\times 10-11 ergs cm-2 count-1 from the 2.0 – 7.0 keV band count rates to the 2.0 – 10.0 keV band fluxes. Note the total band (0.5 – 10.0 keV) flux is not equal to the sum of the soft and hard band fluxes if the actual photon index differs from 1.4. To calculate the fluxes assuming a power-law spectrum with different photon index ΓΓ\Gamma, the conversion factors FΓ/F1.4 for different bands are needed (Fig. 3). We can see from the figure that the soft band (0.5 – 2.0 keV) flux is not sensitive to the photon index ΓΓ\Gamma, while the hard (2.0 – 10.0 keV) and total (0.5 – 10.0 keV) band fluxes correlate with it strongly. One thus has to be careful while using these fluxes.

Column(14)-(16): The offsets of the detected optical counterparts from the X-ray source positions (ΔαΔ𝛼\Delta\alpha = RAR - RAX, ΔδΔ𝛿\Delta\delta = DecR - DecX), and the R𝑅R-band AUTO magnitudes (Kron-like elliptical aperture magnitudes, Bertin & Arnouts 1996) with 1 σ𝜎\sigma uncertainties444The uncertainties of the magnitudes are direct output from SExtractor, without including the uncertainty of the R𝑅R-band zeropoint.. For sources which are not detected in R𝑅R-band, 3σ𝜎\sigma upper limits of the magnitudes are given when available. See section 5 for details.

Column(17): The FWHM (full-width half-maximum) of the optical counterparts in NDWFS R𝑅R-band image (see section 5).

4 X-ray source counts

In order to calculate the cumulative source counts, N(>>S), one need count the number of sources with fluxes >>S, and also compute the summed sky in the field where these sources can be detected (the sky coverage). In Fig. 4, we present the soft and hard band net counts vs off-axis angle for faint sources (with net counts << 50). Detected and non-detected sources (detected in other bands but having net counts from X-ray photometry) are displayed with different symbols. It’s clear from the figure that the X-ray sources with larger off-axis angles need more net counts to be detected because of the larger PSF size. This indicates that the detection limits of net counts vary with the PSF sizes. Two dashed lines (net counts = A + B ×\times PSF2 respectively) are added to Fig. 4, with the parameters A and B chosen for both bands by visual inspection to exclude all non-detected sources and include maximum number of detected sources. We can see that although some detected sources are located below the threshold dashed lines, they are mixed up with these non-detected sources, i.e., the detection is incomplete below the lines, and the sky coverage for these sources is thus not available. In this paper, we use only these sources with net counts C >> A + B ×\times PSF2 to calculate LogN-LogS555A = 5.3, 8.2 and B = 0.026, 0.053 for the soft and hard band respectively.. Using the above cutoffs, the sky coverages are derived and presented in Fig. 5. The derived LogN-LogS for both soft and hard band are presented in Fig. 6. A maximum-likelihood power-law was used to fit the slope of the LogN-LogS in each band. For the 0.5 – 2.0 keV band we find

N(>S)=340(S2×1015ergscm2s1)0.78annotated𝑁absent𝑆340superscript𝑆2superscript1015ergssuperscriptcm2superscripts10.78N(>S)=340({S\over{2\times 10^{-15}\ {\rm ergs}\ {\rm cm^{-2}}\ {\rm s^{-1}}}})^{-0.78} (1)

And for the 2.0 – 10.0 keV band, we find:

N(>S)=1790(S2×1015ergscm2s1)1.16annotated𝑁absent𝑆1790superscript𝑆2superscript1015ergssuperscriptcm2superscripts11.16N(>S)=1790({S\over{2\times 10^{-15}\ {\rm ergs}\ {\rm cm^{-2}}\ {\rm s^{-1}}}})^{-1.16} (2)

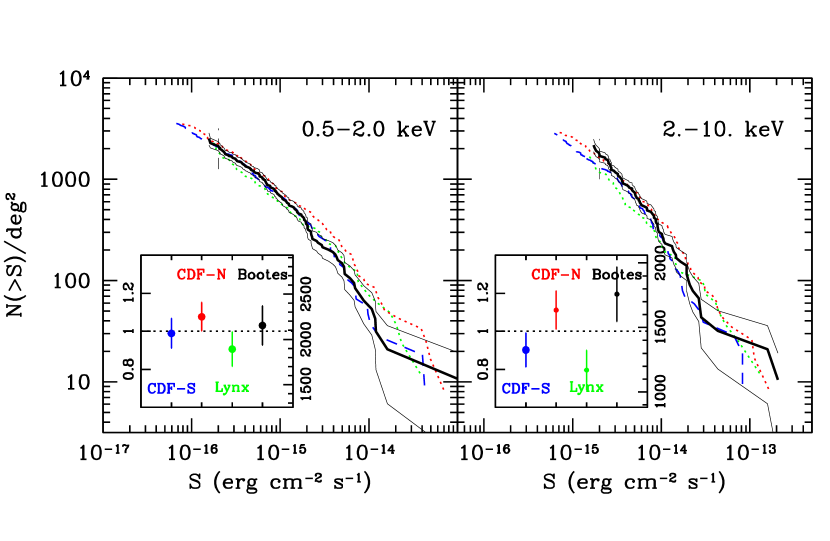
The above procedures of calculating LogN-LogS were also run on the 1 Ms CDF-N data (Brandt at al. 2001), 1 Ms CDF-S data (Rosati et al. 2002), and 184.7 ks Lynx data (Stern et al. 2002a). The independently derived LogN-LogS from the above three fields match the published ones to within 1σ𝜎\sigma, and are plotted in Fig. 6 for comparison. The source densities (N>>S) and 1σ𝜎\sigma uncertainties at the faint end (2.0 ×\times 10-16 ergs cm-2 s-1 in 0.5 – 2.0 keV band, and 2.0 ×\times 10-15 ergs cm-2 s-1 in the 2.0 – 10.0 keV band) are plotted in the inserts. In the soft band, there is no significant difference among the source counts from the four deep surveys. In the hard band, obvious fluctuations of the source counts are seen at the faint end: LALA Boötes field has the highest source density at 2.0 ×\times 10-15 ergs cm-2 s-1  which is 33% higher than that of CDF-S, while CDF-N is 23% higher than CDF-S and Lynx field is 14% lower. Note that similar field-to-field variances of the hard band source counts have been reported previously (see Tozzi 2001a, Cowie et al. 2002). This is believed to be due to the clustering of the X-ray sources. The non-detection of field-to-field variance in the soft band is also consistent with the results from previous studies (Yang et al. 2003; Tozzi et al. 2001a), indicating that the soft X-ray sources are less correlated than the hard X-ray sources.

What fraction of the hard X-ray background is resolved by our deep 172 ks Chandra𝐶𝑎𝑛𝑑𝑟𝑎Chandra imaging? In the range of 1.7-100 ×\times 10-15 ergs cm-2 s-1, the integrated hard X-ray flux density in the 2.0 – 10.0 keV band is 1.2 ×\times 10-11 ergs cm-2 s-1 deg-2. Note for sources bright than 10-13 ergs cm-2 s-1, the integrated hard X-ray flux density from our survey is 0.4 ×\times 10-11 ergs cm-2 s-1 deg-2, consistent with the value derived by della Ceca et al. (1999) from a wider area ASCA survey. The total integrated hard X-ray flux density we obtained is 1.6 ×\times 10-11 ergs cm-2 s-1 deg-2, down to 1.7 ×\times 10-15 ergs cm-2 s-1 in 2.0 – 10.0 keV band. This is equal to the High Energy Astronomy Observatory 1 (HEAO 1) value (Marshall et al. 1980), but 10%-30% lower than the more recent determinations from ASCA and BeppoSAX𝐵𝑒𝑝𝑝𝑜𝑆𝐴𝑋BeppoSAX (e.g., Ueda et al. 1999; Vecchi et al. 1999). We conclude that our 172 Chandra𝐶𝑎𝑛𝑑𝑟𝑎Chandra deep imaging resolves greater-than-or-equivalent-to\gtrsim 70% of the 2.0 – 10.0 keV X-ray background, and the main uncertainty comes from the value of total X-ray background itself.

5 Optical Identifications

5.1 Optical Images

Our deep Chandra pointing is within the NDWFS Boötes subfield NDWFS J1426+3531 (which is 35′×\times35′ in size) centered at RA 14:26:00.8, DEC +35:31:32.0 (J2000). Five broadband optical images (BWsubscript𝐵𝑊B_{W}, V𝑉V, R𝑅R, I𝐼I, and zsuperscript𝑧z^{\prime}) are available to search for the optical counterparts of the X-ray sources. Three of these (BWsubscript𝐵𝑊B_{W}, R𝑅R, and I𝐼I)666The BWsubscript𝐵𝑊B_{W} and I𝐼I band images are available from the NOAO Science Archive (http://www.archive.noao.edu/ndwfs/). The R𝑅R-band image, which is deeper than the currently released version, will be available from the NOAO Science Archive within 12 months. are from the NOAO Deep Wide Field Survey (NDWFS; Jannuzi & Dey 1999), while the remaining two (V𝑉V and zsuperscript𝑧z^{\prime}) were obtained as part of LALA. The limiting Kron-Cousins system magnitudes (3σ𝜎\sigma, 4″ diameter aperture) of the NDWFS images are BW<26.5subscript𝐵𝑊26.5B_{W}<26.5, R<25.7𝑅25.7R<25.7, and I<25.0𝐼25.0I<25.0. The corresponding limits in the LALA broadband data are V<25.9𝑉25.9V<25.9 and z<24.6superscript𝑧24.6z^{\prime}<24.6 (where the zsuperscript𝑧z^{\prime} limit is on the AB system). Our primary optical image for identifications in this paper is the R𝑅R-band image from NDWFS, which is substantially deeper than the others. All the optical images were obtained using the Kitt Peak National Observatory Mayall 4m telescope and the Mosaic-1 camera (Muller et al. 1998; Jannuzi et al. 2004, in preparation). These images were produced following the procedures described in version 7.01 of ”The NOAO Deep Wide-Field Survey MOSAIC Data Reductions”777http://www.noao.edu/noao/noaodeep/ReductionOpt/frames.html.. A general description of the software used is provided by Valdes (2002) and the complete details of the NDWFS data reduction will be provided by Jannuzi et al. (2004).

5.2 Optical Counterparts

SExtractor package (Bertin & Arnouts 1996) V2.1.0 was run on the NDWFS deep R𝑅R-band image to generate the R𝑅R-band source catalog. The registration of the X-ray to optical coordinates was done by cross-correlating the X-ray and the above R𝑅R-band catalogs (e.g., see Giacconi et al. 2002, Stern et al. 2002a). Average shifts in (RAR - RAX, DecR - DecX) of (0.1″, -0.2″) were found from the NDWFS R𝑅R-band to X-ray imaging, but no obvious rotation or plate-scale effects were discovered. After correcting the average shifts, we matched the optical and X-ray source catalogs using a 1.5″ radius aperture for host identifications, which was generally used by other Chandra𝐶𝑎𝑛𝑑𝑟𝑎Chandra surveys (Giacconi et al. 2002, Stern et al. 2002a). The 3σ𝜎\sigma X-ray positional uncertainties in Table 1 are used if larger than 1.5″.

Optical counterparts for 144 of the 168 X-ray sources were detected in the R𝑅R-band image down to 3σ𝜎\sigma. One of them (No. 122) has multiple possible optical counterparts. Calculations show that the possibility of having one optical source down to 3σ𝜎\sigma in a 1.5″ circle by chance is 10%. This means that at least 90% of the optical counterparts we found should correspond to the X-ray sources, and at worst we might have similar-to\sim 14 false matches.

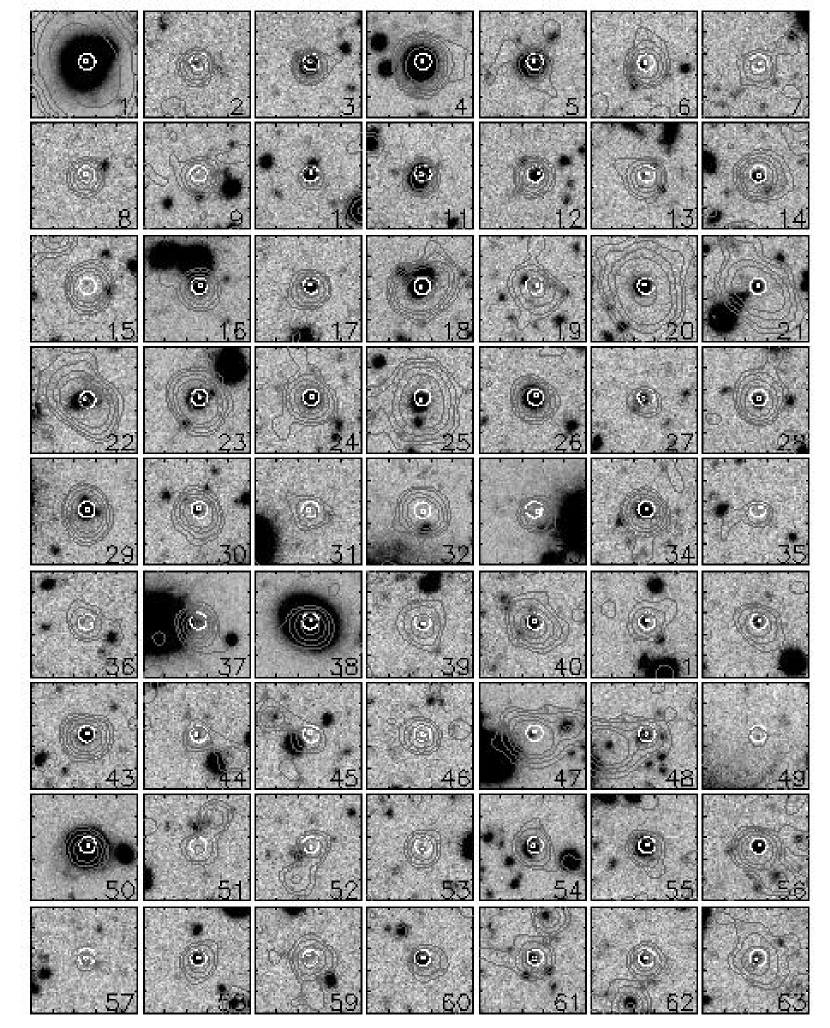
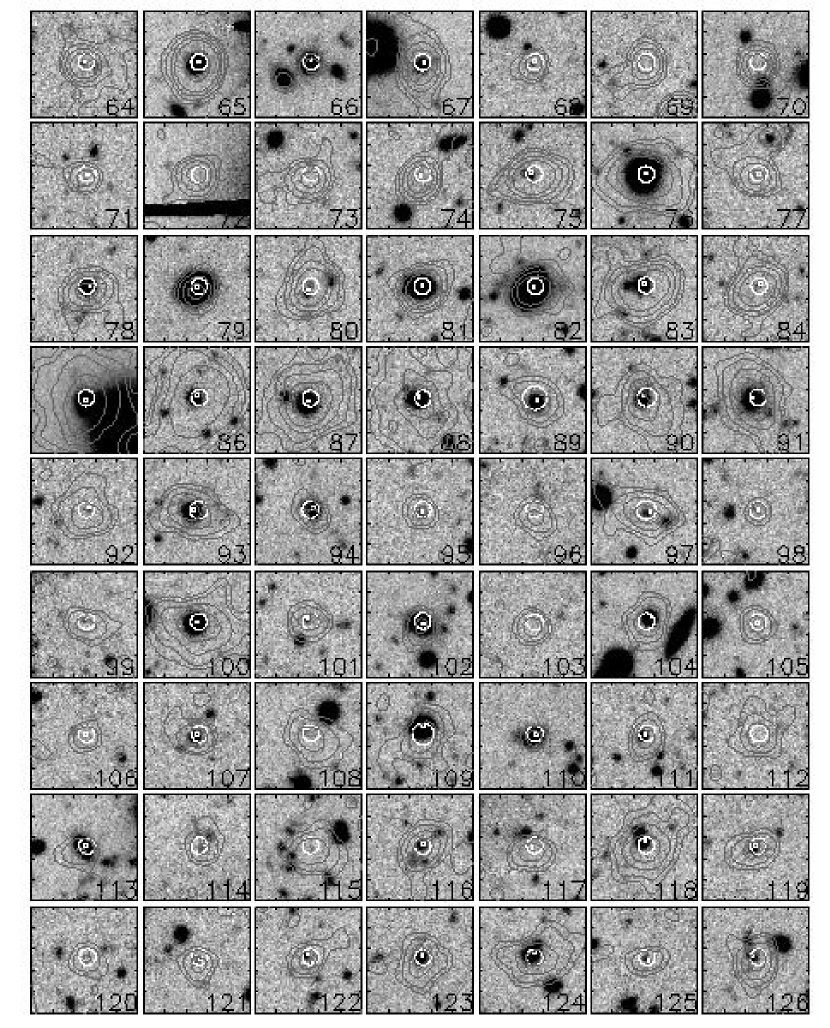
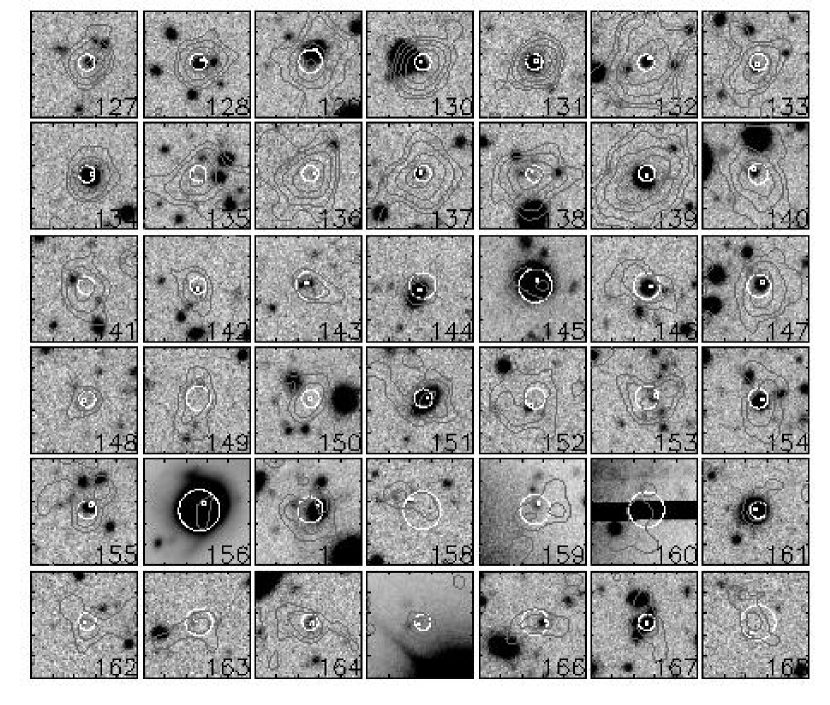
We present the offsets from the X-ray source positions (ΔαΔ𝛼\Delta\alpha = RAR - RAX, ΔδΔ𝛿\Delta\delta = DecR - DecX), the derived R𝑅R-band AUTO magnitudes (Kron-like elliptical aperture magnitudes, Bertin & Arnouts 1996) for all optical counterparts in Table 1, and the optical cutouts in Fig. 9. IRAF package ”radprof” was used to measure the radial profiles of these counterparts in NDWFS R𝑅R image, and we present the measured FWHM (full-width half-maximum) in Table 1. These sources which have FWHM larger than the average seeing of the NDWFS R𝑅R image (FWHM = 1.16″) were examined visually. We conclude that it is safe to consider all the bright sources (R𝑅R << 23) with FWHM \geq 1.3″ as optically resolved. The only exception is source No. 144, which is too close to another bright source, thus we can not tell if it is resolved or not. The total number of optically resolved sources is 15.

The search for optical counterparts was extended to BWsubscript𝐵𝑊B_{W}, I𝐼I, V𝑉V and zsuperscript𝑧z^{\prime} band for the 24 X-ray sources without R𝑅R-band optical counterparts, which brought us optical counterparts for 8 more X-ray sources. The positions of these counterparts are also given in Table 1 (by listing RA - RAX, Dec - DecX). The limiting magnitude of the R𝑅R-band image was given as upper limits for 22 of the X-ray sources. Note source No. 37 and 160 are overlapped by bleeding trails in the NDWFS R𝑅R image, and the upper limits of their R𝑅R-band magnitudes are not available.

The FIRST survey (Faint Images of the Radio Sky at Twenty-cm, Becker, White, & Helfand 1995) detection limit in our field is 0.96 mJy/beam. Radio counterparts for 4 of our X-ray sources were found, which are source No. 1, 66, 91 and 141, with integrated flux density (mJy) of 6.02, 1.24, 2.17 and 8.30 respectively. The first 3 of the 4 radio sources are resolved R<<21 red galaxies, which are some of the brightest optical counterparts to X-ray sources in our catalog. The remaining source is an R-band non-detection more than 10” from any R<<21 galaxies and is presumably at z>>1.

5.3 X-ray-to-optical flux ratio

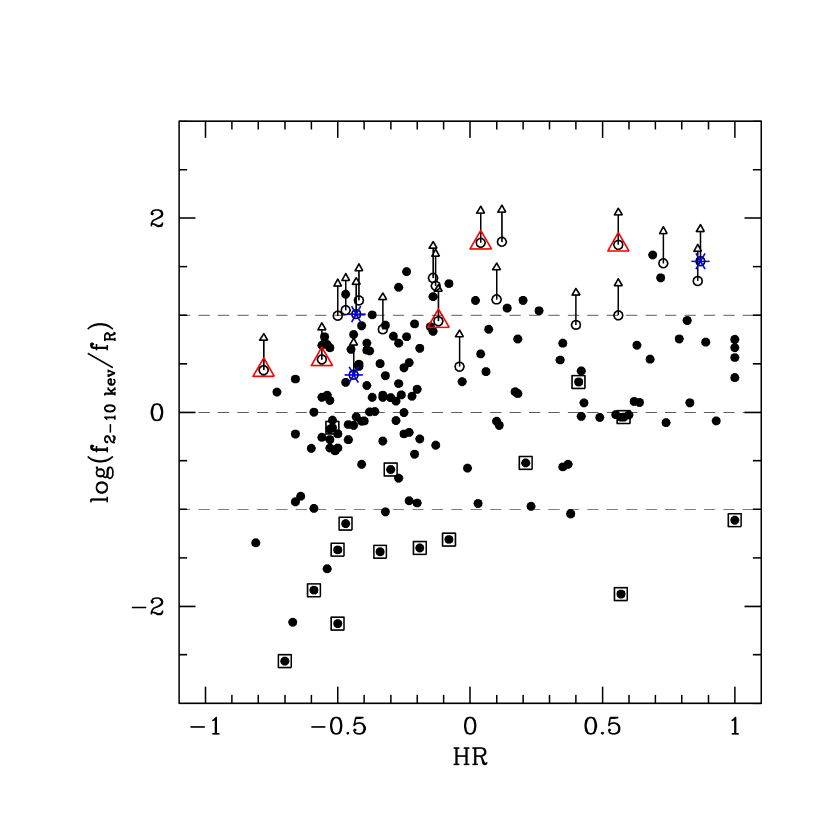
In Fig. 10 we plot the X-ray-to-optical flux ratio of our X-ray sources (in soft and hard band respectively), and in Fig. 11 we plot the log(fXsubscript𝑓𝑋f_{X}/fRsubscript𝑓𝑅f_{R}) in the hard band vs the hardness ratio of X-ray emission. For the 22 X-ray sources without R𝑅R-band counterparts detected, the lower limits of log(fXsubscript𝑓𝑋f_{X}/fRsubscript𝑓𝑅f_{R}) were plotted, which shows a consistent distribution with that of the optically faint (R𝑅R >> 24) sources. From the figures we can see that the majority (similar-to\sim 76%) of the X-ray sources fall within log(f210keVsubscript𝑓210𝑘𝑒𝑉f_{2-10keV}/fRsubscript𝑓𝑅f_{R}) = 0.0±plus-or-minus\pm1, which is typical of AGNs.

There is a significant population (similar-to\sim 10%) of X-ray faint/optically bright sources (log(f210keVsubscript𝑓210𝑘𝑒𝑉f_{2-10keV}/fRsubscript𝑓𝑅f_{R}) << -1.0), most of which are extended in the R𝑅R band optical image and X-ray soft (see Fig. 11). These sources should be nearby, bright normal galaxies (see Tozzi et al. 2001b; Barger et al. 2001; Hornschemeier at al. 2001). Other optically extended sources falling within log(f210keVsubscript𝑓210𝑘𝑒𝑉f_{2-10keV}/fRsubscript𝑓𝑅f_{R}) = 0.0±plus-or-minus\pm1 or X-ray hard are most likely to be low redshift Seyfert galaxies, or low luminosity AGNs.

In addition, we also have a population of sources which are X-ray overluminous𝑜𝑣𝑒𝑟𝑙𝑢𝑚𝑖𝑛𝑜𝑢𝑠overluminous for their optical magnitudes (log(f210keVsubscript𝑓210𝑘𝑒𝑉f_{2-10keV}/fRsubscript𝑓𝑅f_{R}) >> 1.0), especially in the hard band, including most of the 22 R𝑅R-band nondetected X-ray sources. We plot in Fig. 12 the histogram distribution of the hardness ratios of the optically faint X-ray bright sources (log(f210keVsubscript𝑓210𝑘𝑒𝑉f_{2-10keV}/fRsubscript𝑓𝑅f_{R}) >> 1.0), comparing with these sources with lower X-ray-to-optical flux ratio (1.0 >> log(f210keVsubscript𝑓210𝑘𝑒𝑉f_{2-10keV}/fRsubscript𝑓𝑅f_{R}) >> 0.0). The optically faint X-ray bright sources are obviously harder in X-ray, suggesting that most of them are obscured AGNs, for which high column density absorption shields both the optical and the soft X-ray emission.

5.4 R𝑅R-band nondetections

There are 22 X-ray sources which are not detected in the R𝑅R-band down to R𝑅R = 25.7; 5 of them are detected in redder bands (I𝐼I,zsuperscript𝑧z^{\prime}); and 3 of them in bluer bands (BWsubscript𝐵𝑊B_{W}, V𝑉V); 14 X-ray sources have no optical counterparts found in any band, which corresponds to a sky surface density of 145 deg-2. The integrated hard X-ray (2.0 – 10.0 keV) flux density from these 22 sources is 0.14 ×\times 10-11 ergs cm-2 s-1 deg-2, down to a flux limit of 1.7 ×\times 10-15 ergs cm-2 s-1. This contributes 6similar-to\sim9% of the total 2.0 – 10.0 keV band X-ray background.

The 19 R𝑅R-band nondetected sources, which are not detected in bluer bands (BWsubscript𝐵𝑊B_{W}, V𝑉V), are possible candidates for z𝑧z >> 5 quasars, because of the absorption from the Lyman transitions of hydrogen along our line of sight. However, our calculations indicate that even for a Compton thick AGN (with intrinsic photon power-law index ΓΓ\Gamma = 2.0 and absorption column density NH = 1024 cm-2), the hardness ratio HR is expected to be << 0 at z𝑧z >> 5. Thus 8 of them with harder X-ray spectra (HR >> 0) can not be at z𝑧z >> 5. In Fig. 11, we also marked the 5 X-ray sources without R𝑅R-band counterparts, but showing up in redder bands (I𝐼I,zsuperscript𝑧z^{\prime}). Preliminary results from photometric redshift analyses show that the two softest ones of the 5 are at photo-z similar-to\sim 4.3, and the other 3 which have harder X-ray spectra at photo-z similar-to\sim 1-2. This agrees well with the above argument that high redshift objects should be soft in X-ray. Excluding these sources with HR >> 0, there are 11 R𝑅R-band nondetections left, which can be possibly at z𝑧z >> 5.

Assuming a constant AGN density up to z𝑧z = 10, Gilli, Salvati & Hasinger (2001) predicted a z𝑧z >> 5 AGN density of 500 deg-2 for a limiting flux of 2.3 ×\times 10-15 ergs cm-2 s-1 in the 0.5 – 2.0 keV band. This model predicts similar-to\sim 50 z>𝑧absentz> 5 sources in our field, which is clearly too high. Assuming the AGN density above z𝑧z = 2.7 decreases by a factor of 2.7 per unit redshift as found for optical quasars (Schmidt, Schneider, & Gunn 1995), Gilli et al. predicted a much lower source density of z𝑧z >> 5 AGNs (25 deg-2) for the same limiting flux. It corresponds to similar-to\sim2 z𝑧z >> 5 objects in our field, which is very plausible with the current data, considering that those 11 sources are unlikely to be all at z𝑧z >> 5. Actually, several optically faint Chandra𝐶𝑎𝑛𝑑𝑟𝑎Chandra sources from other surveys have already been confirmed to be at z𝑧z << 5 by spectroscopic observations (e.g., see Alexander et al. 2001).

6 Conclusions

We present a deep, 172 ks Chandra𝐶𝑎𝑛𝑑𝑟𝑎Chandra ACIS exposure of the LALA Boötes field. This paper describes the details of the observations, data reduction, source detection, LogN-LogS analysis, and presents the X-ray source catalog along with R𝑅R-band magnitudes of their optical counterparts. A total of 168 X-ray sources were detected, 160 in the total band (0.5 – 7.0 keV), 132 in the soft band (0.5 – 2.0 keV), and 111 in the hard band (2.0 – 7.0 keV). Near the aim point, the detection is down to a flux limit of 1.5 ×\times 10-16 ergs cm-2 s-1 in soft (0.5 – 2.0 keV) band, and 1.0 ×\times 10-15 ergs cm-2 s-1 in hard (2.0 – 10.0 keV) band. LogN-LogS was compared with those from other deep surveys, and we find obvious field-to-field fluctuations of the hard band source counts. These fluctuations are believed to be due to the large scale clustering of the detected X-ray sources. Calculations show that our deep imaging resolves greater-than-or-equivalent-to\gtrsim 70% of the X-ray background in 2.0 – 10.0 keV band. Optical counterparts for 90% of the X-ray sources were found from deep optical images. Among the R𝑅R-band non-detected sources, 11 of them can be possibly at z>𝑧absentz> 5, based on the hardness ratios of their X-ray emission and the fact that they are not detected in bluer bands (BWsubscript𝐵𝑊B_{W},V𝑉V). Spectroscopic follow-up observations of these counterparts are being undertaken and will be present in future paper.

This work was supported by the CXC grant GO2-3152X and the National Optical Astronomy Observatory which is operated by the Association of Universities for Research in Astronomy (AURA), Inc. under a cooperative agreement with the National Science Foundation. We would like to thank the NDWFS team, and in particular Melissa Miller (NOAO), who assisted in the reduction of the R𝑅R-band image used extensively in this paper. We would like to thank N. Brandt for providing the CDF-N LogN - LogS. We also thank the referee for a prompt and helpful report.

References

  • (1) Alexander, D. M., Brandt, W. N., Hornschemeier, A. E., Garmire, G. P., Schneider, D. P., Bauer, F. E., & Griffiths, R. E 2001, AJ, 122, 2156
  • (2) Alexander, D. M., et al. 2003, AJ, in press, astro-ph/0304392
  • (3) Barger, A. J., Cowie, L. L., Mushotzky, R. F., & Richards, E. A. 2001, AJ, 121, 662
  • (4) Barger, A. J., Cowie, L. L., Brandt, W. N., Capak, P., Garmire, G. P., Hornschemeier, A. E., Steffen, A. T., & Wehner, E. H. 2002, AJ, 124, 1839
  • (5) Barger, A. J., Cowie, L. L., Capak, P., Alexander, D. M., Bauer, F. E., Brandt, W. N., Garmire, G. P., & Hornschemeier, A. E. 2003, ApJ, 584, 61
  • (6) Becker, R. H., White, R. L., & Helfand, D. J. 1995, ApJ, 450, 559
  • (7) Bertin, E. and Arnouts, S. 1996, A&AS 117,393
  • (8) Brandt, W. N., et al. 2001, 122, 2810
  • (9) Brandt, W. N., et al. 2003, HEAD, 35, 3601B
  • (10) Brown, M, Dey, A, Jannuzi, B. T., Lauer, T. R., Tiede, G. P., & Mikles, V. J. 2003, ApJ, in press, astro-ph0306128
  • (11) Cowie, L. L., Garmire, G. P., Bautz, M. W., Barger, A. J., Brandt, W. N., & Hornschemeier, A. E. 2002, ApJ, 566, L5
  • (12) della Ceca, R., Castelli, G., Braito, V., Cagnoni, I., & Maccacaro, T. 1999, ApJ, 524, 674
  • (13) Fiore, F., La Franca, F., Giommi, P., Elvis, M., Matt, G., Comastri, A., Molendi, S., & Gioia, I. 1999, MNRAS, 306, L55
  • (14) Freeman, P.E., Kashyap, V., Rosner, R., & Lamb, D. Q. 2002, ApJS, 138, 185
  • (15) Garmire, G. P., Bautz, M. W., Ford, P. G., Nousek, J. A., & Ricker, G. R. 2003, Proc. SPIE, 4851, 28
  • (16) Gehrels, N. 1986, ApJ, 303, 336
  • (17) Giacconi, R., Gurksy, H., Paolini, F.R., & Rossi, B.B. 1962, Phys. Rev. Lett., 9, 439
  • (18) Giacconi, R., et al. 2002, ApJS, 139, 369
  • (19) Gilli, R., Salvati, M., & Hasinger, G. 2001, A&A, 366, 407
  • (20) Gilli, R. et al. 2003, ApJ Letter accepted
  • (21) Hornschemeier, A. E. et al. 2001, ApJ, 554, 742
  • (22) Hartmann, D, Kalberla, P. M. W., Burton, W. B., & Mebold, U. 1999, A&AS, 119, 115
  • (23) Hasinger, G., Burg, R., Giacconi, R., Schmidt, M., Trumper, J., & Zamorani, G. 1998, A&A, 329, 482
  • (24) Hasinger, G. et al. 2001, A&A, 365, L45
  • (25) Jannuzi, B. T., & Dey, A. 1999, in ASP Conf. Ser. 191, Photometric redshifts and High-Redshift Galaxies, ed. R. J. Weymann, L. J. Storrie-Lombardi, M. Sawicki, & R. J. Brunner (San Francisco: ASP), 111
  • (26) Malhotra, S. & Rhoads, J. E. 2002, ApJ, 565, L71
  • (27) Malhotra, S., Wang, J. X., Rhoads, J. E., Heckman, T. M., & Norman, C. A. 2003, ApJ, 585, L25
  • (28) Manners, J. C., et al. 2003, MNRAS, 343, 293
  • (29) Muller, G. P., Reed, R., Armandroff, T., Boroson, T. A., & Jacoby, G. H. 1998, Proc. SPIE, 3355, 577
  • (30) Mushotzky, R. F., Cowie, L. L., Barger, A. J., & Arnaud, K. A. 2000, Nature𝑁𝑎𝑡𝑢𝑟𝑒Nature, 404, 459
  • (31) Norman, C, et al. 2002, ApJ, 571, 218
  • (32) Rhoads, J. E., Malhotra, S., Dey, A., Stern, D., Spinrad, H., & Jannuzi, B. T. 2000, ApJ, 545, L85
  • (33) Rhoads, J. E., & Malhotra, S. 2001, ApJ, 563, L5
  • (34) Rhoads, J. E., et al. 2003, AJ, 125, 1006
  • (35) Rosati, P., et al. 2002, ApJ, 566, 667
  • (36) Schmidt, M., Schneider, D. P., & Gunn, J. E. 1995, AJ, 110, 68
  • (37) Stern, D., et al. 2002a, ApJS, 123, 2223
  • (38) Stern, D., et al. 2002b, ApJ, 568, 71
  • (39) Tozzi, P. 2001a, in Proc. Marseille 2001 Conf. Where’s the Matter? eds. L. Tresse & M. Treyer, astro-ph/0111036
  • (40) Tozzi, P. et al. 2001b, ApJ, 562, 42
  • (41) Ueda, Y., et al. 1999, ApJ, 518, 656
  • (42) Valdes, F. G. 2002, in Automated Data Analysis in Astronomy, eds. Ranjan Gupta, Harinder P. Singh, and Coryn A. L. Bailer-Jones, (New Delhi: Narosa Publishing House), 309.
  • (43) Vecchi, A., Molendi, S., Guainazzi, M., Fiore, F., & Parmar, A. N. 1999, A&A, 349, L73
  • (44) Weisskopf, M. C., Brinkman, B., Canizares, C., Garmire, G., Murray, S., & Van Speybroeck, L. P. 2002, PASP, 114, 1
  • (45) Yang, Y., Mushotzky, R. F., Barger, A. J., Cowie, L. L., Sanders, D. B., & Steffen, A. T. 2003, ApJ, 585, L85
Refer to caption
Figure 1: False-color X-ray image (25×\arcmin\times25′) of the LALA Boötes Field, composed from 172 ks Chandra𝐶𝑎𝑛𝑑𝑟𝑎Chandra exposure. North is to the top, and east is to the left. The image was obtained combining three energy bands: 0.3 – 1.0 keV, 1.0 – 2.0 keV, 2.0 – 7.0 keV (red, green and blue respectively). The color intensity is derived directly from the counts and has not been corrected for vignetting.
Refer to caption
Figure 2: Hardness ratios HR = (HS)/(H+S)𝐻𝑆𝐻𝑆(H-S)/(H+S) (left ordinate axis) of X-ray sources vs their full band (0.5 – 10.0 keV) X-ray fluxes. The photon indices ΓΓ\Gamma of the power-law spectra which could reproduce the observed hardness ratios are given along the right ordinate (see text for details). The dotted line connects the averaged hardness ratios for detected sources within different flux bins.
Refer to caption
Figure 3: Conversion factors to calculate three band fluxes assuming a power-law spectrum with photon index different from ΓΓ\Gamma = 1.4.
Refer to caption
Figure 4: Soft (0.5 – 2.0 keV) and hard (2.0 – 7.0 keV) band net counts vs off-axis angle. The two dashed lines are the threshold we chose to build complete samples for LogN-LogS calculation. The net counts are derived from X-ray photometry. Thus for each source we can give net count for each band, whether it is detected in the band or not. In the upper panel, the filled squares are sources detected in the soft band, and open ones are those not detected in the soft band. In the lower panel, the filled squares are sources detected in the hard band, and open ones are those not detected in the hard band.
Refer to caption
Figure 5: Sky coverage in soft (0.5 – 2.0 keV) and hard (2.0 – 7.0 keV) bands, as a function of flux limit.
Refer to caption
Figure 6: LogN-LogS in the soft (0.5 – 2.0 keV) and hard (2.0 – 10.0 keV) bands from 172ks Chandra𝐶𝑎𝑛𝑑𝑟𝑎Chandra observations of LALA Boötes field. Data are plotted as thick solid lines with two additional thin solid lines enclosing 1σ𝜎\sigma Poisson uncertainties. LogN-LogS from CDF-N, CDF-S and Lynx field are also plotted (see text for details). The inserts show the X-ray source densities and 1σ𝜎\sigma uncertainties from the four fields at the faint end of our 172 ks Chandra𝐶𝑎𝑛𝑑𝑟𝑎Chandra exposure (2.0 ×\times 10-16 ergs cm-2 s-1 in 0.5 – 2.0 keV band, and 2.0 ×\times 10-15 ergs cm-2 s-1 in the 2.0 – 10.0 keV band). The dashed lines in the inserts are the average source densities from the four fields, and the scales of the inserts are 0.6 to 1.4 times the average values.
Refer to caption
Figure 7:
Refer to caption
Figure 7:
Refer to caption
Figure 9: Optical cutouts (20×\arcsec\times20\arcsec) for the 168 X-ray sources, overlapped by black X-ray isointensity contours (at 3,5,10,20 and 100 σ𝜎\sigma above the local background). The small white box indicates an optical counterpart candidate, and the circle in the center indicates the radius used to search counterparts. North is to the top, and east is to the left.

Refer to captionRefer to caption

Figure 10: Optical R𝑅R-band magnitudes of the X-ray detected sources vs their soft (0.5 – 2.0 keV) and hard (2 – 10 keV) X-ray fluxes. 3σ𝜎\sigma upper limits are plotted for sources without R𝑅R-band counterparts. Dotted lines show location of constant X-ray-to-optical flux ratio log(fXsubscript𝑓𝑋f_{X}/fRsubscript𝑓𝑅f_{R}) of +1, 0, and -1. Dots enclosed by squares are optically extended sources.
Refer to caption
Figure 11: X-ray-to-optical flux ratio log(f210keVsubscript𝑓210𝑘𝑒𝑉f_{2-10keV}/fRsubscript𝑓𝑅f_{R}) vs X-ray hardness ratio HR. Lower limits of log(f210keVsubscript𝑓210𝑘𝑒𝑉f_{2-10keV}/fRsubscript𝑓𝑅f_{R}) are plotted for sources without R𝑅R-band counterparts. Dashed lines show location of constant X-ray-to-optical flux ratio of +1, 0, and -1. Dots enclosed by squares are optically extended sources, open circles enclosed by triangles are R𝑅R-band nondetected sources which show up in redder bands (I𝐼I,zsuperscript𝑧z^{\prime}), and stars are bluer bands (BWsubscript𝐵𝑊B_{W}, V𝑉V) detected only.
Refer to caption
Figure 12: Histogram distribution of X-ray hardness ratio for the optically faint X-ray bright sources (log(f210keVsubscript𝑓210𝑘𝑒𝑉f_{2-10keV}/fRsubscript𝑓𝑅f_{R}) >> 1), comparing with these sources with 1.0 >> log(f210keVsubscript𝑓210𝑘𝑒𝑉f_{2-10keV}/fRsubscript𝑓𝑅f_{R}) >> 0.0. The two distributions are distinguishable according to the K-S test at the 98.7% significance level.
Table 1: Chandra𝐶𝑎𝑛𝑑𝑟𝑎Chandra Sources in LALA Boötes Field
ID CXOLALA1 RA(J2000) Dec(J2000) Err Tot. Cts. Soft Cts. Hard Cts. det HR S0.5-10 S0.5-2 S2-10 Δα()Δ𝛼\Delta\alpha(\arcsec) Δδ()Δ𝛿\Delta\delta(\arcsec) R𝑅R FWHM(″)
1 J142620.3+353708 14:26:20.36 35:37:08.7 0.2″ 4722.970.8+71.9subscriptsuperscript4722.971.970.84722.9^{+71.9}_{-70.8} 3607.861.8+62.8subscriptsuperscript3607.862.861.83607.8^{+62.8}_{-61.8} 1115.234.6+35.7subscriptsuperscript1115.235.734.61115.2^{+35.7}_{-34.6} TSH -0.520.01+0.01subscriptsuperscriptabsent0.010.01{}^{+0.01}_{-0.01} 382.34382.34382.34 109.67109.67109.67 212.18212.18212.18 0.3 -0.1 17.54±0.00plus-or-minus17.540.0017.54\pm{0.00} 1.3
2 J142555.5+353528 14:25:55.50 35:35:28.5 0.5″ 32.75.9+7.1subscriptsuperscript32.77.15.932.7^{+7.1}_{-5.9} 15.34.0+5.2subscriptsuperscript15.35.24.015.3^{+5.2}_{-4.0} 17.44.3+5.5subscriptsuperscript17.45.54.317.4^{+5.5}_{-4.3} TSH 0.070.20+0.20subscriptsuperscriptabsent0.200.20{}^{+0.20}_{-0.20} 3.943.943.94 0.690.690.69 4.924.924.92 0.6 -0.0 24.16±0.12plus-or-minus24.160.1224.16\pm{0.12} 1.1
3 J142547.2+353627 14:25:47.25 35:36:27.6 0.4″ 31.65.7+6.9subscriptsuperscript31.66.95.731.6^{+6.9}_{-5.7} 20.04.5+5.7subscriptsuperscript20.05.74.520.0^{+5.7}_{-4.5} 11.63.4+4.6subscriptsuperscript11.64.63.411.6^{+4.6}_{-3.4} TSH -0.270.19+0.21subscriptsuperscriptabsent0.210.19{}^{+0.21}_{-0.19} 2.402.402.40 0.570.570.57 2.052.052.05 0.4 -0.1 21.28±0.01plus-or-minus21.280.0121.28\pm{0.01} 1.2
4 J142547.1+353954 14:25:47.10 35:39:54.9 0.2″ 656.426.4+27.4subscriptsuperscript656.427.426.4656.4^{+27.4}_{-26.4} 593.625.0+26.1subscriptsuperscript593.626.125.0593.6^{+26.1}_{-25.0} 62.88.3+9.4subscriptsuperscript62.89.48.362.8^{+9.4}_{-8.3} TSH -0.810.02+0.03subscriptsuperscriptabsent0.030.02{}^{+0.03}_{-0.02} 48.6348.6348.63 16.5016.5016.50 10.8410.8410.84 0.2 -0.1 17.80±0.00plus-or-minus17.800.0017.80\pm{0.00} 1.1
5 J142546.4+353522 14:25:46.48 35:35:22.3 0.4″ 16.54.3+5.5subscriptsuperscript16.55.54.316.5^{+5.5}_{-4.3} 9.03.1+4.3subscriptsuperscript9.04.33.19.0^{+4.3}_{-3.1} 7.52.9+4.1subscriptsuperscript7.54.12.97.5^{+4.1}_{-2.9} TSH -0.080.29+0.30subscriptsuperscriptabsent0.300.29{}^{+0.30}_{-0.29} 1.201.201.20 0.250.250.25 1.281.281.28 0.3 -0.1 20.20±0.01plus-or-minus20.200.0120.20\pm{0.01} 1.4
6 J142545.3+353449 14:25:45.33 35:34:49.7 0.3″ 62.68.2+9.3subscriptsuperscript62.69.38.262.6^{+9.3}_{-8.2} 37.46.3+7.4subscriptsuperscript37.47.46.337.4^{+7.4}_{-6.3} 25.15.2+6.4subscriptsuperscript25.16.45.225.1^{+6.4}_{-5.2} TSH -0.190.14+0.14subscriptsuperscriptabsent0.140.14{}^{+0.14}_{-0.14} 4.624.624.62 1.041.041.04 4.384.384.38 0.3 -0.2 23.80±0.08plus-or-minus23.800.0823.80\pm{0.08} 1.0
7 J142543.3+353548 14:25:43.31 35:35:48.1 0.4″ 15.14.2+5.3subscriptsuperscript15.15.34.215.1^{+5.3}_{-4.2} 8.73.1+4.3subscriptsuperscript8.74.33.18.7^{+4.3}_{-3.1} 6.42.7+4.0subscriptsuperscript6.44.02.76.4^{+4.0}_{-2.7} TSH -0.150.30+0.33subscriptsuperscriptabsent0.330.30{}^{+0.33}_{-0.30} 1.091.091.09 0.240.240.24 1.091.091.09 -0.1 -0.4 25.86±0.35plus-or-minus25.860.3525.86\pm{0.35} 0.8
8 J142542.5+353358 14:25:42.53 35:33:58.2 0.4″ 30.75.7+6.9subscriptsuperscript30.76.95.730.7^{+6.9}_{-5.7} 21.14.7+5.8subscriptsuperscript21.15.84.721.1^{+5.8}_{-4.7} 9.63.3+4.5subscriptsuperscript9.64.53.39.6^{+4.5}_{-3.3} TSH -0.370.19+0.21subscriptsuperscriptabsent0.210.19{}^{+0.21}_{-0.19} 2.792.792.79 0.720.720.72 2.062.062.06 0.4 -0.3 25.48±0.28plus-or-minus25.480.2825.48\pm{0.28} 0.9
9 J142539.5+353357 14:25:39.55 35:33:57.9 0.4″ 34.86.1+7.2subscriptsuperscript34.87.26.134.8^{+7.2}_{-6.1} 25.05.1+6.3subscriptsuperscript25.06.35.125.0^{+6.3}_{-5.1} 9.83.3+4.5subscriptsuperscript9.84.53.39.8^{+4.5}_{-3.3} TSH -0.430.17+0.19subscriptsuperscriptabsent0.190.17{}^{+0.19}_{-0.17} 2.582.582.58 0.690.690.69 1.701.701.70 0.2 0.2 >>25.7
10 J142538.7+353618 14:25:38.72 35:36:18.0 0.4″ 9.53.1+4.3subscriptsuperscript9.54.33.19.5^{+4.3}_{-3.1} 6.32.5+3.8subscriptsuperscript6.33.82.56.3^{+3.8}_{-2.5} 3.21.7+3.1subscriptsuperscript3.23.11.73.2^{+3.1}_{-1.7} TS -0.320.33+0.42subscriptsuperscriptabsent0.420.33{}^{+0.42}_{-0.33} 0.830.830.83 0.210.210.21 0.660.660.66 -0.0 -0.0 21.64±0.02plus-or-minus21.640.0221.64\pm{0.02} 1.1
11 J142537.9+353612 14:25:37.94 35:36:12.0 0.3″ 25.65.2+6.4subscriptsuperscript25.66.45.225.6^{+6.4}_{-5.2} 18.94.4+5.6subscriptsuperscript18.95.64.418.9^{+5.6}_{-4.4} 6.62.7+4.0subscriptsuperscript6.64.02.76.6^{+4.0}_{-2.7} TS -0.470.19+0.23subscriptsuperscriptabsent0.230.19{}^{+0.23}_{-0.19} 1.851.851.85 0.510.510.51 1.141.141.14 0.4 -0.3 20.74±0.01plus-or-minus20.740.0120.74\pm{0.01} 1.3
12 J142536.3+353634 14:25:36.32 35:36:34.2 0.3″ 50.87.3+8.5subscriptsuperscript50.88.57.350.8^{+8.5}_{-7.3} 24.05.0+6.2subscriptsuperscript24.06.25.024.0^{+6.2}_{-5.0} 26.95.3+6.5subscriptsuperscript26.96.55.326.9^{+6.5}_{-5.3} TSH 0.060.16+0.16subscriptsuperscriptabsent0.160.16{}^{+0.16}_{-0.16} 7.307.307.30 1.291.291.29 8.968.968.96 -0.6 -0.0 22.41±0.03plus-or-minus22.410.0322.41\pm{0.03} 1.2
13 J142534.7+353407 14:25:34.76 35:34:07.8 0.3″ 46.87.1+8.2subscriptsuperscript46.88.27.146.8^{+8.2}_{-7.1} 17.64.4+5.6subscriptsuperscript17.65.64.417.6^{+5.6}_{-4.4} 29.25.5+6.7subscriptsuperscript29.26.75.529.2^{+6.7}_{-5.5} TSH 0.260.17+0.16subscriptsuperscriptabsent0.160.17{}^{+0.16}_{-0.17} 3.533.533.53 0.500.500.50 5.195.195.19 0.0 -0.1 24.58±0.15plus-or-minus24.580.1524.58\pm{0.15} 1.0
14 J142533.5+353845 14:25:33.51 35:38:45.6 0.3″ 95.910.2+11.3subscriptsuperscript95.911.310.295.9^{+11.3}_{-10.2} 63.28.2+9.3subscriptsuperscript63.29.38.263.2^{+9.3}_{-8.2} 32.76.0+7.2subscriptsuperscript32.77.26.032.7^{+7.2}_{-6.0} TSH -0.320.11+0.11subscriptsuperscriptabsent0.110.11{}^{+0.11}_{-0.11} 7.157.157.15 1.771.771.77 5.665.665.66 -0.1 -0.5 22.81±0.04plus-or-minus22.810.0422.81\pm{0.04} 1.1
15 J142530.7+353911 14:25:30.71 35:39:11.3 0.3″ 95.210.1+11.2subscriptsuperscript95.211.210.195.2^{+11.2}_{-10.1} 41.76.7+7.8subscriptsuperscript41.77.86.741.7^{+7.8}_{-6.7} 53.57.6+8.7subscriptsuperscript53.58.77.653.5^{+8.7}_{-7.6} TSH 0.120.11+0.11subscriptsuperscriptabsent0.110.11{}^{+0.11}_{-0.11} 7.257.257.25 1.191.191.19 9.469.469.46 >>25.7
16 J142529.2+353412 14:25:29.24 35:34:12.2 0.4″ 38.66.5+7.7subscriptsuperscript38.67.76.538.6^{+7.7}_{-6.5} 32.15.8+7.0subscriptsuperscript32.17.05.832.1^{+7.0}_{-5.8} 6.52.9+4.1subscriptsuperscript6.54.12.96.5^{+4.1}_{-2.9} TS -0.660.13+0.17subscriptsuperscriptabsent0.170.13{}^{+0.17}_{-0.13} 2.842.842.84 0.880.880.88 1.111.111.11 -0.1 -0.0 21.33±0.01plus-or-minus21.330.0121.33\pm{0.01} 1.1
17 J142525.4+353622 14:25:25.40 35:36:22.8 0.5″ 35.66.2+7.3subscriptsuperscript35.67.36.235.6^{+7.3}_{-6.2} 15.94.2+5.3subscriptsuperscript15.95.34.215.9^{+5.3}_{-4.2} 19.84.5+5.7subscriptsuperscript19.85.74.519.8^{+5.7}_{-4.5} TSH 0.110.20+0.19subscriptsuperscriptabsent0.190.20{}^{+0.19}_{-0.20} 2.612.612.61 0.440.440.44 3.353.353.35 0.2 -0.1 22.10±0.02plus-or-minus22.100.0222.10\pm{0.02} 1.1
18 J142520.7+353311 14:25:20.75 35:33:11.7 0.3″ 410.921.0+22.1subscriptsuperscript410.922.121.0410.9^{+22.1}_{-21.0} 300.517.9+19.0subscriptsuperscript300.519.017.9300.5^{+19.0}_{-17.9} 110.411.0+12.1subscriptsuperscript110.412.111.0110.4^{+12.1}_{-11.0} TSH -0.460.05+0.05subscriptsuperscriptabsent0.050.05{}^{+0.05}_{-0.05} 32.8332.8332.83 8.978.978.97 20.5520.5520.55 0.4 -0.3 20.15±0.00plus-or-minus20.150.0020.15\pm{0.00} 1.0
19 J142614.2+353631 14:26:14.29 35:36:31.5 1.0″ 59.48.8+9.9subscriptsuperscript59.49.98.859.4^{+9.9}_{-8.8} 46.27.3+8.4subscriptsuperscript46.28.47.346.2^{+8.4}_{-7.3} 13.24.9+6.1subscriptsuperscript13.26.14.913.2^{+6.1}_{-4.9} TSH -0.550.13+0.15subscriptsuperscriptabsent0.150.13{}^{+0.15}_{-0.13} 5.015.015.01 1.461.461.46 2.612.612.61 -0.5 -0.1 24.65±0.08plus-or-minus24.650.0824.65\pm{0.08} 1.1
20 J142614.2+353833 14:26:14.21 35:38:33.1 0.6″ 558.024.7+25.7subscriptsuperscript558.025.724.7558.0^{+25.7}_{-24.7} 411.421.0+22.0subscriptsuperscript411.422.021.0411.4^{+22.0}_{-21.0} 146.613.0+14.1subscriptsuperscript146.614.113.0146.6^{+14.1}_{-13.0} TSH -0.470.04+0.04subscriptsuperscriptabsent0.040.04{}^{+0.04}_{-0.04} 44.2144.2144.21 12.2412.2412.24 27.2227.2227.22 0.5 -0.0 20.93±0.01plus-or-minus20.930.0120.93\pm{0.01} 1.0
21 J142609.5+353213 14:26:09.56 35:32:13.8 0.7″ 246.216.7+17.8subscriptsuperscript246.217.816.7246.2^{+17.8}_{-16.7} 171.213.6+14.7subscriptsuperscript171.214.713.6171.2^{+14.7}_{-13.6} 75.09.7+10.8subscriptsuperscript75.010.89.775.0^{+10.8}_{-9.7} TSH -0.390.07+0.07subscriptsuperscriptabsent0.070.07{}^{+0.07}_{-0.07} 20.9120.9120.91 5.465.465.46 14.9714.9714.97 0.0 -0.1 22.41±0.03plus-or-minus22.410.0322.41\pm{0.03} 1.0
22 J142607.6+353351 14:26:07.66 35:33:51.4 0.6″ 265.117.0+18.1subscriptsuperscript265.118.117.0265.1^{+18.1}_{-17.0} 24.35.4+6.6subscriptsuperscript24.36.65.424.3^{+6.6}_{-5.4} 240.816.1+17.2subscriptsuperscript240.817.216.1240.8^{+17.2}_{-16.1} TSH 0.820.04+0.04subscriptsuperscriptabsent0.040.04{}^{+0.04}_{-0.04} 20.7220.7220.72 0.710.710.71 44.3544.3544.35 0.6 0.1 22.00±0.02aplus-or-minus22.00superscript0.02𝑎22.00\pm{0.02}^{a}
23 J142605.8+353508 14:26:05.83 35:35:08.7 0.4″ 246.516.3+17.4subscriptsuperscript246.517.416.3246.5^{+17.4}_{-16.3} 154.412.8+13.9subscriptsuperscript154.413.912.8154.4^{+13.9}_{-12.8} 92.010.0+11.1subscriptsuperscript92.011.110.092.0^{+11.1}_{-10.0} TSH -0.250.07+0.07subscriptsuperscriptabsent0.070.07{}^{+0.07}_{-0.07} 19.3919.3919.39 4.564.564.56 16.8816.8816.88 0.1 -0.1 20.12±0.00plus-or-minus20.120.0020.12\pm{0.00} 1.0
24 J142602.4+353605 14:26:02.42 35:36:05.6 0.6″ 81.79.6+10.7subscriptsuperscript81.710.79.681.7^{+10.7}_{-9.6} 61.58.1+9.2subscriptsuperscript61.59.28.161.5^{+9.2}_{-8.1} 20.25.0+6.2subscriptsuperscript20.26.25.020.2^{+6.2}_{-5.0} TSH -0.500.11+0.12subscriptsuperscriptabsent0.120.11{}^{+0.12}_{-0.11} 6.506.506.50 1.841.841.84 3.743.743.74 -0.1 -0.0 21.40±0.01plus-or-minus21.400.0121.40\pm{0.01} 1.1
25 J142601.1+354151 14:26:01.18 35:41:51.1 0.7″ 284.117.8+18.9subscriptsuperscript284.118.917.8284.1^{+18.9}_{-17.8} 179.414.0+15.1subscriptsuperscript179.415.114.0179.4^{+15.1}_{-14.0} 104.811.0+12.1subscriptsuperscript104.812.111.0104.8^{+12.1}_{-11.0} TSH -0.260.06+0.06subscriptsuperscriptabsent0.060.06{}^{+0.06}_{-0.06} 22.8722.8722.87 5.425.425.42 19.7719.7719.77 0.5 -0.7 20.96±0.01plus-or-minus20.960.0120.96\pm{0.01} 1.1
26 J142557.6+353445 14:25:57.65 35:34:45.9 0.4″ 65.58.5+9.6subscriptsuperscript65.59.68.565.5^{+9.6}_{-8.5} 40.46.6+7.8subscriptsuperscript40.47.86.640.4^{+7.8}_{-6.6} 25.15.2+6.4subscriptsuperscript25.16.45.225.1^{+6.4}_{-5.2} TSH -0.230.13+0.14subscriptsuperscriptabsent0.140.13{}^{+0.14}_{-0.13} 4.924.924.92 1.141.141.14 4.434.434.43 0.0 0.1 19.86±0.00plus-or-minus19.860.0019.86\pm{0.00} 1.0
27 J142557.7+353512 14:25:57.70 35:35:12.4 0.9″ 13.33.9+5.1subscriptsuperscript13.35.13.913.3^{+5.1}_{-3.9} 2.71.7+3.1subscriptsuperscript2.73.11.72.7^{+3.1}_{-1.7} 10.63.4+4.6subscriptsuperscript10.64.63.410.6^{+4.6}_{-3.4} TH 0.600.34+0.23subscriptsuperscriptabsent0.230.34{}^{+0.23}_{-0.34} 1.371.371.37 0.100.100.10 2.582.582.58 0.6 -0.5 22.65±0.04plus-or-minus22.650.0422.65\pm{0.04} 1.1
28 J142556.9+353845 14:25:56.94 35:38:45.1 0.5″ 87.69.9+11.0subscriptsuperscript87.611.09.987.6^{+11.0}_{-9.9} 58.37.9+9.0subscriptsuperscript58.39.07.958.3^{+9.0}_{-7.9} 29.45.8+7.0subscriptsuperscript29.47.05.829.4^{+7.0}_{-5.8} TSH -0.330.11+0.12subscriptsuperscriptabsent0.120.11{}^{+0.12}_{-0.11} 6.546.546.54 1.631.631.63 5.125.125.12 0.2 -0.3 22.42±0.03plus-or-minus22.420.0322.42\pm{0.03} 1.0
29 J142556.3+354018 14:25:56.34 35:40:18.4 0.5″ 132.012.0+13.1subscriptsuperscript132.013.112.0132.0^{+13.1}_{-12.0} 100.110.3+11.5subscriptsuperscript100.111.510.3100.1^{+11.5}_{-10.3} 31.86.1+7.2subscriptsuperscript31.87.26.131.8^{+7.2}_{-6.1} TSH -0.510.08+0.09subscriptsuperscriptabsent0.090.08{}^{+0.09}_{-0.08} 10.6110.6110.61 3.023.023.02 5.985.985.98 -0.0 -0.2 20.81±0.02plus-or-minus20.810.0220.81\pm{0.02} 1.0
30 J142555.9+353240 14:25:55.95 35:32:40.6 0.5″ 89.410.0+11.1subscriptsuperscript89.411.110.089.4^{+11.1}_{-10.0} 55.27.8+8.9subscriptsuperscript55.28.97.855.2^{+8.9}_{-7.8} 34.26.3+7.4subscriptsuperscript34.27.46.334.2^{+7.4}_{-6.3} TSH -0.230.11+0.12subscriptsuperscriptabsent0.120.11{}^{+0.12}_{-0.11} 6.836.836.83 1.581.581.58 6.136.136.13 0.1 0.2 23.06±0.05plus-or-minus23.060.0523.06\pm{0.05} 1.0
31 J142555.4+353650 14:25:55.40 35:36:50.4 0.7″ 15.34.3+5.5subscriptsuperscript15.35.54.315.3^{+5.5}_{-4.3} 11.93.6+4.8subscriptsuperscript11.94.83.611.9^{+4.8}_{-3.6} 3.42.3+3.6subscriptsuperscript3.43.62.33.4^{+3.6}_{-2.3} TS -0.560.25+0.33subscriptsuperscriptabsent0.330.25{}^{+0.33}_{-0.25} 1.131.131.13 0.330.330.33 0.580.580.58 0.4 -0.4 >>25.7
32 J142554.1+353237 14:25:54.11 35:32:37.1 0.5″ 95.710.1+11.2subscriptsuperscript95.711.210.195.7^{+11.2}_{-10.1} 52.17.4+8.5subscriptsuperscript52.18.57.452.1^{+8.5}_{-7.4} 43.66.9+8.0subscriptsuperscript43.68.06.943.6^{+8.0}_{-6.9} TSH -0.080.11+0.11subscriptsuperscriptabsent0.110.11{}^{+0.11}_{-0.11} 7.297.297.29 1.491.491.49 7.797.797.79 -0.1 -0.4 24.84±0.10plus-or-minus24.840.1024.84\pm{0.10} 0.9
33 J142553.8+353826 14:25:53.80 35:38:26.0 0.6″ 23.65.2+6.4subscriptsuperscript23.66.45.223.6^{+6.4}_{-5.2} 14.84.0+5.2subscriptsuperscript14.85.24.014.8^{+5.2}_{-4.0} 8.83.3+4.5subscriptsuperscript8.84.53.38.8^{+4.5}_{-3.3} TSH -0.250.23+0.26subscriptsuperscriptabsent0.260.23{}^{+0.26}_{-0.23} 1.751.751.75 0.410.410.41 1.531.531.53 -0.5 -0.5 24.44±0.10plus-or-minus24.440.1024.44\pm{0.10} 0.8
34 J142553.6+353314 14:25:53.68 35:33:14.9 0.3″ 95.810.2+11.3subscriptsuperscript95.811.310.295.8^{+11.3}_{-10.2} 76.79.0+10.1subscriptsuperscript76.710.19.076.7^{+10.1}_{-9.0} 19.14.7+5.8subscriptsuperscript19.15.84.719.1^{+5.8}_{-4.7} TSH -0.600.09+0.10subscriptsuperscriptabsent0.100.09{}^{+0.10}_{-0.09} 7.837.837.83 2.352.352.35 3.673.673.67 -0.0 -0.2 21.41±0.01plus-or-minus21.410.0121.41\pm{0.01} 1.0
35 J142552.7+353448 14:25:52.72 35:34:48.2 0.7″ 10.03.4+4.6subscriptsuperscript10.04.63.410.0^{+4.6}_{-3.4} 7.72.9+4.1subscriptsuperscript7.74.12.97.7^{+4.1}_{-2.9} 2.21.7+3.1subscriptsuperscript2.23.11.72.2^{+3.1}_{-1.7} TS -0.540.30+0.43subscriptsuperscriptabsent0.430.30{}^{+0.43}_{-0.30} 0.740.740.74 0.210.210.21 0.390.390.39 -0.3 0.2 25.21±0.27plus-or-minus25.210.2725.21\pm{0.27} 1.1
36 J142552.4+353730 14:25:52.45 35:37:30.3 0.5″ 15.24.3+5.5subscriptsuperscript15.25.54.315.2^{+5.5}_{-4.3} 10.63.4+4.6subscriptsuperscript10.64.63.410.6^{+4.6}_{-3.4} 4.62.5+3.8subscriptsuperscript4.63.82.54.6^{+3.8}_{-2.5} TS -0.390.28+0.34subscriptsuperscriptabsent0.340.28{}^{+0.34}_{-0.28} 1.111.111.11 0.290.290.29 0.780.780.78 -1.1 -0.6 25.80±0.27plus-or-minus25.800.2725.80\pm{0.27} 1.3
37 J142552.2+353823 14:25:52.27 35:38:23.7 0.4″ 53.47.7+8.8subscriptsuperscript53.48.87.753.4^{+8.8}_{-7.7} 7.42.9+4.1subscriptsuperscript7.44.12.97.4^{+4.1}_{-2.9} 46.07.1+8.2subscriptsuperscript46.08.27.146.0^{+8.2}_{-7.1} TH 0.720.13+0.10subscriptsuperscriptabsent0.100.13{}^{+0.10}_{-0.13} 4.104.104.10 0.210.210.21 8.238.238.23 b
38 J142551.3+353404 14:25:51.38 35:34:04.4 0.4″ 37.16.5+7.6subscriptsuperscript37.17.66.537.1^{+7.6}_{-6.5} 31.75.8+7.0subscriptsuperscript31.77.05.831.7^{+7.0}_{-5.8} 5.52.7+4.0subscriptsuperscript5.54.02.75.5^{+4.0}_{-2.7} TS -0.700.13+0.17subscriptsuperscriptabsent0.170.13{}^{+0.17}_{-0.13} 2.772.772.77 0.880.880.88 0.960.960.96 0.1 -0.1 17.38±0.00plus-or-minus17.380.0017.38\pm{0.00} 1.3
39 J142551.0+353307 14:25:51.00 35:33:07.2 0.8″ 23.25.3+6.5subscriptsuperscript23.26.55.323.2^{+6.5}_{-5.3} 16.24.3+5.5subscriptsuperscript16.25.54.316.2^{+5.5}_{-4.3} 7.03.1+4.3subscriptsuperscript7.04.33.17.0^{+4.3}_{-3.1} TS -0.390.23+0.26subscriptsuperscriptabsent0.260.23{}^{+0.26}_{-0.23} 1.801.801.80 0.470.470.47 1.281.281.28 0.0 -0.6 24.17±0.11plus-or-minus24.170.1124.17\pm{0.11} 1.0
40 J142550.8+353033 14:25:50.81 35:30:33.6 1.0″ 71.09.2+10.3subscriptsuperscript71.010.39.271.0^{+10.3}_{-9.2} 58.98.1+9.2subscriptsuperscript58.99.28.158.9^{+9.2}_{-8.1} 12.14.4+5.6subscriptsuperscript12.15.64.412.1^{+5.6}_{-4.4} TSH -0.660.11+0.13subscriptsuperscriptabsent0.130.11{}^{+0.13}_{-0.11} 5.735.735.73 1.781.781.78 2.282.282.28 0.2 -0.2 22.29±0.03plus-or-minus22.290.0322.29\pm{0.03} 1.0
41 J142550.6+353743 14:25:50.67 35:37:43.1 0.5″ 18.44.7+5.8subscriptsuperscript18.45.84.718.4^{+5.8}_{-4.7} 13.83.9+5.1subscriptsuperscript13.85.13.913.8^{+5.1}_{-3.9} 4.62.5+3.8subscriptsuperscript4.63.82.54.6^{+3.8}_{-2.5} TS -0.500.23+0.29subscriptsuperscriptabsent0.290.23{}^{+0.29}_{-0.23} 1.341.341.34 0.380.380.38 0.790.790.79 0.1 -0.0 23.45±0.06plus-or-minus23.450.0623.45\pm{0.06} 1.0
42 J142550.4+353247 14:25:50.49 35:32:47.9 0.8″ 26.15.5+6.7subscriptsuperscript26.16.75.526.1^{+6.7}_{-5.5} 20.14.7+5.8subscriptsuperscript20.15.84.720.1^{+5.8}_{-4.7} 6.02.9+4.1subscriptsuperscript6.04.12.96.0^{+4.1}_{-2.9} TS -0.530.19+0.24subscriptsuperscriptabsent0.240.19{}^{+0.24}_{-0.19} 2.062.062.06 0.600.600.60 1.121.121.12 0.0 -0.1 22.93±0.05plus-or-minus22.930.0522.93\pm{0.05} 1.0
43 J142549.9+353203 14:25:49.90 35:32:03.8 0.5″ 91.910.0+11.1subscriptsuperscript91.911.110.091.9^{+11.1}_{-10.0} 65.18.3+9.4subscriptsuperscript65.19.48.365.1^{+9.4}_{-8.3} 26.85.5+6.7subscriptsuperscript26.86.75.526.8^{+6.7}_{-5.5} TSH -0.410.10+0.11subscriptsuperscriptabsent0.110.10{}^{+0.11}_{-0.10} 7.827.827.82 2.072.072.07 5.375.375.37 0.1 -0.1 21.69±0.02plus-or-minus21.690.0221.69\pm{0.02} 1.1
44 J142549.8+353619 14:25:49.81 35:36:19.0 0.6″ 9.03.3+4.5subscriptsuperscript9.04.53.39.0^{+4.5}_{-3.3} 0.30.3+2.4subscriptsuperscript0.32.40.30.3^{+2.4}_{-0.3} 8.73.1+4.3subscriptsuperscript8.74.33.18.7^{+4.3}_{-3.1} TH 0.930.40+0.06subscriptsuperscriptabsent0.060.40{}^{+0.06}_{-0.40} 0.690.690.69 0.010.010.01 1.551.551.55 0.6 -0.4 23.05±0.07plus-or-minus23.050.0723.05\pm{0.07} 1.1
45 J142549.2+353615 14:25:49.26 35:36:15.3 0.6″ 8.53.3+4.5subscriptsuperscript8.54.53.38.5^{+4.5}_{-3.3} 6.12.7+4.0subscriptsuperscript6.14.02.76.1^{+4.0}_{-2.7} 2.41.7+3.1subscriptsuperscript2.43.11.72.4^{+3.1}_{-1.7} TS -0.440.35+0.48subscriptsuperscriptabsent0.480.35{}^{+0.48}_{-0.35} 0.620.620.62 0.170.170.17 0.400.400.40 0.3 0.1 >>25.7
46 J142548.5+353507 14:25:48.58 35:35:07.8 0.4″ 29.35.6+6.8subscriptsuperscript29.36.85.629.3^{+6.8}_{-5.6} 14.53.9+5.1subscriptsuperscript14.55.13.914.5^{+5.1}_{-3.9} 14.84.0+5.2subscriptsuperscript14.85.24.014.8^{+5.2}_{-4.0} TSH 0.020.22+0.21subscriptsuperscriptabsent0.210.22{}^{+0.21}_{-0.22} 2.142.142.14 0.400.400.40 2.552.552.55 -0.1 -0.4 25.61±0.32plus-or-minus25.610.3225.61\pm{0.32} 1.4
47 J142548.2+353041 14:25:48.21 35:30:41.1 0.4″ 162.213.3+14.4subscriptsuperscript162.214.413.3162.2^{+14.4}_{-13.3} 103.110.6+11.7subscriptsuperscript103.111.710.6103.1^{+11.7}_{-10.6} 59.18.1+9.2subscriptsuperscript59.19.28.159.1^{+9.2}_{-8.1} TSH -0.270.08+0.09subscriptsuperscriptabsent0.090.08{}^{+0.09}_{-0.08} 12.8612.8612.86 3.063.063.06 10.9810.9810.98 0.2 0.1 24.37±0.10plus-or-minus24.370.1024.37\pm{0.10} 0.7
48 J142547.6+353043 14:25:47.67 35:30:43.0 0.7″ 26.46.0+7.2subscriptsuperscript26.47.26.026.4^{+7.2}_{-6.0} 7.63.3+4.5subscriptsuperscript7.64.53.37.6^{+4.5}_{-3.3} 18.85.0+6.2subscriptsuperscript18.86.25.018.8^{+6.2}_{-5.0} TH 0.430.25+0.21subscriptsuperscriptabsent0.210.25{}^{+0.21}_{-0.25} 2.142.142.14 0.230.230.23 3.573.573.57 0.3 -0.4 22.61±0.04plus-or-minus22.610.0422.61\pm{0.04} 1.1
49 J142547.2+353728 14:25:47.25 35:37:28.0 0.9″ 6.12.5+3.8subscriptsuperscript6.13.82.56.1^{+3.8}_{-2.5} 3.21.7+3.1subscriptsuperscript3.23.11.73.2^{+3.1}_{-1.7} 2.91.7+3.1subscriptsuperscript2.93.11.72.9^{+3.1}_{-1.7} T -0.040.49+0.50subscriptsuperscriptabsent0.500.49{}^{+0.50}_{-0.49} 0.440.440.44 0.090.090.09 0.490.490.49 >>25.7
50 J142546.9+353240 14:25:46.95 35:32:40.3 0.5″ 55.47.7+8.8subscriptsuperscript55.48.87.755.4^{+8.8}_{-7.7} 44.36.9+8.0subscriptsuperscript44.38.06.944.3^{+8.0}_{-6.9} 11.13.4+4.6subscriptsuperscript11.14.63.411.1^{+4.6}_{-3.4} TSH -0.590.11+0.14subscriptsuperscriptabsent0.140.11{}^{+0.14}_{-0.11} 4.274.274.27 1.281.281.28 2.012.012.01 -0.0 -0.4 18.41±0.00plus-or-minus18.410.0018.41\pm{0.00} 2.0
51 J142546.3+353349 14:25:46.33 35:33:49.4 0.8″ 11.83.7+4.9subscriptsuperscript11.84.93.711.8^{+4.9}_{-3.7} 2.61.7+3.1subscriptsuperscript2.63.11.72.6^{+3.1}_{-1.7} 9.23.3+4.5subscriptsuperscript9.24.53.39.2^{+4.5}_{-3.3} T 0.560.37+0.26subscriptsuperscriptabsent0.260.37{}^{+0.26}_{-0.37} 0.900.900.90 0.070.070.07 1.651.651.65 >>25.7
52 J142546.1+353354 14:25:46.13 35:33:54.9 0.4″ 17.74.4+5.6subscriptsuperscript17.75.64.417.7^{+5.6}_{-4.4} 10.03.3+4.5subscriptsuperscript10.04.53.310.0^{+4.5}_{-3.3} 7.72.9+4.1subscriptsuperscript7.74.12.97.7^{+4.1}_{-2.9} TSH -0.120.28+0.29subscriptsuperscriptabsent0.290.28{}^{+0.29}_{-0.28} 1.411.411.41 0.300.300.30 1.441.441.44 0.1 -0.6 >>25.7
53 J142546.0+353826 14:25:46.02 35:38:26.3 0.5″ 25.05.2+6.4subscriptsuperscript25.06.45.225.0^{+6.4}_{-5.2} 10.03.3+4.5subscriptsuperscript10.04.53.310.0^{+4.5}_{-3.3} 15.04.0+5.2subscriptsuperscript15.05.24.015.0^{+5.2}_{-4.0} TSH 0.200.24+0.22subscriptsuperscriptabsent0.220.24{}^{+0.22}_{-0.24} 1.951.951.95 0.290.290.29 2.712.712.71 0.3 -0.8 25.55±0.27plus-or-minus25.550.2725.55\pm{0.27} 0.9
54 J142545.8+353849 14:25:45.85 35:38:49.2 0.4″ 29.15.7+6.9subscriptsuperscript29.16.95.729.1^{+6.9}_{-5.7} 18.94.4+5.6subscriptsuperscript18.95.64.418.9^{+5.6}_{-4.4} 10.23.6+4.8subscriptsuperscript10.24.83.610.2^{+4.8}_{-3.6} TSH -0.300.20+0.22subscriptsuperscriptabsent0.220.20{}^{+0.22}_{-0.20} 2.232.232.23 0.540.540.54 1.811.811.81 0.6 -0.3 21.63±0.02plus-or-minus21.630.0221.63\pm{0.02} 1.4
55 J142545.7+353228 14:25:45.78 35:32:28.4 0.7″ 20.44.9+6.1subscriptsuperscript20.46.14.920.4^{+6.1}_{-4.9} 20.64.7+5.8subscriptsuperscript20.65.84.720.6^{+5.8}_{-4.7} 0.00.0+2.8subscriptsuperscript0.02.80.00.0^{+2.8}_{-0.0} TS -1.000.00+0.21subscriptsuperscriptabsent0.210.00{}^{+0.21}_{-0.00} 1.541.541.54 0.580.580.58 <0.49absent0.49<0.49 0.1 -0.2 20.28±0.00plus-or-minus20.280.0020.28\pm{0.00} 1.0
56 J142545.6+353152 14:25:45.69 35:31:52.9 0.4″ 91.910.2+11.3subscriptsuperscript91.911.310.291.9^{+11.3}_{-10.2} 63.98.3+9.4subscriptsuperscript63.99.48.363.9^{+9.4}_{-8.3} 28.05.9+7.1subscriptsuperscript28.07.15.928.0^{+7.1}_{-5.9} TSH -0.380.11+0.12subscriptsuperscriptabsent0.120.11{}^{+0.12}_{-0.11} 7.307.307.30 1.901.901.90 5.245.245.24 -0.1 -0.0 21.96±0.02plus-or-minus21.960.0221.96\pm{0.02} 1.0
57 J142545.1+353616 14:25:45.17 35:36:16.3 0.8″ 6.32.5+3.8subscriptsuperscript6.33.82.56.3^{+3.8}_{-2.5} 2.11.4+2.8subscriptsuperscript2.12.81.42.1^{+2.8}_{-1.4} 4.22.0+3.3subscriptsuperscript4.23.32.04.2^{+3.3}_{-2.0} T 0.340.52+0.39subscriptsuperscriptabsent0.390.52{}^{+0.39}_{-0.52} 0.620.620.62 0.080.080.08 0.970.970.97 0.2 -0.5 25.13±0.24plus-or-minus25.130.2425.13\pm{0.24} 1.2
58 J142544.7+353954 14:25:44.70 35:39:54.1 0.8″ 23.25.2+6.4subscriptsuperscript23.26.45.223.2^{+6.4}_{-5.2} 13.84.0+5.2subscriptsuperscript13.85.24.013.8^{+5.2}_{-4.0} 9.33.3+4.5subscriptsuperscript9.34.53.39.3^{+4.5}_{-3.3} TSH -0.190.24+0.26subscriptsuperscriptabsent0.260.24{}^{+0.26}_{-0.24} 1.711.711.71 0.380.380.38 1.611.611.61 0.0 -0.2 22.55±0.03plus-or-minus22.550.0322.55\pm{0.03} 1.0
59 J142541.6+354107 14:25:41.66 35:41:07.2 0.7″ 35.36.6+7.8subscriptsuperscript35.37.86.635.3^{+7.8}_{-6.6} 24.45.3+6.5subscriptsuperscript24.46.55.324.4^{+6.5}_{-5.3} 10.83.9+5.1subscriptsuperscript10.85.13.910.8^{+5.1}_{-3.9} TS -0.380.18+0.21subscriptsuperscriptabsent0.210.18{}^{+0.21}_{-0.18} 2.792.792.79 0.730.730.73 2.012.012.01 0.4 0.5 24.57±0.19plus-or-minus24.570.1924.57\pm{0.19} 1.1
60 J142538.7+353342 14:25:38.73 35:33:42.1 0.4″ 14.54.2+5.3subscriptsuperscript14.55.34.214.5^{+5.3}_{-4.2} 7.42.7+4.0subscriptsuperscript7.44.02.77.4^{+4.0}_{-2.7} 7.23.1+4.3subscriptsuperscript7.24.33.17.2^{+4.3}_{-3.1} TSH -0.010.33+0.33subscriptsuperscriptabsent0.330.33{}^{+0.33}_{-0.33} 1.081.081.08 0.210.210.21 1.261.261.26 -0.0 -0.3 22.06±0.02plus-or-minus22.060.0222.06\pm{0.02} 1.1
61 J142538.5+353429 14:25:38.51 35:34:29.9 0.4″ 19.44.8+5.9subscriptsuperscript19.45.94.819.4^{+5.9}_{-4.8} 4.32.3+3.6subscriptsuperscript4.33.62.34.3^{+3.6}_{-2.3} 15.24.2+5.3subscriptsuperscript15.25.34.215.2^{+5.3}_{-4.2} TH 0.570.27+0.20subscriptsuperscriptabsent0.200.27{}^{+0.20}_{-0.27} 1.421.421.42 0.120.120.12 2.612.612.61 0.2 -0.4 22.58±0.03plus-or-minus22.580.0322.58\pm{0.03} 1.0
62 J142538.2+353438 14:25:38.29 35:34:38.0 0.4″ 21.64.8+5.9subscriptsuperscript21.65.94.821.6^{+5.9}_{-4.8} 14.73.9+5.1subscriptsuperscript14.75.13.914.7^{+5.1}_{-3.9} 6.92.7+4.0subscriptsuperscript6.94.02.76.9^{+4.0}_{-2.7} TSH -0.360.22+0.26subscriptsuperscriptabsent0.260.22{}^{+0.26}_{-0.22} 1.611.611.61 0.410.410.41 1.211.211.21 0.2 -0.2 23.56±0.07plus-or-minus23.560.0723.56\pm{0.07} 1.1
63 J142537.1+354309 14:25:37.15 35:43:09.8 1.3″ 44.68.0+9.1subscriptsuperscript44.69.18.044.6^{+9.1}_{-8.0} 34.96.5+7.7subscriptsuperscript34.97.76.534.9^{+7.7}_{-6.5} 9.74.5+5.7subscriptsuperscript9.75.74.59.7^{+5.7}_{-4.5} TS -0.560.16+0.19subscriptsuperscriptabsent0.190.16{}^{+0.19}_{-0.16} 3.603.603.60 1.061.061.06 1.841.841.84 0.5 -0.4 23.47±0.07plus-or-minus23.470.0723.47\pm{0.07} 1.1
64 J142536.9+353209 14:25:36.99 35:32:09.3 0.4″ 59.08.2+9.3subscriptsuperscript59.09.38.259.0^{+9.3}_{-8.2} 41.76.7+7.8subscriptsuperscript41.77.86.741.7^{+7.8}_{-6.7} 17.34.7+5.8subscriptsuperscript17.35.84.717.3^{+5.8}_{-4.7} TSH -0.410.13+0.15subscriptsuperscriptabsent0.150.13{}^{+0.15}_{-0.13} 4.584.584.58 1.211.211.21 3.163.163.16 0.4 -0.3 24.73±0.18plus-or-minus24.730.1824.73\pm{0.18} 1.1
65 J142535.9+354107 14:25:35.99 35:41:07.1 0.3″ 393.020.5+21.6subscriptsuperscript393.021.620.5393.0^{+21.6}_{-20.5} 275.117.1+18.1subscriptsuperscript275.118.117.1275.1^{+18.1}_{-17.1} 117.911.3+12.4subscriptsuperscript117.912.411.3117.9^{+12.4}_{-11.3} TSH -0.400.05+0.05subscriptsuperscriptabsent0.050.05{}^{+0.05}_{-0.05} 30.3930.3930.39 7.997.997.99 21.3121.3121.31 0.2 -0.2 20.20±0.01plus-or-minus20.200.0120.20\pm{0.01} 1.0
66 J142534.5+353551 14:25:34.52 35:35:51.3 0.4″ 8.22.9+4.1subscriptsuperscript8.24.12.98.2^{+4.1}_{-2.9} 6.32.5+3.8subscriptsuperscript6.33.82.56.3^{+3.8}_{-2.5} 1.91.4+2.8subscriptsuperscript1.92.81.41.9^{+2.8}_{-1.4} TS -0.540.30+0.46subscriptsuperscriptabsent0.460.30{}^{+0.46}_{-0.30} 0.780.780.78 0.220.220.22 0.410.410.41 0.1 0.1 20.68±0.01plus-or-minus20.680.0120.68\pm{0.01} 1.2
67 J142533.8+354138 14:25:33.80 35:41:38.1 0.7″ 96.810.5+11.6subscriptsuperscript96.811.610.596.8^{+11.6}_{-10.5} 70.98.9+10.0subscriptsuperscript70.910.08.970.9^{+10.0}_{-8.9} 25.85.5+6.7subscriptsuperscript25.86.75.525.8^{+6.7}_{-5.5} TSH -0.460.10+0.11subscriptsuperscriptabsent0.110.10{}^{+0.11}_{-0.10} 8.238.238.23 2.272.272.27 5.155.155.15 -0.1 -0.3 21.26±0.02plus-or-minus21.260.0221.26\pm{0.02} 1.0
68 J142533.0+353648 14:25:33.09 35:36:48.5 0.5″ 18.24.4+5.6subscriptsuperscript18.25.64.418.2^{+5.6}_{-4.4} 13.23.7+4.9subscriptsuperscript13.24.93.713.2^{+4.9}_{-3.7} 5.02.3+3.6subscriptsuperscript5.03.62.35.0^{+3.6}_{-2.3} TSH -0.450.22+0.28subscriptsuperscriptabsent0.280.22{}^{+0.28}_{-0.22} 2.202.202.20 0.600.600.60 1.401.401.40 0.2 -0.0 25.00±0.21plus-or-minus25.000.2125.00\pm{0.21} 0.8
69 J142531.1+353921 14:25:31.17 35:39:21.6 0.6″ 36.46.5+7.6subscriptsuperscript36.47.66.536.4^{+7.6}_{-6.5} 4.92.5+3.8subscriptsuperscript4.93.82.54.9^{+3.8}_{-2.5} 31.55.9+7.1subscriptsuperscript31.57.15.931.5^{+7.1}_{-5.9} TH 0.730.17+0.12subscriptsuperscriptabsent0.120.17{}^{+0.12}_{-0.17} 2.822.822.82 0.140.140.14 5.685.685.68 >>25.7
70 J142530.6+353420 14:25:30.63 35:34:20.3 0.3″ 48.37.2+8.3subscriptsuperscript48.38.37.248.3^{+8.3}_{-7.2} 34.56.0+7.2subscriptsuperscript34.57.26.034.5^{+7.2}_{-6.0} 13.83.9+5.1subscriptsuperscript13.85.13.913.8^{+5.1}_{-3.9} TSH -0.420.14+0.16subscriptsuperscriptabsent0.160.14{}^{+0.16}_{-0.14} 3.533.533.53 0.940.940.94 2.362.362.36 >>25.7
71 J142529.9+353640 14:25:29.91 35:36:40.0 0.4″ 16.94.3+5.5subscriptsuperscript16.95.54.316.9^{+5.5}_{-4.3} 12.93.7+4.9subscriptsuperscript12.94.93.712.9^{+4.9}_{-3.7} 4.02.0+3.3subscriptsuperscript4.03.32.04.0^{+3.3}_{-2.0} TS -0.530.22+0.29subscriptsuperscriptabsent0.290.22{}^{+0.29}_{-0.22} 1.291.291.29 0.370.370.37 0.700.700.70 0.1 -0.5 25.80±0.29plus-or-minus25.800.2925.80\pm{0.29} 0.8
72 J142529.2+353248 14:25:29.22 35:32:48.4 0.4″ 40.46.7+7.8subscriptsuperscript40.47.86.740.4^{+7.8}_{-6.7} 29.85.7+6.9subscriptsuperscript29.86.95.729.8^{+6.9}_{-5.7} 10.63.4+4.6subscriptsuperscript10.64.63.410.6^{+4.6}_{-3.4} TSH -0.470.15+0.18subscriptsuperscriptabsent0.180.15{}^{+0.18}_{-0.15} 3.043.043.04 0.840.840.84 1.871.871.87 >>25.7
73 J142526.6+353140 14:25:26.68 35:31:40.8 0.8″ 42.37.0+8.2subscriptsuperscript42.38.27.042.3^{+8.2}_{-7.0} 24.15.2+6.4subscriptsuperscript24.16.45.224.1^{+6.4}_{-5.2} 18.14.7+5.8subscriptsuperscript18.15.84.718.1^{+5.8}_{-4.7} TSH -0.130.18+0.19subscriptsuperscriptabsent0.190.18{}^{+0.19}_{-0.18} 3.293.293.29 0.700.700.70 3.323.323.32 >>25.7
74 J142525.7+353841 14:25:25.72 35:38:41.5 0.4″ 62.88.3+9.4subscriptsuperscript62.89.48.362.8^{+9.4}_{-8.3} 8.73.1+4.3subscriptsuperscript8.74.33.18.7^{+4.3}_{-3.1} 54.17.6+8.8subscriptsuperscript54.18.87.654.1^{+8.8}_{-7.6} TSH 0.720.12+0.09subscriptsuperscriptabsent0.090.12{}^{+0.09}_{-0.12} 4.664.664.66 0.240.240.24 9.339.339.33 0.6 -0.5 24.79±0.25plus-or-minus24.790.2524.79\pm{0.25} 1.9
75 J142524.7+353037 14:25:24.70 35:30:37.1 0.5″ 151.212.9+14.0subscriptsuperscript151.214.012.9151.2^{+14.0}_{-12.9} 117.311.2+12.3subscriptsuperscript117.312.311.2117.3^{+12.3}_{-11.2} 33.96.4+7.5subscriptsuperscript33.97.56.433.9^{+7.5}_{-6.4} TSH -0.540.07+0.08subscriptsuperscriptabsent0.080.07{}^{+0.08}_{-0.07} 12.3012.3012.30 3.573.573.57 6.496.496.49 0.7 0.1 23.46±0.07plus-or-minus23.460.0723.46\pm{0.07} 1.1
76 J142523.6+352824 14:25:23.69 35:28:24.5 0.7″ 301.718.0+19.1subscriptsuperscript301.719.118.0301.7^{+19.1}_{-18.0} 58.98.0+9.1subscriptsuperscript58.99.18.058.9^{+9.1}_{-8.0} 242.816.1+17.2subscriptsuperscript242.817.216.1242.8^{+17.2}_{-16.1} TSH 0.620.05+0.05subscriptsuperscriptabsent0.050.05{}^{+0.05}_{-0.05} 85.1785.1785.17 6.216.216.21 161.16161.16161.16 0.2 -0.1 18.51±0.00plus-or-minus18.510.0018.51\pm{0.00} 1.1
77 J142521.8+353407 14:25:21.87 35:34:07.8 0.5″ 35.36.4+7.5subscriptsuperscript35.37.56.435.3^{+7.5}_{-6.4} 20.14.7+5.8subscriptsuperscript20.15.84.720.1^{+5.8}_{-4.7} 15.24.3+5.5subscriptsuperscript15.25.54.315.2^{+5.5}_{-4.3} TSH -0.140.20+0.20subscriptsuperscriptabsent0.200.20{}^{+0.20}_{-0.20} 2.782.782.78 0.590.590.59 2.782.782.78 0.1 -0.4 25.61±0.29plus-or-minus25.610.2925.61\pm{0.29} 1.0
78 J142521.3+353029 14:25:21.38 35:30:29.5 0.9″ 51.68.1+9.2subscriptsuperscript51.69.28.151.6^{+9.2}_{-8.1} 15.14.5+5.7subscriptsuperscript15.15.74.515.1^{+5.7}_{-4.5} 36.56.7+7.8subscriptsuperscript36.57.86.736.5^{+7.8}_{-6.7} TSH 0.420.17+0.15subscriptsuperscriptabsent0.150.17{}^{+0.15}_{-0.17} 4.264.264.26 0.470.470.47 7.067.067.06 -0.4 -0.2 21.52±0.01plus-or-minus21.520.0121.52\pm{0.01} 1.1
79 J142517.7+353822 14:25:17.70 35:38:22.2 0.7″ 37.36.5+7.6subscriptsuperscript37.37.66.537.3^{+7.6}_{-6.5} 22.24.9+6.1subscriptsuperscript22.26.14.922.2^{+6.1}_{-4.9} 15.14.2+5.3subscriptsuperscript15.15.34.215.1^{+5.3}_{-4.2} TSH -0.190.18+0.19subscriptsuperscriptabsent0.190.18{}^{+0.19}_{-0.18} 2.832.832.83 0.630.630.63 2.672.672.67 0.5 -0.3 19.19±0.00plus-or-minus19.190.0019.19\pm{0.00} 1.8
80 J142514.3+353918 14:25:14.37 35:39:18.2 0.6″ 118.511.5+12.6subscriptsuperscript118.512.611.5118.5^{+12.6}_{-11.5} 71.78.8+9.9subscriptsuperscript71.79.98.871.7^{+9.9}_{-8.8} 46.87.4+8.5subscriptsuperscript46.88.57.446.8^{+8.5}_{-7.4} TSH -0.210.10+0.10subscriptsuperscriptabsent0.100.10{}^{+0.10}_{-0.10} 9.179.179.17 2.092.092.09 8.458.458.45 0.5 -0.9 23.71±0.09plus-or-minus23.710.0923.71\pm{0.09} 1.2
81 J142514.3+353618 14:25:14.34 35:36:18.8 0.4″ 102.910.6+11.7subscriptsuperscript102.911.710.6102.9^{+11.7}_{-10.6} 82.29.3+10.4subscriptsuperscript82.210.49.382.2^{+10.4}_{-9.3} 20.75.0+6.2subscriptsuperscript20.76.25.020.7^{+6.2}_{-5.0} TSH -0.590.09+0.10subscriptsuperscriptabsent0.100.09{}^{+0.10}_{-0.09} 7.837.837.83 2.342.342.34 3.683.683.68 0.1 -0.2 19.86±0.00plus-or-minus19.860.0019.86\pm{0.00} 1.2
82 J142513.1+353323 14:25:13.18 35:33:23.4 0.6″ 98.510.7+11.8subscriptsuperscript98.511.810.798.5^{+11.8}_{-10.7} 73.99.1+10.2subscriptsuperscript73.910.29.173.9^{+10.2}_{-9.1} 24.65.5+6.7subscriptsuperscript24.66.75.524.6^{+6.7}_{-5.5} TSH -0.500.10+0.11subscriptsuperscriptabsent0.110.10{}^{+0.11}_{-0.10} 8.188.188.18 2.302.302.30 4.774.774.77 0.4 -0.3 18.51±0.00plus-or-minus18.510.0018.51\pm{0.00} 1.4
83 J142512.0+353124 14:25:12.00 35:31:24.3 0.7″ 214.715.5+16.5subscriptsuperscript214.716.515.5214.7^{+16.5}_{-15.5} 165.113.4+14.5subscriptsuperscript165.114.513.4165.1^{+14.5}_{-13.4} 49.57.7+8.8subscriptsuperscript49.58.87.749.5^{+8.8}_{-7.7} TSH -0.530.06+0.07subscriptsuperscriptabsent0.070.06{}^{+0.07}_{-0.06} 17.7017.7017.70 5.095.095.09 9.579.579.57 0.6 0.1 20.86±0.01plus-or-minus20.860.0120.86\pm{0.01} 1.0
84 J142511.3+353857 14:25:11.32 35:38:57.8 0.6″ 121.611.8+12.9subscriptsuperscript121.612.911.8121.6^{+12.9}_{-11.8} 89.79.9+11.0subscriptsuperscript89.711.09.989.7^{+11.0}_{-9.9} 31.96.5+7.6subscriptsuperscript31.97.66.531.9^{+7.6}_{-6.5} TSH -0.470.09+0.10subscriptsuperscriptabsent0.100.09{}^{+0.10}_{-0.09} 9.499.499.49 2.632.632.63 5.825.825.82 -0.2 0.2 24.88±0.26plus-or-minus24.880.2624.88\pm{0.26} 1.5
85 J142509.3+354356 14:25:09.39 35:43:56.1 1.1″ 349.820.0+21.1subscriptsuperscript349.821.120.0349.8^{+21.1}_{-20.0} 267.417.2+18.3subscriptsuperscript267.418.317.2267.4^{+18.3}_{-17.2} 82.510.3+11.4subscriptsuperscript82.511.410.382.5^{+11.4}_{-10.3} TSH -0.520.05+0.05subscriptsuperscriptabsent0.050.05{}^{+0.05}_{-0.05} 41.9241.9241.92 12.0512.0512.05 23.3023.3023.30 0.2 -0.6 20.13±0.01plus-or-minus20.130.0120.13\pm{0.01} 1.2
86 J142504.5+354107 14:25:04.58 35:41:07.9 0.6″ 473.122.8+23.9subscriptsuperscript473.123.922.8473.1^{+23.9}_{-22.8} 338.319.1+20.2subscriptsuperscript338.320.219.1338.3^{+20.2}_{-19.1} 134.912.4+13.5subscriptsuperscript134.913.512.4134.9^{+13.5}_{-12.4} TSH -0.420.04+0.05subscriptsuperscriptabsent0.050.04{}^{+0.05}_{-0.04} 41.2141.2141.21 11.0811.0811.08 27.6527.6527.65 0.6 0.3 21.39±0.01plus-or-minus21.390.0121.39\pm{0.01} 1.1
87 J142457.1+353518 14:24:57.16 35:35:18.8 0.9″ 257.417.1+18.2subscriptsuperscript257.418.217.1257.4^{+18.2}_{-17.1} 197.914.7+15.8subscriptsuperscript197.915.814.7197.9^{+15.8}_{-14.7} 59.68.8+9.9subscriptsuperscript59.69.98.859.6^{+9.9}_{-8.8} TSH -0.530.06+0.06subscriptsuperscriptabsent0.060.06{}^{+0.06}_{-0.06} 24.8324.8324.83 7.157.157.15 13.5213.5213.52 0.5 -0.7 20.00±0.00plus-or-minus20.000.0020.00\pm{0.00} 1.0
88 J142618.8+354218 14:26:18.84 35:42:18.4 1.5″ 227.616.7+17.8subscriptsuperscript227.617.816.7227.6^{+17.8}_{-16.7} 156.913.3+14.4subscriptsuperscript156.914.413.3156.9^{+14.4}_{-13.3} 70.710.0+11.1subscriptsuperscript70.711.110.070.7^{+11.1}_{-10.0} TSH -0.370.07+0.07subscriptsuperscriptabsent0.070.07{}^{+0.07}_{-0.07} 26.9326.9326.93 6.976.976.97 19.7619.7619.76 0.9 0.1 20.89±0.01plus-or-minus20.890.0120.89\pm{0.01} 1.1
89 J142618.6+353754 14:26:18.60 35:37:54.2 2.2″ 39.88.3+9.4subscriptsuperscript39.89.48.339.8^{+9.4}_{-8.3} 9.14.0+5.2subscriptsuperscript9.15.24.09.1^{+5.2}_{-4.0} 30.77.2+8.3subscriptsuperscript30.78.37.230.7^{+8.3}_{-7.2} TH 0.550.21+0.17subscriptsuperscriptabsent0.170.21{}^{+0.17}_{-0.21} 3.243.243.24 0.280.280.28 5.865.865.86 -0.3 -0.7 21.77±0.02plus-or-minus21.770.0221.77\pm{0.02} 1.2
90 J142611.9+354230 14:26:11.92 35:42:30.5 1.7″ 80.011.0+12.1subscriptsuperscript80.012.111.080.0^{+12.1}_{-11.0} 62.48.8+9.9subscriptsuperscript62.49.98.862.4^{+9.9}_{-8.8} 17.66.6+7.8subscriptsuperscript17.67.86.617.6^{+7.8}_{-6.6} TS -0.560.13+0.14subscriptsuperscriptabsent0.140.13{}^{+0.14}_{-0.13} 9.289.289.28 2.722.722.72 4.804.804.80 0.6 -0.0 21.40±0.01plus-or-minus21.400.0121.40\pm{0.01} 1.0
91 J142610.8+354202 14:26:10.89 35:42:02.5 1.5″ 151.913.7+14.8subscriptsuperscript151.914.813.7151.9^{+14.8}_{-13.7} 45.47.6+8.8subscriptsuperscript45.48.87.645.4^{+8.8}_{-7.6} 106.611.3+12.4subscriptsuperscript106.612.411.3106.6^{+12.4}_{-11.3} TSH 0.410.09+0.08subscriptsuperscriptabsent0.080.09{}^{+0.08}_{-0.09} 17.4717.4717.47 1.961.961.96 28.8128.8128.81 1.1 -0.2 20.88±0.02plus-or-minus20.880.0220.88\pm{0.02} 1.3
92 J142606.7+353151 14:26:06.72 35:31:51.3 1.5″ 50.38.2+9.3subscriptsuperscript50.39.38.250.3^{+9.3}_{-8.2} 36.26.6+7.8subscriptsuperscript36.27.86.636.2^{+7.8}_{-6.6} 14.04.8+5.9subscriptsuperscript14.05.94.814.0^{+5.9}_{-4.8} TS -0.440.16+0.18subscriptsuperscriptabsent0.180.16{}^{+0.18}_{-0.16} 4.004.004.00 1.081.081.08 2.632.632.63 -0.3 0.3 24.70±0.21plus-or-minus24.700.2124.70\pm{0.21} 1.1
93 J142604.7+353015 14:26:04.78 35:30:15.3 1.7″ 75.89.9+11.0subscriptsuperscript75.811.09.975.8^{+11.0}_{-9.9} 34.66.5+7.6subscriptsuperscript34.67.66.534.6^{+7.6}_{-6.5} 41.37.4+8.5subscriptsuperscript41.38.57.441.3^{+8.5}_{-7.4} TSH 0.100.14+0.14subscriptsuperscriptabsent0.140.14{}^{+0.14}_{-0.14} 6.906.906.90 1.181.181.18 8.848.848.84 1.1 -0.2 21.15±0.01plus-or-minus21.150.0121.15\pm{0.01} 1.2
94 J142603.7+353246 14:26:03.73 35:32:46.2 1.6″ 15.05.0+6.2subscriptsuperscript15.06.25.015.0^{+6.2}_{-5.0} 6.02.9+4.1subscriptsuperscript6.04.12.96.0^{+4.1}_{-2.9} 9.04.0+5.2subscriptsuperscript9.05.24.09.0^{+5.2}_{-4.0} T 0.210.38+0.34subscriptsuperscriptabsent0.340.38{}^{+0.34}_{-0.38} 1.241.241.24 0.190.190.19 1.751.751.75 -0.4 0.1 21.83±0.02plus-or-minus21.830.0221.83\pm{0.02} 1.3
95 J142600.2+353442 14:26:00.24 35:34:42.4 0.8″ 17.34.5+5.7subscriptsuperscript17.35.74.517.3^{+5.7}_{-4.5} 0.00.0+1.9subscriptsuperscript0.01.90.00.0^{+1.9}_{-0.0} 18.34.5+5.7subscriptsuperscript18.35.74.518.3^{+5.7}_{-4.5} TH 1.000.18+0.00subscriptsuperscriptabsent0.000.18{}^{+0.00}_{-0.18} 1.341.341.34 <0.06absent0.06<0.06 3.313.313.31 0.3 -0.6 24.33±0.13plus-or-minus24.330.1324.33\pm{0.13} 1.1
96 J142558.1+353216 14:25:58.13 35:32:16.1 1.5″ 19.65.1+6.3subscriptsuperscript19.66.35.119.6^{+6.3}_{-5.1} 13.14.0+5.2subscriptsuperscript13.15.24.013.1^{+5.2}_{-4.0} 6.53.1+4.3subscriptsuperscript6.54.33.16.5^{+4.3}_{-3.1} TS -0.330.26+0.30subscriptsuperscriptabsent0.300.26{}^{+0.30}_{-0.26} 1.521.521.52 0.380.380.38 1.181.181.18 >>25.7
97 J142552.4+352724 14:25:52.47 35:27:24.1 1.8″ 88.110.8+11.9subscriptsuperscript88.111.910.888.1^{+11.9}_{-10.8} 50.67.7+8.8subscriptsuperscript50.68.87.750.6^{+8.8}_{-7.7} 37.57.5+8.6subscriptsuperscript37.58.67.537.5^{+8.6}_{-7.5} TSH -0.140.13+0.13subscriptsuperscriptabsent0.130.13{}^{+0.13}_{-0.13} 10.5510.5510.55 2.272.272.27 10.5810.5810.58 -0.6 -0.5 23.27±0.08plus-or-minus23.270.0823.27\pm{0.08} 1.0
98 J142551.4+353433 14:25:51.43 35:34:33.1 0.7″ 9.63.3+4.5subscriptsuperscript9.64.53.39.6^{+4.5}_{-3.3} 0.00.0+1.9subscriptsuperscript0.01.90.00.0^{+1.9}_{-0.0} 9.83.3+4.5subscriptsuperscript9.84.53.39.8^{+4.5}_{-3.3} TH 1.000.31+0.00subscriptsuperscriptabsent0.000.31{}^{+0.00}_{-0.31} 0.710.710.71 <0.05absent0.05<0.05 1.721.721.72 0.1 -0.1 24.57±0.18plus-or-minus24.570.1824.57\pm{0.18} 1.3
99 J142551.1+353015 14:25:51.16 35:30:15.7 1.5″ 20.65.7+6.9subscriptsuperscript20.66.95.720.6^{+6.9}_{-5.7} 16.14.5+5.7subscriptsuperscript16.15.74.516.1^{+5.7}_{-4.5} 4.53.4+4.6subscriptsuperscript4.54.63.44.5^{+4.6}_{-3.4} TS -0.560.26+0.32subscriptsuperscriptabsent0.320.26{}^{+0.32}_{-0.26} 1.621.621.62 0.480.480.48 0.830.830.83 0.1 0.2 25.68±0.28plus-or-minus25.680.2825.68\pm{0.28} 0.9
100 J142547.4+352720 14:25:47.43 35:27:20.2 1.4″ 179.714.8+15.9subscriptsuperscript179.715.914.8179.7^{+15.9}_{-14.8} 127.412.0+13.1subscriptsuperscript127.413.112.0127.4^{+13.1}_{-12.0} 52.38.7+9.8subscriptsuperscript52.39.88.752.3^{+9.8}_{-8.7} TSH -0.410.08+0.08subscriptsuperscriptabsent0.080.08{}^{+0.08}_{-0.08} 15.1415.1415.14 4.034.034.03 10.3810.3810.38 0.4 -0.3 19.87±0.00plus-or-minus19.870.0019.87\pm{0.00} 1.0
101 J142545.5+353003 14:25:45.53 35:30:03.6 1.3″ 22.85.6+6.8subscriptsuperscript22.86.85.622.8^{+6.8}_{-5.6} 11.73.7+4.9subscriptsuperscript11.74.93.711.7^{+4.9}_{-3.7} 11.04.2+5.3subscriptsuperscript11.05.34.211.0^{+5.3}_{-4.2} TS -0.030.28+0.27subscriptsuperscriptabsent0.270.28{}^{+0.27}_{-0.28} 1.851.851.85 0.360.360.36 2.112.112.11 0.7 0.6 23.73±0.09plus-or-minus23.730.0923.73\pm{0.09} 1.0
102 J142544.7+354046 14:25:44.77 35:40:46.6 1.1″ 20.44.9+6.1subscriptsuperscript20.46.14.920.4^{+6.1}_{-4.9} 6.42.7+4.0subscriptsuperscript6.44.02.76.4^{+4.0}_{-2.7} 14.04.0+5.2subscriptsuperscript14.05.24.014.0^{+5.2}_{-4.0} TH 0.380.28+0.23subscriptsuperscriptabsent0.230.28{}^{+0.23}_{-0.28} 1.611.611.61 0.190.190.19 2.612.612.61 0.1 -0.7 20.09±0.01plus-or-minus20.090.0120.09\pm{0.01} 1.2
103 J142544.2+354018 14:25:44.20 35:40:18.4 0.9″ 22.75.0+6.2subscriptsuperscript22.76.25.022.7^{+6.2}_{-5.0} 1.61.4+2.8subscriptsuperscript1.62.81.41.6^{+2.8}_{-1.4} 21.14.8+5.9subscriptsuperscript21.15.94.821.1^{+5.9}_{-4.8} TH 0.860.20+0.10subscriptsuperscriptabsent0.100.20{}^{+0.10}_{-0.20} 1.721.721.72 0.050.050.05 3.743.743.74 >>25.7
104 J142541.8+354249 14:25:41.80 35:42:49.7 1.3″ 42.37.3+8.4subscriptsuperscript42.38.47.342.3^{+8.4}_{-7.3} 24.15.2+6.4subscriptsuperscript24.16.45.224.1^{+6.4}_{-5.2} 18.25.0+6.2subscriptsuperscript18.26.25.018.2^{+6.2}_{-5.0} TSH -0.130.18+0.19subscriptsuperscriptabsent0.190.18{}^{+0.19}_{-0.18} 3.643.643.64 0.780.780.78 3.683.683.68 -0.9 0.6 21.49±0.02plus-or-minus21.490.0221.49\pm{0.02} 1.2
105 J142539.6+353942 14:25:39.65 35:39:42.6 0.8″ 18.34.5+5.7subscriptsuperscript18.35.74.518.3^{+5.7}_{-4.5} 11.33.4+4.6subscriptsuperscript11.34.63.411.3^{+4.6}_{-3.4} 7.02.9+4.1subscriptsuperscript7.04.12.97.0^{+4.1}_{-2.9} TS -0.240.27+0.29subscriptsuperscriptabsent0.290.27{}^{+0.29}_{-0.27} 1.371.371.37 0.320.320.32 1.211.211.21 0.4 -0.5 25.49±0.30plus-or-minus25.490.3025.49\pm{0.30} 1.1
106 J142536.8+353147 14:25:36.81 35:31:47.2 1.0″ 11.53.9+5.1subscriptsuperscript11.55.13.911.5^{+5.1}_{-3.9} 2.11.7+3.1subscriptsuperscript2.13.11.72.1^{+3.1}_{-1.7} 9.33.4+4.6subscriptsuperscript9.34.63.49.3^{+4.6}_{-3.4} TH 0.630.39+0.25subscriptsuperscriptabsent0.250.39{}^{+0.25}_{-0.39} 0.910.910.91 0.060.060.06 1.731.731.73 0.2 -0.2 24.88±0.21plus-or-minus24.880.2124.88\pm{0.21} 2.0
107 J142533.3+353130 14:25:33.33 35:31:30.6 0.8″ 20.75.2+6.4subscriptsuperscript20.76.45.220.7^{+6.4}_{-5.2} 5.32.5+3.8subscriptsuperscript5.33.82.55.3^{+3.8}_{-2.5} 15.44.5+5.7subscriptsuperscript15.45.74.515.4^{+5.7}_{-4.5} TH 0.490.28+0.22subscriptsuperscriptabsent0.220.28{}^{+0.22}_{-0.28} 1.591.591.59 0.150.150.15 2.782.782.78 0.5 -0.2 22.50±0.03plus-or-minus22.500.0322.50\pm{0.03} 1.0
108 J142532.6+352838 14:25:32.66 35:28:38.8 1.4″ 39.57.9+9.0subscriptsuperscript39.59.07.939.5^{+9.0}_{-7.9} 32.96.5+7.7subscriptsuperscript32.97.76.532.9^{+7.7}_{-6.5} 6.64.3+5.5subscriptsuperscript6.65.54.36.6^{+5.5}_{-4.3} TS -0.660.17+0.21subscriptsuperscriptabsent0.210.17{}^{+0.21}_{-0.17} 3.213.213.21 1.001.001.00 1.261.261.26 0.9 0.9 24.35±0.17plus-or-minus24.350.1724.35\pm{0.17} 1.4
109 J142531.4+354452 14:25:31.41 35:44:52.5 2.1″ 62.79.7+10.8subscriptsuperscript62.710.89.762.7^{+10.8}_{-9.7} 20.75.3+6.5subscriptsuperscript20.76.55.320.7^{+6.5}_{-5.3} 42.08.1+9.2subscriptsuperscript42.09.28.142.0^{+9.2}_{-8.1} TSH 0.350.16+0.15subscriptsuperscriptabsent0.150.16{}^{+0.15}_{-0.16} 5.355.355.35 0.660.660.66 8.498.498.49 -0.0 1.4 20.02±0.00plus-or-minus20.020.0020.02\pm{0.00} 1.2
110 J142530.8+353208 14:25:30.82 35:32:08.6 1.1″ 10.33.3+4.5subscriptsuperscript10.34.53.310.3^{+4.5}_{-3.3} 5.02.3+3.6subscriptsuperscript5.03.62.35.0^{+3.6}_{-2.3} 5.32.3+3.6subscriptsuperscript5.33.62.35.3^{+3.6}_{-2.3} T 0.030.38+0.37subscriptsuperscriptabsent0.370.38{}^{+0.37}_{-0.38} 1.311.311.31 0.240.240.24 1.581.581.58 -0.1 -0.4 20.91±0.01plus-or-minus20.910.0120.91\pm{0.01} 1.2
111 J142528.2+353958 14:25:28.24 35:39:58.4 0.9″ 21.15.0+6.2subscriptsuperscript21.16.25.021.1^{+6.2}_{-5.0} 3.82.3+3.6subscriptsuperscript3.83.62.33.8^{+3.6}_{-2.3} 17.34.4+5.6subscriptsuperscript17.35.64.417.3^{+5.6}_{-4.4} TH 0.640.26+0.19subscriptsuperscriptabsent0.190.26{}^{+0.19}_{-0.26} 1.581.581.58 0.110.110.11 3.013.013.01 0.5 -0.3 22.81±0.04plus-or-minus22.810.0422.81\pm{0.04} 1.0
112 J142527.5+354012 14:25:27.59 35:40:12.1 0.8″ 24.65.6+6.8subscriptsuperscript24.66.85.624.6^{+6.8}_{-5.6} 11.23.6+4.8subscriptsuperscript11.24.83.611.2^{+4.8}_{-3.6} 13.54.3+5.5subscriptsuperscript13.55.54.313.5^{+5.5}_{-4.3} TSH 0.100.26+0.25subscriptsuperscriptabsent0.250.26{}^{+0.25}_{-0.26} 1.891.891.89 0.320.320.32 2.412.412.41 >>25.7
113 J142527.4+353101 14:25:27.49 35:31:01.0 1.2″ 12.74.4+5.6subscriptsuperscript12.75.64.412.7^{+5.6}_{-4.4} 8.63.4+4.6subscriptsuperscript8.64.63.48.6^{+4.6}_{-3.4} 4.12.7+4.0subscriptsuperscript4.14.02.74.1^{+4.0}_{-2.7} TS -0.340.35+0.41subscriptsuperscriptabsent0.410.35{}^{+0.41}_{-0.35} 1.061.061.06 0.270.270.27 0.810.810.81 0.4 -0.1 20.38±0.02plus-or-minus20.380.0220.38\pm{0.02} 1.3
114 J142526.6+353327 14:25:26.66 35:33:27.2 0.7″ 10.83.7+4.9subscriptsuperscript10.84.93.710.8^{+4.9}_{-3.7} 8.33.1+4.3subscriptsuperscript8.34.33.18.3^{+4.3}_{-3.1} 2.52.0+3.3subscriptsuperscript2.53.32.02.5^{+3.3}_{-2.0} TS -0.530.31+0.42subscriptsuperscriptabsent0.420.31{}^{+0.42}_{-0.31} 0.840.840.84 0.240.240.24 0.460.460.46 -1.0 -0.1 24.91±0.15plus-or-minus24.910.1524.91\pm{0.15} 1.2
115 J142524.2+352928 14:25:24.22 35:29:28.6 1.4″ 44.87.9+9.0subscriptsuperscript44.89.07.944.8^{+9.0}_{-7.9} 25.95.5+6.7subscriptsuperscript25.96.75.525.9^{+6.7}_{-5.5} 18.95.5+6.7subscriptsuperscript18.96.75.518.9^{+6.7}_{-5.5} TSH -0.140.19+0.19subscriptsuperscriptabsent0.190.19{}^{+0.19}_{-0.19} 4.004.004.00 0.860.860.86 4.014.014.01 >>25.7
116 J142523.8+354122 14:25:23.80 35:41:22.4 0.8″ 52.78.1+9.2subscriptsuperscript52.79.28.152.7^{+9.2}_{-8.1} 41.96.9+8.0subscriptsuperscript41.98.06.941.9^{+8.0}_{-6.9} 10.84.2+5.3subscriptsuperscript10.85.34.210.8^{+5.3}_{-4.2} TS -0.590.13+0.16subscriptsuperscriptabsent0.160.13{}^{+0.16}_{-0.13} 4.264.264.26 1.271.271.27 2.042.042.04 0.0 0.2 22.98±0.04plus-or-minus22.980.0422.98\pm{0.04} 1.0
117 J142523.6+353216 14:25:23.69 35:32:16.7 1.1″ 26.55.5+6.7subscriptsuperscript26.56.75.526.5^{+6.7}_{-5.5} 11.43.7+4.9subscriptsuperscript11.44.93.711.4^{+4.9}_{-3.7} 15.04.0+5.2subscriptsuperscript15.05.24.015.0^{+5.2}_{-4.0} TSH 0.140.24+0.23subscriptsuperscriptabsent0.230.24{}^{+0.23}_{-0.24} 2.062.062.06 0.330.330.33 2.742.742.74 0.6 -0.5 25.34±0.27plus-or-minus25.340.2725.34\pm{0.27} 0.8
118 J142523.0+354313 14:25:23.00 35:43:13.4 1.1″ 104.311.5+12.6subscriptsuperscript104.312.611.5104.3^{+12.6}_{-11.5} 66.88.7+9.8subscriptsuperscript66.89.88.766.8^{+9.8}_{-8.7} 37.57.4+8.5subscriptsuperscript37.58.57.437.5^{+8.5}_{-7.4} TSH -0.280.11+0.12subscriptsuperscriptabsent0.120.11{}^{+0.12}_{-0.11} 8.288.288.28 1.991.991.99 7.007.007.00 0.3 0.8 21.42±0.02plus-or-minus21.420.0221.42\pm{0.02} 1.0
119 J142522.8+353116 14:25:22.82 35:31:16.8 1.0″ 28.95.9+7.1subscriptsuperscript28.97.15.928.9^{+7.1}_{-5.9} 4.62.5+3.8subscriptsuperscript4.63.82.54.6^{+3.8}_{-2.5} 24.35.3+6.5subscriptsuperscript24.36.55.324.3^{+6.5}_{-5.3} TH 0.680.21+0.15subscriptsuperscriptabsent0.150.21{}^{+0.15}_{-0.21} 2.442.442.44 0.150.150.15 4.794.794.79 0.7 -0.2 23.41±0.07plus-or-minus23.410.0723.41\pm{0.07} 1.1
120 J142522.4+353517 14:25:22.40 35:35:17.2 0.6″ 10.63.6+4.8subscriptsuperscript10.64.83.610.6^{+4.8}_{-3.6} 3.22.0+3.3subscriptsuperscript3.23.32.03.2^{+3.3}_{-2.0} 7.42.9+4.1subscriptsuperscript7.44.12.97.4^{+4.1}_{-2.9} T 0.400.41+0.32subscriptsuperscriptabsent0.320.41{}^{+0.32}_{-0.41} 0.810.810.81 0.090.090.09 1.321.321.32 >>25.7
121 J142521.1+353340 14:25:21.10 35:33:40.0 0.7″ 16.34.4+5.6subscriptsuperscript16.35.64.416.3^{+5.6}_{-4.4} 14.14.0+5.2subscriptsuperscript14.15.24.014.1^{+5.2}_{-4.0} 2.21.7+3.1subscriptsuperscript2.23.11.72.2^{+3.1}_{-1.7} TS -0.730.18+0.29subscriptsuperscriptabsent0.290.18{}^{+0.29}_{-0.18} 1.591.591.59 0.510.510.51 0.500.500.50 0.0 -0.6 25.03±0.21plus-or-minus25.030.2125.03\pm{0.21} 1.1
122 J142517.6+353453 14:25:17.61 35:34:53.0 0.5″ 19.14.8+5.9subscriptsuperscript19.15.94.819.1^{+5.9}_{-4.8} 11.53.6+4.8subscriptsuperscript11.54.83.611.5^{+4.8}_{-3.6} 7.63.1+4.3subscriptsuperscript7.64.33.17.6^{+4.3}_{-3.1} TS -0.200.27+0.29subscriptsuperscriptabsent0.290.27{}^{+0.29}_{-0.27} 1.441.441.44 0.330.330.33 1.341.341.34 0.7 0.3 24.03±0.11plus-or-minus24.030.1124.03\pm{0.11} 1.0
-0.2 -1.3 25.08±0.09plus-or-minus25.080.0925.08\pm{0.09} 1.3
123 J142516.6+354129 14:25:16.67 35:41:29.6 1.3″ 45.87.5+8.6subscriptsuperscript45.88.67.545.8^{+8.6}_{-7.5} 33.16.1+7.2subscriptsuperscript33.17.26.133.1^{+7.2}_{-6.1} 12.74.3+5.5subscriptsuperscript12.75.54.312.7^{+5.5}_{-4.3} TS -0.440.16+0.18subscriptsuperscriptabsent0.180.16{}^{+0.18}_{-0.16} 3.603.603.60 0.980.980.98 2.342.342.34 0.2 0.1 22.49±0.04plus-or-minus22.490.0422.49\pm{0.04} 1.2
124 J142516.4+352940 14:25:16.43 35:29:40.7 1.2″ 70.99.6+10.7subscriptsuperscript70.910.79.670.9^{+10.7}_{-9.6} 47.57.4+8.5subscriptsuperscript47.58.57.447.5^{+8.5}_{-7.4} 23.46.1+7.2subscriptsuperscript23.47.26.123.4^{+7.2}_{-6.1} TSH -0.330.14+0.15subscriptsuperscriptabsent0.150.14{}^{+0.15}_{-0.14} 6.166.166.16 1.541.541.54 4.784.784.78 0.2 0.8 21.31±0.01plus-or-minus21.310.0121.31\pm{0.01} 1.2
125 J142516.0+353142 14:25:16.00 35:31:42.3 1.1″ 11.64.5+5.7subscriptsuperscript11.65.74.511.6^{+5.7}_{-4.5} 7.13.1+4.3subscriptsuperscript7.14.33.17.1^{+4.3}_{-3.1} 4.53.3+4.5subscriptsuperscript4.54.53.34.5^{+4.5}_{-3.3} T -0.220.43+0.45subscriptsuperscriptabsent0.450.43{}^{+0.45}_{-0.43} 0.970.970.97 0.220.220.22 0.890.890.89 -0.1 -0.8 24.29±0.16plus-or-minus24.290.1624.29\pm{0.16} 1.0
126 J142514.9+354004 14:25:14.90 35:40:04.1 0.9″ 48.17.8+8.9subscriptsuperscript48.18.97.848.1^{+8.9}_{-7.8} 31.36.0+7.2subscriptsuperscript31.37.26.031.3^{+7.2}_{-6.0} 16.84.9+6.1subscriptsuperscript16.86.14.916.8^{+6.1}_{-4.9} TSH -0.300.16+0.18subscriptsuperscriptabsent0.180.16{}^{+0.18}_{-0.16} 3.743.743.74 0.920.920.92 3.063.063.06 1.0 0.2 22.91±0.05plus-or-minus22.910.0522.91\pm{0.05} 1.2
127 J142510.9+353602 14:25:10.94 35:36:02.8 1.0″ 39.76.9+8.0subscriptsuperscript39.78.06.939.7^{+8.0}_{-6.9} 16.44.3+5.5subscriptsuperscript16.45.54.316.4^{+5.5}_{-4.3} 23.25.3+6.5subscriptsuperscript23.26.55.323.2^{+6.5}_{-5.3} TSH 0.180.19+0.18subscriptsuperscriptabsent0.180.19{}^{+0.18}_{-0.19} 3.083.083.08 0.480.480.48 4.214.214.21 -0.9 0.3 22.67±0.05plus-or-minus22.670.0522.67\pm{0.05} 1.0
128 J142510.1+353411 14:25:10.19 35:34:11.4 0.9″ 50.47.8+8.9subscriptsuperscript50.48.97.850.4^{+8.9}_{-7.8} 31.25.9+7.1subscriptsuperscript31.27.15.931.2^{+7.1}_{-5.9} 19.25.0+6.2subscriptsuperscript19.26.25.019.2^{+6.2}_{-5.0} TSH -0.230.16+0.17subscriptsuperscriptabsent0.170.16{}^{+0.17}_{-0.16} 3.943.943.94 0.910.910.91 3.513.513.51 -0.6 0.1 21.87±0.02plus-or-minus21.870.0221.87\pm{0.02} 1.2
129 J142509.5+354244 14:25:09.51 35:42:44.9 2.1″ 71.210.3+11.5subscriptsuperscript71.211.510.371.2^{+11.5}_{-10.3} 15.25.1+6.3subscriptsuperscript15.26.35.115.2^{+6.3}_{-5.1} 56.09.0+10.1subscriptsuperscript56.010.19.056.0^{+10.1}_{-9.0} TH 0.580.14+0.12subscriptsuperscriptabsent0.120.14{}^{+0.12}_{-0.14} 7.457.457.45 0.600.600.60 13.8013.8013.80 -0.8 2.0 20.77±0.01plus-or-minus20.770.0120.77\pm{0.01} 1.4
130 J142509.5+353747 14:25:09.50 35:37:47.5 0.6″ 110.911.3+12.4subscriptsuperscript110.912.411.3110.9^{+12.4}_{-11.3} 32.66.1+7.2subscriptsuperscript32.67.26.132.6^{+7.2}_{-6.1} 78.39.5+10.6subscriptsuperscript78.310.69.578.3^{+10.6}_{-9.5} TSH 0.420.10+0.09subscriptsuperscriptabsent0.090.10{}^{+0.09}_{-0.10} 8.628.628.62 0.950.950.95 14.2414.2414.24 0.5 -0.1 21.93±0.01plus-or-minus21.930.0121.93\pm{0.01} 1.2
131 J142509.2+353527 14:25:09.23 35:35:27.5 0.8″ 71.09.0+10.1subscriptsuperscript71.010.19.071.0^{+10.1}_{-9.0} 9.23.4+4.6subscriptsuperscript9.24.63.49.2^{+4.6}_{-3.4} 61.88.3+9.4subscriptsuperscript61.89.48.361.8^{+9.4}_{-8.3} TSH 0.740.11+0.09subscriptsuperscriptabsent0.090.11{}^{+0.09}_{-0.11} 5.535.535.53 0.270.270.27 11.2411.2411.24 -0.3 -0.0 20.85±0.01plus-or-minus20.850.0120.85\pm{0.01} 1.0
132 J142505.1+354054 14:25:05.16 35:40:54.9 0.8″ 205.015.3+16.4subscriptsuperscript205.016.415.3205.0^{+16.4}_{-15.3} 131.212.1+13.2subscriptsuperscript131.213.212.1131.2^{+13.2}_{-12.1} 73.89.3+10.4subscriptsuperscript73.810.49.373.8^{+10.4}_{-9.3} TSH -0.270.07+0.08subscriptsuperscriptabsent0.080.07{}^{+0.08}_{-0.07} 17.7217.7217.72 4.274.274.27 15.0115.0115.01 -0.5 0.6 22.59±0.04plus-or-minus22.590.0422.59\pm{0.04} 1.0
133 J142504.4+353514 14:25:04.47 35:35:14.6 1.5″ 39.97.5+8.6subscriptsuperscript39.98.67.539.9^{+8.6}_{-7.5} 26.75.6+6.8subscriptsuperscript26.76.85.626.7^{+6.8}_{-5.6} 13.24.9+6.1subscriptsuperscript13.26.14.913.2^{+6.1}_{-4.9} TS -0.330.19+0.21subscriptsuperscriptabsent0.210.19{}^{+0.21}_{-0.19} 3.173.173.17 0.800.800.80 2.452.452.45 0.3 -0.7 23.16±0.06plus-or-minus23.160.0623.16\pm{0.06} 1.0
134 J142503.9+353345 14:25:03.90 35:33:45.7 1.5″ 42.47.6+8.7subscriptsuperscript42.48.77.642.4^{+8.7}_{-7.6} 13.54.3+5.5subscriptsuperscript13.55.54.313.5^{+5.5}_{-4.3} 28.96.2+7.3subscriptsuperscript28.97.36.228.9^{+7.3}_{-6.2} TSH 0.370.19+0.17subscriptsuperscriptabsent0.170.19{}^{+0.17}_{-0.19} 4.404.404.40 0.520.520.52 7.047.047.04 -0.9 -0.2 20.29±0.00plus-or-minus20.290.0020.29\pm{0.00} 1.0
135 J142503.1+353421 14:25:03.16 35:34:21.2 1.2″ 60.39.0+10.1subscriptsuperscript60.310.19.060.3^{+10.1}_{-9.0} 13.54.7+5.8subscriptsuperscript13.55.84.713.5^{+5.8}_{-4.7} 46.87.7+8.8subscriptsuperscript46.88.87.746.8^{+8.8}_{-7.7} TSH 0.560.15+0.13subscriptsuperscriptabsent0.130.15{}^{+0.13}_{-0.15} 4.854.854.85 0.410.410.41 8.828.828.82 1.1 0.5 >>25.7
136 J142502.9+353512 14:25:02.94 35:35:12.8 1.0″ 112.111.6+12.7subscriptsuperscript112.112.711.6112.1^{+12.7}_{-11.6} 69.98.9+10.0subscriptsuperscript69.910.08.969.9^{+10.0}_{-8.9} 42.27.3+8.5subscriptsuperscript42.28.57.342.2^{+8.5}_{-7.3} TSH -0.240.11+0.11subscriptsuperscriptabsent0.110.11{}^{+0.11}_{-0.11} 9.089.089.08 2.122.122.12 8.008.008.00 -0.6 -0.2 25.11±0.31plus-or-minus25.110.3125.11\pm{0.31} 1.1
137 J142501.2+353622 14:25:01.20 35:36:22.0 1.2″ 93.510.8+11.9subscriptsuperscript93.511.910.893.5^{+11.9}_{-10.8} 66.58.8+9.9subscriptsuperscript66.59.98.866.5^{+9.9}_{-8.8} 27.16.3+7.4subscriptsuperscript27.17.46.327.1^{+7.4}_{-6.3} TSH -0.420.11+0.12subscriptsuperscriptabsent0.120.11{}^{+0.12}_{-0.11} 7.827.827.82 2.082.082.08 5.315.315.31 0.5 0.0 23.12±0.05plus-or-minus23.120.0523.12\pm{0.05} 1.0
138 J142457.3+353627 14:24:57.33 35:36:27.5 1.2″ 93.511.0+12.1subscriptsuperscript93.512.111.093.5^{+12.1}_{-11.0} 45.37.5+8.6subscriptsuperscript45.38.67.545.3^{+8.6}_{-7.5} 48.18.1+9.2subscriptsuperscript48.19.28.148.1^{+9.2}_{-8.1} TSH 0.040.13+0.12subscriptsuperscriptabsent0.120.13{}^{+0.12}_{-0.13} 7.637.637.63 1.391.391.39 9.249.249.24 0.5 0.2 >>25.7
139 J142454.8+353431 14:24:54.80 35:34:31.9 0.9″ 250.317.2+18.3subscriptsuperscript250.318.317.2250.3^{+18.3}_{-17.2} 157.613.3+14.4subscriptsuperscript157.614.413.3157.6^{+14.4}_{-13.3} 92.710.9+12.0subscriptsuperscript92.712.010.992.7^{+12.0}_{-10.9} TSH -0.250.07+0.07subscriptsuperscriptabsent0.070.07{}^{+0.07}_{-0.07} 22.7322.7322.73 5.365.365.36 19.8319.8319.83 0.2 -0.7 20.50±0.01plus-or-minus20.500.0120.50\pm{0.01} 1.1
140 J142616.9+353729 14:26:16.94 35:37:29.4 1.9″ 71.19.8+10.9subscriptsuperscript71.110.99.871.1^{+10.9}_{-9.8} 23.45.7+6.9subscriptsuperscript23.46.95.723.4^{+6.9}_{-5.7} 47.67.9+9.0subscriptsuperscript47.69.07.947.6^{+9.0}_{-7.9} TSH 0.350.15+0.13subscriptsuperscriptabsent0.130.15{}^{+0.13}_{-0.15} 5.915.915.91 0.730.730.73 9.299.299.29 0.9 0.7 23.11±0.06plus-or-minus23.110.0623.11\pm{0.06} 1.5
141 J142613.9+353445 14:26:13.97 35:34:45.5 1.6″ 35.47.5+8.6subscriptsuperscript35.48.67.535.4^{+8.6}_{-7.5} 26.65.7+6.9subscriptsuperscript26.66.95.726.6^{+6.9}_{-5.7} 8.84.8+5.9subscriptsuperscript8.85.94.88.8^{+5.9}_{-4.8} TS -0.500.21+0.24subscriptsuperscriptabsent0.240.21{}^{+0.24}_{-0.21} 2.812.812.81 0.790.790.79 1.641.641.64 >>25.7
142 J142601.7+354037 14:26:01.72 35:40:37.5 1.3″ 19.45.4+6.6subscriptsuperscript19.46.65.419.4^{+6.6}_{-5.4} 12.43.9+5.1subscriptsuperscript12.45.13.912.4^{+5.1}_{-3.9} 7.03.7+4.9subscriptsuperscript7.04.93.77.0^{+4.9}_{-3.7} TS -0.280.30+0.32subscriptsuperscriptabsent0.320.30{}^{+0.32}_{-0.30} 1.851.851.85 0.440.440.44 1.561.561.56 0.2 -0.8 23.55±0.09plus-or-minus23.550.0923.55\pm{0.09} 1.0
143 J142601.7+352802 14:26:01.71 35:28:02.8 2.7″ 17.86.7+7.8subscriptsuperscript17.87.86.717.8^{+7.8}_{-6.7} 7.44.0+5.2subscriptsuperscript7.45.24.07.4^{+5.2}_{-4.0} 10.45.3+6.5subscriptsuperscript10.46.55.310.4^{+6.5}_{-5.3} T 0.170.42+0.37subscriptsuperscriptabsent0.370.42{}^{+0.37}_{-0.42} 2.142.142.14 0.330.330.33 2.932.932.93 0.8 0.3 23.11±0.06plus-or-minus23.110.0623.11\pm{0.06} 1.8
144 J142530.9+352756 14:25:30.95 35:27:56.8 2.4″ 17.75.1+6.3subscriptsuperscript17.76.35.117.7^{+6.3}_{-5.1} 14.64.2+5.3subscriptsuperscript14.65.34.214.6^{+5.3}_{-4.2} 3.12.9+4.1subscriptsuperscript3.14.12.93.1^{+4.1}_{-2.9} TS -0.640.26+0.33subscriptsuperscriptabsent0.330.26{}^{+0.33}_{-0.26} 5.165.165.16 1.581.581.58 2.152.152.15 0.6 -0.9 20.75±0.01plus-or-minus20.750.0120.75\pm{0.01} 1.3
145 J142527.5+352656 14:25:27.53 35:26:56.2 3.1″ 21.85.6+6.8subscriptsuperscript21.86.85.621.8^{+6.8}_{-5.6} 18.34.7+5.8subscriptsuperscript18.35.84.718.3^{+5.8}_{-4.7} 3.53.1+4.3subscriptsuperscript3.54.33.13.5^{+4.3}_{-3.1} TS -0.670.22+0.29subscriptsuperscriptabsent0.290.22{}^{+0.29}_{-0.22} 6.056.056.05 1.901.901.90 2.292.292.29 -0.3 0.9 17.44±0.00plus-or-minus17.440.0017.44\pm{0.00} 1.1
146 J142524.4+352542 14:25:24.40 35:25:42.1 2.5″ 61.38.6+9.7subscriptsuperscript61.39.78.661.3^{+9.7}_{-8.6} 39.26.6+7.8subscriptsuperscript39.27.86.639.2^{+7.8}_{-6.6} 22.05.4+6.6subscriptsuperscript22.06.65.422.0^{+6.6}_{-5.4} TS -0.270.14+0.15subscriptsuperscriptabsent0.150.14{}^{+0.15}_{-0.14} 18.4418.4418.44 4.424.424.42 15.7315.7315.73 -0.7 -0.4 21.50±0.01plus-or-minus21.500.0121.50\pm{0.01} 1.0
147 J142519.7+354432 14:25:19.79 35:44:32.2 2.1″ 70.710.0+11.1subscriptsuperscript70.711.110.070.7^{+11.1}_{-10.0} 50.77.9+9.0subscriptsuperscript50.79.07.950.7^{+9.0}_{-7.9} 20.06.2+7.3subscriptsuperscript20.07.36.220.0^{+7.3}_{-6.2} TS -0.430.14+0.15subscriptsuperscriptabsent0.150.14{}^{+0.15}_{-0.14} 7.447.447.44 2.012.012.01 4.984.984.98 -0.5 0.4 21.89±0.02plus-or-minus21.890.0221.89\pm{0.02} 1.0
148 J142517.7+353754 14:25:17.71 35:37:54.3 1.1″ 11.43.7+4.9subscriptsuperscript11.44.93.711.4^{+4.9}_{-3.7} 1.21.2+2.8subscriptsuperscript1.22.81.21.2^{+2.8}_{-1.2} 10.23.4+4.6subscriptsuperscript10.24.63.410.2^{+4.6}_{-3.4} T 0.790.37+0.18subscriptsuperscriptabsent0.180.37{}^{+0.18}_{-0.37} 1.401.401.40 0.050.050.05 2.922.922.92 0.7 -0.6 24.48±0.17plus-or-minus24.480.1724.48\pm{0.17} 1.3
149 J142516.0+354325 14:25:16.02 35:43:25.8 2.3″ 17.67.1+8.2subscriptsuperscript17.68.27.117.6^{+8.2}_{-7.1} 21.15.5+6.7subscriptsuperscript21.16.75.521.1^{+6.7}_{-5.5} 0.00.0+5.6subscriptsuperscript0.05.60.00.0^{+5.6}_{-0.0} TS -1.000.00+0.38subscriptsuperscriptabsent0.380.00{}^{+0.38}_{-0.00} 1.431.431.43 0.640.640.64 <1.07absent1.07<1.07 >>25.7
150 J142505.2+353729 14:25:05.25 35:37:29.5 1.6″ 21.65.7+6.9subscriptsuperscript21.66.95.721.6^{+6.9}_{-5.7} 19.34.9+6.1subscriptsuperscript19.36.14.919.3^{+6.1}_{-4.9} 2.32.3+4.1subscriptsuperscript2.34.12.32.3^{+4.1}_{-2.3} TS -0.780.17+0.29subscriptsuperscriptabsent0.290.17{}^{+0.29}_{-0.17} 1.781.781.78 0.600.600.60 0.450.450.45 0.2 -0.2 >>25.7
151 J142503.5+353859 14:25:03.57 35:38:59.2 1.7″ 37.77.2+8.3subscriptsuperscript37.78.37.237.7^{+8.3}_{-7.2} 22.65.1+6.3subscriptsuperscript22.66.35.122.6^{+6.3}_{-5.1} 15.05.0+6.2subscriptsuperscript15.06.25.015.0^{+6.2}_{-5.0} TS -0.200.20+0.21subscriptsuperscriptabsent0.210.20{}^{+0.21}_{-0.20} 3.093.093.09 0.700.700.70 2.902.902.90 -0.6 -0.2 20.26±0.01plus-or-minus20.260.0120.26\pm{0.01} 1.2
152 J142501.5+354000 14:25:01.58 35:40:00.3 1.9″ 52.28.5+9.6subscriptsuperscript52.29.68.552.2^{+9.6}_{-8.5} 35.06.5+7.6subscriptsuperscript35.07.66.535.0^{+7.6}_{-6.5} 17.25.4+6.6subscriptsuperscript17.26.65.417.2^{+6.6}_{-5.4} TS -0.340.16+0.18subscriptsuperscriptabsent0.180.16{}^{+0.18}_{-0.16} 4.264.264.26 1.071.071.07 3.303.303.30 1.0 -1.6 23.70±0.08plus-or-minus23.700.0823.70\pm{0.08} 1.0
153 J142501.2+353057 14:25:01.28 35:30:57.4 2.2″ 36.68.0+9.1subscriptsuperscript36.69.18.036.6^{+9.1}_{-8.0} 15.14.9+6.1subscriptsuperscript15.16.14.915.1^{+6.1}_{-4.9} 21.56.3+7.4subscriptsuperscript21.57.46.321.5^{+7.4}_{-6.3} TSH 0.180.24+0.22subscriptsuperscriptabsent0.220.24{}^{+0.22}_{-0.24} 3.543.543.54 0.550.550.55 4.904.904.90 -1.7 0.1 23.91±0.08plus-or-minus23.910.0823.91\pm{0.08} 1.0
154 J142459.2+353751 14:24:59.24 35:37:51.4 1.8″ 35.47.3+8.5subscriptsuperscript35.48.57.335.4^{+8.5}_{-7.3} 21.55.4+6.6subscriptsuperscript21.56.65.421.5^{+6.6}_{-5.4} 13.84.9+6.1subscriptsuperscript13.86.14.913.8^{+6.1}_{-4.9} TS -0.210.22+0.23subscriptsuperscriptabsent0.230.22{}^{+0.23}_{-0.22} 2.892.892.89 0.660.660.66 2.662.662.66 -0.6 -0.4 21.61±0.02plus-or-minus21.610.0221.61\pm{0.02} 1.2
155 J142611.8+353301 14:26:11.85 35:33:01.9 1.7″ 20.56.1+7.2subscriptsuperscript20.57.26.120.5^{+7.2}_{-6.1} 1.81.8+4.0subscriptsuperscript1.84.01.81.8^{+4.0}_{-1.8} 18.75.4+6.6subscriptsuperscript18.76.65.418.7^{+6.6}_{-5.4} T 0.830.30+0.15subscriptsuperscriptabsent0.150.30{}^{+0.15}_{-0.30} 1.641.641.64 0.050.050.05 3.513.513.51 -0.4 0.6 22.63±0.03plus-or-minus22.630.0322.63\pm{0.03} 1.1
156 J142540.2+354623 14:25:40.21 35:46:23.0 3.8″ 24.66.4+7.5subscriptsuperscript24.67.56.424.6^{+7.5}_{-6.4} 5.33.1+4.3subscriptsuperscript5.34.33.15.3^{+4.3}_{-3.1} 19.25.5+6.7subscriptsuperscript19.26.75.519.2^{+6.7}_{-5.5} T 0.570.27+0.21subscriptsuperscriptabsent0.210.27{}^{+0.21}_{-0.27} 6.706.706.70 0.550.550.55 12.4112.4112.41 -0.7 1.1 16.33±0.00plus-or-minus16.330.0016.33\pm{0.00} 1.6
157 J142539.8+354438 14:25:39.87 35:44:38.6 2.4″ 26.37.2+8.3subscriptsuperscript26.38.37.226.3^{+8.3}_{-7.2} 10.24.4+5.6subscriptsuperscript10.25.64.410.2^{+5.6}_{-4.4} 16.15.6+6.8subscriptsuperscript16.16.85.616.1^{+6.8}_{-5.6} T 0.230.30+0.27subscriptsuperscriptabsent0.270.30{}^{+0.27}_{-0.30} 2.552.552.55 0.370.370.37 3.703.703.70 -1.3 0.4 19.91±0.01plus-or-minus19.910.0119.91\pm{0.01} 1.2
158 J142531.6+352659 14:25:31.60 35:26:59.0 3.5″ 29.86.4+7.5subscriptsuperscript29.87.56.429.8^{+7.5}_{-6.4} 4.72.9+4.1subscriptsuperscript4.74.12.94.7^{+4.1}_{-2.9} 25.15.6+6.8subscriptsuperscript25.16.85.625.1^{+6.8}_{-5.6} TH 0.690.22+0.16subscriptsuperscriptabsent0.160.22{}^{+0.16}_{-0.22} 8.748.748.74 0.520.520.52 17.3517.3517.35 2.1 2.0 24.71±0.15plus-or-minus24.710.1524.71\pm{0.15} 1.0
159 J142448.4+353227 14:24:48.48 35:32:27.4 2.8″ 40.68.7+9.8subscriptsuperscript40.69.88.740.6^{+9.8}_{-8.7} 26.46.2+7.3subscriptsuperscript26.47.36.226.4^{+7.3}_{-6.2} 14.26.1+7.2subscriptsuperscript14.27.26.114.2^{+7.2}_{-6.1} T -0.290.23+0.24subscriptsuperscriptabsent0.240.23{}^{+0.24}_{-0.23} 5.805.805.80 1.411.411.41 4.834.834.83 -0.6 1.0 24.00±0.14plus-or-minus24.000.1424.00\pm{0.14} 1.1
160 J142447.8+353138 14:24:47.80 35:31:38.8 3.3″ 22.27.9+9.0subscriptsuperscript22.29.07.922.2^{+9.0}_{-7.9} 13.74.9+6.1subscriptsuperscript13.76.14.913.7^{+6.1}_{-4.9} 8.56.1+7.2subscriptsuperscript8.57.26.18.5^{+7.2}_{-6.1} T -0.220.39+0.38subscriptsuperscriptabsent0.380.39{}^{+0.38}_{-0.39} 3.073.073.07 0.710.710.71 2.812.812.81 b
161 J142528.8+353342 14:25:28.80 35:33:42.0 0.6″ 7.73.1+4.3subscriptsuperscript7.74.33.17.7^{+4.3}_{-3.1} 5.82.5+3.8subscriptsuperscript5.83.82.55.8^{+3.8}_{-2.5} 1.91.7+3.1subscriptsuperscript1.93.11.71.9^{+3.1}_{-1.7} S -0.500.36+0.51subscriptsuperscriptabsent0.510.36{}^{+0.51}_{-0.36} 0.570.570.57 0.160.160.16 0.330.330.33 0.6 -0.1 19.52±0.00plus-or-minus19.520.0019.52\pm{0.00} 1.3
162 J142558.2+353144 14:25:58.29 35:31:44.4 1.6″ 12.34.8+5.9subscriptsuperscript12.35.94.812.3^{+5.9}_{-4.8} 6.02.9+4.1subscriptsuperscript6.04.12.96.0^{+4.1}_{-2.9} 6.33.7+4.9subscriptsuperscript6.34.93.76.3^{+4.9}_{-3.7} S 0.040.45+0.41subscriptsuperscriptabsent0.410.45{}^{+0.41}_{-0.45} 0.970.970.97 0.180.180.18 1.171.171.17 0.5 -0.2 25.08±0.26plus-or-minus25.080.2625.08\pm{0.26} 1.3
163 J142458.1+353919 14:24:58.14 35:39:19.4 2.5″ 25.67.1+8.2subscriptsuperscript25.68.27.125.6^{+8.2}_{-7.1} 16.95.0+6.2subscriptsuperscript16.96.25.016.9^{+6.2}_{-5.0} 8.75.0+6.2subscriptsuperscript8.76.25.08.7^{+6.2}_{-5.0} S -0.320.29+0.31subscriptsuperscriptabsent0.310.29{}^{+0.31}_{-0.29} 2.582.582.58 0.640.640.64 2.062.062.06 0.8 0.1 25.21±0.27plus-or-minus25.210.2725.21\pm{0.27} 0.9
164 J142535.9+353102 14:25:35.96 35:31:02.8 1.1″ 14.44.5+5.7subscriptsuperscript14.45.74.514.4^{+5.7}_{-4.5} 0.00.0+2.4subscriptsuperscript0.02.40.00.0^{+2.4}_{-0.0} 15.34.4+5.6subscriptsuperscript15.35.64.415.3^{+5.6}_{-4.4} H 1.000.25+0.00subscriptsuperscriptabsent0.000.25{}^{+0.00}_{-0.25} 1.111.111.11 <0.07absent0.07<0.07 2.782.782.78 -0.2 -0.4 23.53±0.08plus-or-minus23.530.0823.53\pm{0.08} 1.5
165 J142527.4+353257 14:25:27.46 35:32:57.9 0.6″ 8.63.3+4.5subscriptsuperscript8.64.53.38.6^{+4.5}_{-3.3} 0.00.0+1.9subscriptsuperscript0.01.90.00.0^{+1.9}_{-0.0} 9.83.3+4.5subscriptsuperscript9.84.53.39.8^{+4.5}_{-3.3} H 1.000.32+0.00subscriptsuperscriptabsent0.000.32{}^{+0.00}_{-0.32} 0.660.660.66 <0.06absent0.06<0.06 1.761.761.76 0.8 -0.6 24.80±0.31plus-or-minus24.800.3124.80\pm{0.31} 1.3
166 J142545.4+352711 14:25:45.44 35:27:11.8 2.5″ 19.86.0+7.2subscriptsuperscript19.87.26.019.8^{+7.2}_{-6.0} 1.21.2+3.8subscriptsuperscript1.23.81.21.2^{+3.8}_{-1.2} 18.65.4+6.6subscriptsuperscript18.66.65.418.6^{+6.6}_{-5.4} H 0.890.30+0.10subscriptsuperscriptabsent0.100.30{}^{+0.10}_{-0.30} 3.053.053.05 0.070.070.07 6.776.776.77 -1.9 -0.0 23.48±0.07plus-or-minus23.480.0723.48\pm{0.07} 1.2
167 J142523.4+353512 14:25:23.49 35:35:12.4 0.7″ 6.53.1+4.3subscriptsuperscript6.54.33.16.5^{+4.3}_{-3.1} 0.00.0+2.4subscriptsuperscript0.02.40.00.0^{+2.4}_{-0.0} 6.62.9+4.1subscriptsuperscript6.64.12.96.6^{+4.1}_{-2.9} H 1.000.55+0.00subscriptsuperscriptabsent0.000.55{}^{+0.00}_{-0.55} 0.500.500.50 <0.07absent0.07<0.07 1.171.171.17 0.1 -0.4 20.80±0.01plus-or-minus20.800.0120.80\pm{0.01} 1.3
168 J142621.6+353931 14:26:21.63 35:39:31.1 3.2″ 23.27.0+8.2subscriptsuperscript23.28.27.023.2^{+8.2}_{-7.0} 1.61.6+4.1subscriptsuperscript1.64.11.61.6^{+4.1}_{-1.6} 21.76.4+7.5subscriptsuperscript21.77.56.421.7^{+7.5}_{-6.4} H 0.870.28+0.12subscriptsuperscriptabsent0.120.28{}^{+0.12}_{-0.28} 2.712.712.71 0.070.070.07 5.965.965.96 1.4 -2.1 >>25.7
aafootnotetext: Source No. 22 is overlapped by bleeding of charge in the NDWFS R𝑅R image we used in this paper. Source position and R𝑅R band magnitude were measured from an older version of the NDWFS R𝑅R image.
bbfootnotetext: Source No. 37 and 160 are overlapped by bleeding of charge in both the NDWFS R𝑅R and the older NDWFS R𝑅R images