Supernova 2002bo: inadequacy of the single parameter description.
Abstract
We present optical/near-infrared photometry and spectra of the type Ia SN 2002bo spanning epochs from –13 days before maximum -band light to +102 days after. The pre-maximum optical coverage is particularly complete. The extinction deduced from the observed colour evolution and from interstellar NaID absorption is quite high viz. E. On the other hand, model matches to the observed spectra point to a lower reddening (E). In some respects, SN 2002bo behaves as a typical ”Branch normal” type Ia supernova (SN Ia) at optical and IR wavelengths. We find a -band risetime of 17.90.5 days, a (B) of , and a de-reddened . However, comparison with other type Ia supernovae having similar (B) values indicates that in other respects SN 2002bo is unusual. While the optical spectra of SN 2002bo are very similar to those of SN 1984A ((B) = 1.19), lower velocities and a generally more structured appearance are found in SNe 1990N, 1994D and 1998bu. For supernovae having (B) 1.2, we confirm the variation of (SiII) (Nugent et al., 1995) with (B). However, for supernovae such as SN 2002bo, with lower values of (B) the relation breaks down. Moreover, the evolution of (SiII) for SN 2002bo is strikingly different from that shown by other type Ia supernovae. The velocities of SN 2002bo and 1984A derived from SII 5640Å, SiII 6355Å and CaII H&K lines are either much higher and/or evolve differently from those seen in other normal SNe Ia events. Thus, while SN 2002bo and SN 1984A appear to be highly similar, they exhibit behaviour which is distinctly different from other SNe Ia having similar (B) values. We suggest that the unusually low temperature, the presence of high-velocity intermediate-mass elements and the low abundance of carbon at early times indicates that burning to Si penetrated to much higher layers than in more normal type Ia supernovae. This may be indicative of a delayed-detonation explosion.
keywords:
Supernovae: general – Supernovae: 2002bo1 Introduction
Thermonuclear (type Ia) supernovae (SNe Ia) are believed to originate
from the thermonuclear disruption of a white dwarf composed of carbon
and oxygen. In the favoured scenario, the white dwarf accretes mass
(mostly hydrogen) from a companion star in a binary. However, the
identification of the progenitor type is by no means certain.
Alternative initial scenarios include the merging of two binary white
dwarfs, or the accretion of helium (Hillebrandt & Niemeyer, 2000). It is generally
accepted that when the degenerate mass reaches the Chandrasekhar limit
(1.4 M⊙), explosive carbon ignition occurs and burning to
nuclear statistical equilibrium ensues, forming mostly radioactive
56Ni. Intermediate-mass nuclei, e.g. 28Si, are produced in
the outer, lower-density regions. These elements give rise to the
typical observed spectra of SNe Ia, which are dominated by lines of
Fe, Si and S. Nevertheless, the details of the explosion mechanism are
still poorly understood. For example, it is not clear whether nuclear
burning proceeds entirely in the form of a deflagration, or whether a
subsequent transition to a detonation wave occurs. Also, we do not understand
fully what determines the mass of 56Ni produced, or if events
producing the same 56Ni mass can differ in other respects.
It is vital that we improve our understanding of SNe Ia both for the
insight they can provide about astrophysical processes taking place
under extreme conditions, and because of their use in the measurement
of cosmological distances. Observational studies of SNe Ia at high
redshifts () are yielding increasingly strong evidence
that we are living in a Universe whose expansion began to accelerate
at half its present age. This finding is commonly taken to indicate a
finite positive cosmological constant (Riess et al. (1998);
Perlmutter et al. (1999)) i.e. a new form of energy with negative pressure
(Caldwell et al., 1998). However, an important
caveat is that these cosmological conclusions rely on the assumption
that the physical properties of high–z SNe Ia are the same as those
seen locally. But given the uncertainties in the nature of local
SNe Ia, it is important to test the validity of this assumption. In
order to address this fundamental question we must endeavour to
improve our physical understanding of the SN Ia phenomenon.
SN Ia theoretical models must be tested and constrained through
comparison with observed light curves and spectral evolution. Yet
only for a few events has even moderate coverage been achieved,
especially at infrared wavelengths. Moreover, at all wavelengths
there is a scarcity of observations during the 2–3 weeks when the SN
is still brightening. Data obtained during this time can be
particularly effective in setting tight model constraints
(Riess et al., 1999). A minority of SNe Ia are obviously peculiar
(Leibundgut et al. (1993); Turatto et al. (1996); Turatto et al. (1998); Li et al. (2001)),
although their significance for the overall picture is not clear.
However, even the so-called “normal” SNe Ia display differences from
one to another, e.g. in the photospheric expansion velocities deduced
from the lines of the intermediate mass elements (IME)
(Branch et al. (1988); Barbon et al. (1990)). Other more subtle differences
in the photospheric spectra can also be seen.
The desire to make decisive progress in accounting for the observed
behaviour and diversity of SNe Ia in terms of the explosion physics
and the nature and evolution of the progenitor provided the motivation
for the recently formed European Supernova Collaboration (ESC). This
comprises a large consortium of European groups specialising in the
observation and modelling of SNe Ia. The consortium is partially
funded as an EU Research Training Network. The ESC aims to elucidate
the nature of SNe Ia through the acquisition of high-quality
photometry and spectra for 10–12 nearby SNe Ia. These data will be
used to constrain state-of-the-art models for the explosion and
progenitor, also under development by the ESC.
Our first target, SN 2002bo in NGC 3190 (SA-LINER type), was discovered independently by Cacella and Hirose (Cacella et al., 2002) in CCD images taken on Mar. 9.08 UT and Mar. 9.505, respectively. It lies at the edge of a dust lane. Soon after discovery, SN 2002bo was classified as a type Ia SN at an early epoch, with the discovery date being about 2 weeks before maximum light (Kawakita et al. (2002), Benetti et al. (2002), Matheson et al. (2002) and Chornock et al. (2002)). The high expansion velocity (about 17,700 km s-1) of the Si II 6355Å doublet was particularly indicative of an early epoch. In this paper we describe the results of our photometric and spectroscopic monitoring campaign for SN 2002bo, and compare the observed properties with those of a sample of Branch-normal (Branch et al., 1993) SNe Ia. We also modelled two of the optical spectra, the earliest one and one very close to maximum, in order to derive some of the properties of the SN ejecta. We address the problem of determining the epoch of the spectra and in particular the reddening to the SN. We have also modelled our earliest IR spectrum both to address the amount of primordial carbon left in the SN ejecta and to identify the transitions present in this spectrum.
2 Observations
Spectroscopy and imaging were carried out at several sites using a
number of different telescopes and/or instruments (Tables
2 & 5).
2.1 Optical Photometry
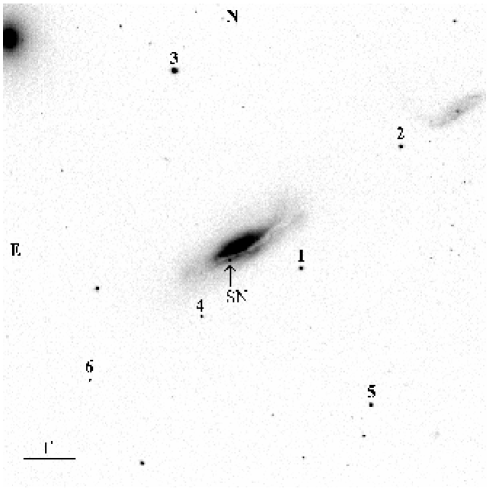
The CCD frames were first debiased and flat-fielded in the usual manner. Since most of the data were obtained under non-photometric conditions, relative photometry was derived with respect to a local sequence of field stars (see Fig. 1). The three photometric nights marked in table 2 (plus one VLT+FORS1 observation of SN 2002bo on March 3rd, 2003) were used to calibrate this sequence against Landolt standard stars (Landolt, 1992). The magnitudes and estimated errors of the local standards are shown in Table 1. These magnitudes were obtained by summing the counts through an aperture, the size of which varied according to the seeing. The telescope+instruments used for covering the SN 2002bo light curves appear to define a reasonably homogeneous photometric system. No systematic deviations are apparent in any photometric band (Fig. 2). This holds even for the S70 and INT photometric systems which have high colour terms in the colour equations (S70 - I:; INT - B:, V: and R:).
| star | B | V | R | I |
|---|---|---|---|---|
| 1 | ||||
| 2 | ||||
| 3 | ||||
| 4 | ||||
| 5 | ||||
| 6 |
Ideally, one would like to remove the galaxy background by subtraction of a galaxy “template” where the SN is absent. This procedure was indeed applied to some of the S70 observations, especially those with complex background (mostly I frames) around the SN. However, for most of the data a suitable template image was not available. Therefore, in such cases the SN magnitudes were measured using the IRAF point-spread-function fitting task Daophot. This procedure allows the simultaneous fitting and subtraction of the galaxy background. While the pixel scales varied from one instrument to another, they were always sufficiently small to provide good sampling of the PSFs (see Table 2 caption). For cases in which the seeing is fair, the SN is relatively bright, and its PSF well-sampled, it has been found that this method produces results in excellent agreement with the template subtraction method (cf. Rigon et al. (2000)). Our results confirm this. The supernova magnitudes are presented in Tab. 2. The table lists the date (col.1), Modified Julian Day (col.2), epoch relative to (col.3), BVRI magnitudes with estimated internal errors in parentheses (cols.4–7), the telescope used (col.8), and the seeing for each epoch, averaged over the observed bands (col.9).
| date | M.J.D. | epoch∗ | B | V | R | I | tel. | avg seeing |
| (days) | (arcsec) | |||||||
| 9/3/02 | 52342.95 | –13.1 | 16.94 (0.04) | 16.22 (0.03) | 15.90 (0.03) | 15.86 (0.03) | A1.82 | 2.4 |
| 11/3/02 | 52344.01 | –12.0 | 16.30 (0.10) | 15.71 (0.12) | 15.37 (0.10) | 15.43 (0.10) | A1.82 | 1.5 |
| 12/3/02 | 52345.02 | –11.0 | 15.72 (0.06) | 15.22 (0.03) | 14.93 (0.05) | 14.95 (0.06) | A1.82 | 2.3 |
| 12/3/02 | 52345.99 | –10.0 | 15.33 (0.07) | 14.93 (0.07) | 14.55 (0.05) | 14.56 (0.06) | A1.82 | 2.2 |
| 13/3/02 | 52346.92 | –9.1 | 15.11 (0.03) | 14.71 (0.03) | 14.32 (0.03) | 14.30 (0.03) | A1.82 | 2.6 |
| 15/3/02 | 52348.02 | –8.0 | 14.83 (0.03) | NOT | 1.1 | |||
| 15/3/02 | 52348.89 | –7.1 | 14.72 (0.03) | 14.39 (0.02) | 13.86 (0.04) | S70 | 2.6 | |
| 16/3/02 | 52349.92 | –6.1 | 14.47 (0.04) | NOT | 0.9 | |||
| 17/3/02 | 52350.89 | –5.1 | 14.31 (0.06) | 14.07 (0.02) | 13.63 (0.05) | S70 | 2.0 | |
| 19/3/02 | 52352.04 | –4.0 | 14.22 (0.03) | NOT | 3.2 | |||
| 19/3/02 | 52352.05 | –4.0 | 14.22 (0.05) | 13.88 (0.07) | 13.62 (0.11) | 13.57 (0.08) | A1.82 | 3.0 |
| 19/3/02 | 52352.75 | –3.3 | 14.17 (0.03) | 13.88 (0.02) | 13.54 (0.03) | S70 | 1.4 | |
| 19/3/02 | 52352.96 | –3.0 | 14.10 (0.04) | 13.76 (0.03) | 13.54 (0.05) | 13.56 (0.04) | A1.82 | 3.7 |
| 20/3/02 | 52353.89 | –2.1 | 14.08 (0.02) | NOT | 3.1 | |||
| 21/3/02 | 52354.84 | –1.2 | 14.07 (0.10) | 13.68 (0.10) | 13.50 (0.10) | 13.55 (0.10) | A1.82 | 2.0 |
| 21/3/02 | 52354.95 | –1.1 | 14.08 (0.07) | NOT | 1.1 | |||
| 23/3/02 | 52356.87 | 0.9 | 14.05 (0.05) | 13.68 (0.02) | 13.57 (0.02) | S70 | 1.8 | |
| 25/3/02 | 52358.85 | 2.9 | 14.14 (0.06) | 13.64 (0.03) | 13.67 (0.04) | S70 | 1.7 | |
| 27/3/02 | 52360.74 | 4.7 | 14.23 (0.04) | 13.65 (0.02) | 13.64 (0.03) | S70 | 1.5 | |
| 28/3/02 | 52361.08 | 5.1 | 14.13 (0.06) | 13.66 (0.04) | 13.45 (0.10) | 13.77 (0.04) | JKT | 2.0 |
| 29/3/02 | 52362.74 | 6.7 | 14.40 (0.04) | 13.77 (0.02) | 13.75 (0.02) | S70 | 1.9 | |
| 2/4/02 | 52366.84 | 10.8 | 14.64 (0.04) | 14.00 (0.02) | 13.91 (0.05) | S70 | 3.4 | |
| 8/4/02 | 52372.85 | 16.9 | 15.36 (0.06) | 14.31 (0.02) | 13.99 (0.05) | S70 | 1.5 | |
| 10/4/02 | 52374.89 | 18.9 | 15.68 (0.11) | 14.47 (0.03) | 13.98 (0.05) | S70 | 1.7 | |
| 14/4/02 | 52378.8 | 22.8 | 16.37 (0.23) | 14.66 (0.03) | 13.87 (0.03) | S70 | 1.4 | |
| 23/4/02 | 52387.88 | 31.9 | 15.20 (0.03) | 14.02 (0.17) | S70 | 1.5 | ||
| 5/5/02 | 52399.86 | 43.9 | 17.11 (0.18) | 15.70 (0.05) | 14.82 (0.06) | S70 | 1.6 | |
| 6/5/02∗∗† | 52400.89 | 44.9 | 17.03 (0.05) | 15.63 (0.05) | 15.13 (0.05) | 14.92 (0.05) | TNG | 1.9 |
| 7/5/02 | 52401.82 | 45.8 | 14.89 (0.07) | S70 | 6.5 | |||
| 12/5/02 | 52406.85 | 50.9 | 16.13 (0.05) | 15.26 (0.11) | S70 | 2.6 | ||
| 15/5/02 | 52409.83 | 53.8 | 17.45 (0.34) | 16.16 (0.06) | 15.23 (0.11) | S70 | 1.7 | |
| 15/5/02 | 52409.95 | 54.0 | 17.20 (0.08) | 15.86 (0.06) | 15.52 (0.03) | 15.36 (0.04) | A1.82 | 2.1 |
| 26/5/02 | 52420.86 | 64.9 | 16.60 (0.18) | 15.94 (0.18) | S70 | 4.0 | ||
| 10/6/02 | 52435.87 | 79.9 | 17.47 (0.07) | 16.47 (0.06) | 16.44 (0.08) | 16.54 (0.04) | A1.82 | 2.6 |
| 14/6/02 | 52439.98 | 84.0 | 17.52 (0.07) | 16.71 (0.06) | 16.54 (0.04) | 16.64 (0.05) | NTT | 0.7 |
| 27/6/02 | 52452.92 | 96.9 | 17.65 (0.04) | 16.98 (0.04) | 16.86 (0.04) | 16.93 (0.09) | INT | 1.1 |
| 29/6/02† | 52454.94 | 98.9 | 17.06 (0.06) | 17.10 (0.04) | 17.12 (0.06) | JKT | 1.4 | |
| 30/6/02 | 52455.92 | 99.9 | 17.70 (0.05) | JKT | 2.0 | |||
| 2/7/02† | 52457.94 | 101.9 | 17.72 (0.08) | 17.20 (0.05) | 17.01 (0.10) | 17.07 (0.10) | JKT | 2.6 |
Epoch relative to Bmax, which occurred on MJD=52356.0 = 2002 March 23.0 UT
We also have a -band measurement at this epoch of
† Photometric night
A1.82 = Asiago1.82m telescope + AFOSC; pixel scale=0.473”/px
NOT = Nordic Optical Telescope + ALFOSC; pixel scale=0.188”/px
S70 = 0.70m Sternberg Astronomical Institute telescope + CCD Camera; pixel scale=1.00”/px
JKT = 1.0m Jacobus Kapteyn Telescope + CCD camera; pixel scale=0.330”/px
TNG = Telescopio Nazionale Galileo + DOLORES; pixel scale=0.275”/px
NTT = ESO NTT + EMMI; pixel scale=0.1665”/px
INT = 2.5m Isaac Newton Telescope + WFC; pixel scale=0.333”/px
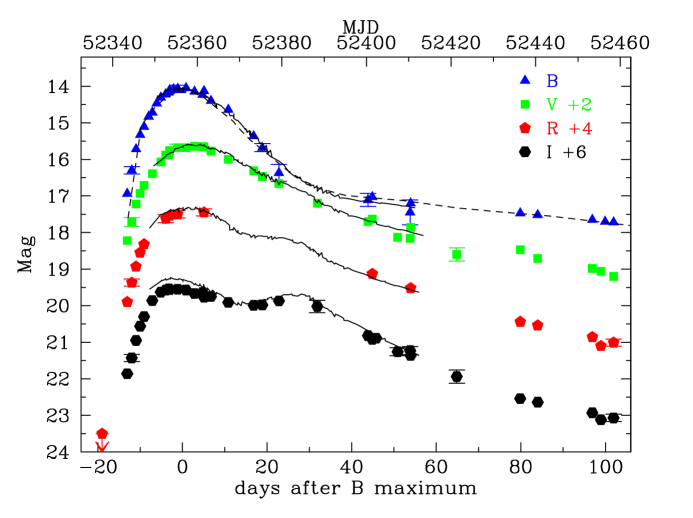
2.1.1 Light curves and rise times
The B, V, R and I light curves of SN 2002bo are shown in
Fig. 2, including the pre-discovery limit of
Sarneczky & Bebesi (2002). The light curves are very well sampled, spanning epochs
from just a few days after the explosion to 100 days post-maximum. We
used a high order Legendre polynomial to fit the points around
maximum, and hence infer a B mag on
=MJD (2002 March 23.0 UT). Thus, our
observations cover epochs between –13 and +102 days with respect to
t. Likewise, we found V mag, and
occurring about two days after , in agreement with the
template light curves derived by Leibundgut (1991a). The
corresponding values for the other two bands are and
and occurred respectively about 1 day after and
about 2.4 days before . The tendency for the -band
peak to occur before t has been observed in other SNe Ia
e.g. SN 1998bu
(Hernandez et al., 2000). The secondary I maximum has been reached on
52381.5 (e.g. d after and 0.35mag below the primary
maximum). From the B light curve we derive a post-maximum decline of
(B).
Thanks to the early detection and good temporal coverage of SN 2002bo we have been able to estimate the risetime to maximum and hence the explosion epoch , following Riess et al. (1999). The main hypothesis of this method is that the early luminosity (for epochs days) is proportional to the square of the time since explosion. We find MJD , MJD , MJD and MJD . Thus there is reasonable agreement between the bands as to the explosion epoch, viz. MJD. The B-band risetime of 17.9 days is consistent with the Riess et al. value of days for a SN Ia with the of SN 2002bo. However, our explosion epoch is in better agreement with the days for SN 1994D derived by Vacca & Leibundgut (1996) through empirical light curve fitting of B, V and R photometry. Finally, we note that the explosion epoch derived from modelling of the SN 2002bo spectra (see Sect. 2.5) is days, which is consistent with our photometry-based value.
2.1.2 Colour evolution

In Fig. 3 we show the intrinsic , and
colours and their evolution. The colour was de-reddened by 0.43
mag, with corresponding values being applied to the other two colours
(see subsection 2.2). The law of Cardelli et al. (1989) was used for
de-reddening. Also shown is the colour evolution of SNe 1994D, 1998bu
and 2001el, together with the colour templates (with their intrinsic
dispersions) of Nobili et al. (2003) for days, and the loci of Lira
(Lira (1995), Phillips et al. (1999)). The 3 comparison SNe have
values of, respectively, 1.32, 1.01 and 1.13.
Similarly to SN 1994D, two weeks before maximum the intrinsic
colour is quite red, viz. , but it moves rapidly
blueward reaching a minimum of around . SNe 1994D,
1998bu and 2001el display a similar behaviour, although SN 2001el
shows a slightly deeper minimum. The curve then moves redward such
that by day +23 it appears to reach a maximum at ,
about 0.2 mag redder than for the comparison SNe. The curve then
follows a typical evolution to the blue, reaching a value close to
zero by . The Nobili et al. template nicely describes the
evolution in the day era.
The colour curve of SN 2002bo exhibits a behaviour which is very
similar to those of the comparison SNe. Only near maximum does the
SN 2002bo curve depart from the general trend, showing values which
are about 0.10 mag. bluer. The Nobili template fails to describe the
evolution of our SN Ia sample especially around phase
days. The colour evolution of SN 2002bo is very similar
both to those of the comparison SNe, and to the Nobili template.
2.2 Near-infrared Photometry
Near-infrared imaging (JHK) was carried out at four epochs around
maximum light at the 1.55m Carlos Sánchez Telescope (TCS), Tenerife
using the CAIN infrared camera. This uses a 256 x 256 HgCdTe array and
was operated at a plate scale of 1.0 arcsec/pixel. In addition a
single epoch observation at JHKs was obtained about 2 weeks after
maximum light using at the 2.5m Nordic Optical Telescope (NOT) and the
NOTCam infrared camera. This uses a 1024x1024 HgCdTe detector with a
plate scale of 0.23 arcsec/pixel. Data reduction was carried out using
standard routines within IRAF. The individual co-add frames ( per pointing) taken with TCS have been aligned before to be combined. This
was necessary because of the inaccuracy of the telescope
tracking. Simple aperture photometry of the TCS images was carried out
using the Starlink package Gaia (Starlink User Note 214, 2003,
P.W. Draper, N.Gray & D.S. Berry). An aperture radius of 2
arcseconds was chosen. This was a compromise between including as
much target signal and excluding as much galaxy background as
possible. The sky annulus had inner and outer radii of 3.4 and 5.0
arcsec respectively. However, the relatively large plate scale of the
CAIN camera together with the presence of a strong galaxy background
meant that the magnitude uncertainties, especially in the H and K
bands, are large (0.1 to 0.2 mags). Before photometric
measurement of the NOTCam data was carried out, a smoothed background
was subtracted from the area of the supernova. This, together with the
finer plate scale of NOTCam, yielded magnitudes of higher precision.
Therefore, in order to preserve as much information as possible about
the IR evolution of the supernova, the TCS magnitudes were calibrated
using the NOTCam images via two field stars lying, respectively, about
(81”W, 7”S) and (32”E, 61”S) of the supernova. This also meant
that the earliest TCS epoch could be used in spite of there being no
standards available for that night. For the NOTCam calibration, use
was made of photometric standards listed in Hunt et al. (1998) and
Persson et al. (1998). The resulting magnitudes are given in
Table 3
| date | M.J.D. | epoch∗ | J | H | K | tel. |
|---|---|---|---|---|---|---|
| (days) | ||||||
| 18/3/03 | 52351.5 | -4.5 | 13.83(0.08) | 13.96(0.13) | 13.70(0.17) | TCS |
| 20/3/03 | 52353.6 | -2.4 | 13.70(0.09) | 13.87(0.21) | 13.61(0.15) | TCS |
| 22/3/03 | 52355.5 | -0.5 | 13.88(0.08) | 13.75(0.20) | 13.70(0.21) | TCS |
| 24/3/03 | 52357.5 | 1.5 | 14.01(0.09) | 13.95(0.16) | 13.56(0.11) | TCS |
| 5/4/03 | 52370.4 | 14.4 | 15.50(0.07) | 14.23(0.02) | 14.12(0.05)(Ks) | NOT |
Epoch relative to Bmax, which occurred on MJD=52356.0 = 2002 March 23.0 UT
TCS = Carlos Sánchez Telescope + CAIN; pixel scale = 1.0”/px
NOT = Nordic Optical Telescope + NOTCam; pixel scale = 0.23”/px
Within the uncertainties, the photometry shows that the IR magnitudes
of SN 2002bo evolved in a manner typical of Type Ia
supernovae. In the J-band, where the precision is higher, we can
deduce that maximum light in this band was about 3 days before maximum
light in B. Similar behaviour has been seen in other SNe Ia
(e.g. SN 1998bu: Hernandez et al. (2000)). In addition the rapid
fading in the J-band by +14 days is also typical. We note that a more
extensive, high precision study of the SN 2002bo IR photometric
evolution has been carried out by N. Suntzeff and K. Krisciunas at
CTIO (private communication). To within the uncertainties, the two
sets of data are consistent.
2.3 Reddening, distance and bolometric light curve
Lira (1995) and Phillips et al. (1999) found a uniform colour
evolution in the colour of unreddened Type Ia SNe between +30
and +90 days. By de-reddening the observed SN 2002bo colour
curve until it matched the Lira relation (Fig. 3), we
deduced a colour excess of E mag. Only a minor
fraction of this is due to extinction in the Galaxy
(E, Schlegel et al. (1998)), with the remaining
0.44 mag. being due to extinction in the host galaxy. That the
light from SN 2002bo suffered significant extinction in the host
galaxy is confirmed by strong NaID interstellar absorption lines at
the redshift of NGC 3190. These lines have a total equivalent width
Å. Using the relation E(NaID) of Turatto et al. (2003) yields E, in
good agreement with the value of 0.44 derived from the late
photometry. Given the intrinsic dispersion in both the E(NaID) relation and the Lira relation, we conservatively adopt
E. We note, however, that spectral modelling (see Sect.
2.5) points to a lower reddening value of E.
Adopting a redshift of +1405 km s-1and correcting for LG infall (+208 km s-1) onto the Virgo cluster (LEDA) with an adopted Virgo distance of 15.3 Mpc (Freedman et al., 2001) we derive a distance modulus of (21.6 Mpc) for NGC 3190.
This value is adopted throughout the paper. Given the apparent peak
magnitudes and the reddening, we obtain absolute peak intrinsic
(i.e. de-reddened) magnitudes of , , , and for SN 2002bo.
As before, the law of Cardelli et al. (1989) was used for de-reddening.
Given the uncertainties involved, the SN 2002bo magnitudes are
consistent with the mean values given by Gibson et al. (2000) and
Saha et al. (2001) for SNe Ia with Cepheid-determined distances. The
average (B) of these calibrators is
(Altavilla et al., 2003), similar to that of SN 2002bo.
The host galaxy of SN 2002bo, NGC 3190, belongs to the LGC 194
(Leo III) galaxy group (Garcia, 1993), which contains 16 members.
The surface brightness fluctuation method of distance determination
(Tonry et al., 2001) has been applied to two of these viz. NGC 3193 and
NGC 3226, yielding values of and ,
respectively. Together with the distance modulus for NGC 3190 derived
above, this suggests considerable depth (16 Mpc) in LGC 194,
and may even cast doubts upon the group membership of NGC 3193.
Integrating the fluxes in the BVRI bands, adding the IR contributions at various epochs as discussed in Sect. 2.4.3, and applying the Contardo et al. (2000) and Suntzeff (1996) corrections for the missing U and UV contributions, respectively, we derived the uvoir luminosity for SN 2002bo (see Fig. 4). For comparison the uvoir light curve of SN 1998bu is also plotted. The similarity of the two light curves is remarkable. SN 2002bo reached bolometric maximum on MJD=52356 with logL=43.19 [erg s-1]. The date of the maximum and the rise time (about 17.4 days, calculated with the method described in the previous section) closely match the maximum date and rise time found for the B band.

A summary of the main parameter values for SN 2002bo and its host galaxy are given in Tab. 4.
| Parent galaxy | NGC 3190 |
|---|---|
| Galaxy type | SA(s)a pec sp LINER † |
| RA (2000) | |
| Dec (2000) | 49’41”.7 |
| Recession velocity [km s-1] | ‡ |
| Distance modulus (H) | 31.67 |
| E | |
| Offset from nucleus | 11”.6E 14”.2S |
| Explosion epoch (MJD) | (Mar 05, 2002) |
| Date of B maximum (MJD) | (Mar 23, 2002) |
| Magnitude at max | , , |
| , | |
| (B) |
† NED
‡ LEDA, corrected for LG infall (208 km s-1)
2.4 Spectroscopy
Spectroscopic observations spanned days –12.9 to +84, with
exceptionally good temporal coverage being achieved during the
risetime, allowing us to follow day-to-day variations. Table
5 lists the date (col.1), the Modified Julian Date
(col. 2), the epoch relative to (col.3), the wavelength
range (col.4), the instrument used (col.5), and the resolution as
measured from the FWHM of the night-sky lines (col.6). On three
epochs (–4, –2, –1 days), almost contemporary spectra were
obtained at the A1.82 and NOT. These were co-added to produce the
spectra shown for these epochs.

The spectra were reduced following standard FIGARO or IRAF routines.
Extractions were usually weighted by the variance based on the data
values and a Poisson/CCD model using the gain and read noise
parameters. The background to either side of the SN signal was fitted
with a low order polynomial and then subtracted. Fluxing was by means
of spectrophotometric standard stars. The flux calibration of the
optical spectra was checked against the photometry (using the IRAF
task stsdas.hst_calib.synphot.calphot) and, where discrepancies
occurred, the spectral fluxes were scaled to match the photometry. On
nights with good observing conditions the agreement with photometry
was within 10%. The flux calibration of the IR spectra was checked
against photometry. The fluxing was adjusted where
necessary. The IR spectra on days +56/57/61 and day +85 were at later
epochs than covered by the photometry. Therefore, the IR light curves
of Meikle (2000) were used to extrapolate to these ephochs. The
optical spectra are shown in Figure 5, and the IR
spectra in Figure
12.
2.4.1 Optical spectra
Inspection of Figure 5 shows that the early blueward
shift of the colour (Figure 3) is at least partly due to a
gradual steepening of the continuum until about days. Similarly,
the subsequent reddening follows a gradual decrease in the continuum
slope.
| Date | M.J.D. | epoch∗ | range | tel.∗∗ | res. |
|---|---|---|---|---|---|
| (days) | (Å) | (Å) | |||
| 10/03/02 | 52343.06 | –12.9 | 3600-7700 | A1.82 | 25 |
| 10/03/02 | 52343.99 | –12.0 | 3600-7700 | A1.82 | 25 |
| 11/03/02 | 52344.99 | –11.0 | 3400-7700 | A1.82 | 25 |
| 13/03/02 | 52346.91 | –9.1 | 3400-7700 | A1.82 | 25 |
| 14/03/02 | 52347.48 | –8.5 | 8135-13060 | UKIRT | 25 |
| 14/03/02 | 52347.48 | –8.5 | 14666-25400 | UKIRT | 100 |
| 15/03/02 | 52348.04 | –8.0 | 3400-9050 | NOT | 14 |
| 16/03/02 | 52349.93 | –6.1 | 3400-9050 | NOT | 14 |
| 18/03/02 | 52351.85 | –4.1 | 3200-7550 | WHT | 2 |
| 19/03/02 | 52352.02 | –4.0 | 3400-7700 | A1.82 | 25 |
| 19/03/02 | 52352.05 | –3.9 | 3400-9050 | NOT | 14 |
| 19/03/02 | 52352.94 | –3.1 | 3400-7700 | A1.82 | 25 |
| 20/03/02 | 52353.90 | –2.1 | 3400-9050 | NOT | 22 |
| 20/03/02 | 52354.00 | –2.0 | 3400-7700 | A1.82 | 25 |
| 21/03/02 | 52354.88 | –1.1 | 3400-7700 | A1.82 | 25 |
| 21/03/02 | 52354.96 | –1.0 | 3400-9050 | NOT | 22 |
| 22/03/03 | 52355.18 | –0.8 | 3200-8900 | WHT | 12 |
| 23/03/02 | 52356.08 | +0.1 | 3400-10350 | A1.82 | 25 |
| 28/03/03 | 52361.94 | +5.9 | 3100-8800 | WHT | 12 |
| 03/04/02 | 52367.29 | +11.3 | 8180-13390 | UKIRT | 25 |
| 03/04/02 | 52367.29 | +11.3 | 14725-25250 | UKIRT | 100 |
| 21/04/02 | 52385.40 | +29.4 | 10680-13880 | UKIRT | 25 |
| 21/04/02 | 52385.40 | +29.4 | 14780-25260 | UKIRT | 100 |
| 21/04/02 | 52385.91 | +29.9 | 3500-9800 | INT+I | 4 |
| 23/04/02 | 52387.40 | +31.4 | 8230-10980 | UKIRT | 25 |
| 01/05/02 | 52395.90 | +39.9 | 3650-9200 | INT+I | 4 |
| 06/05/02 | 52400.94 | +44.9 | 3250-8040 | TNG | 12 |
| 17/05/02 | 52411.90 | +55.9 | 8155-10730 | UKIRT | 25 |
| 18/05/02 | 52413.00 | +57.0 | 10730-13530 | UKIRT | 25 |
| 22/05/02 | 52417.00 | +61.0 | 19840-25130 | UKIRT | 100 |
| 14/06/02 | 52440.00 | +84.0 | 3900-9750 | NTT | 10 |
| 15/06/02 | 52440.99 | +85.0 | 9400-16500 | NTT+S | 21 |
* - relative to the estimated epoch of B maximum (MJD=52356.0)
** - See note to Table 2 for telescope coding plus:
UKIRT = United Kingdom Infrared Telescope + CGS4
WHT = William Herschel Telescope + ISIS
INT+I = Isaac Newton Telescope + IDS
NTT+S = ESO NTT + SOFI
We compare the spectra of SN 2002bo with those of SNe 1984A, 1990N, 1994D and 1998bu at about 1 week pre-maximum in Fig. 6, and at maximum light in Fig. 7. All these SNe have a (B) in the range 1.01–1.32, and so in this sense can be regarded as fairly typical. Nevertheless, spectral differences between the events are apparent.

At 1 week pre-maximum (Fig. 6), starting at the shortest
wavelengths we note that, unlike SNe 1990N or 2002bo, SN 1998bu shows
a double structure in the CaII H&K absorption feature. SN 1994D shows
a similar double structure close to maximum light (Fig. 7),
and this may well have also been present in its –8d spectrum.
However, the spectral coverage stopped short of the this region. The
prominent emission feature centered at about 4000Å varies somewhat
between events owing to differing strengths in the SiII 4128,
4131Å doublet. The strength of this feature appears to be proportional
to that of other SiII features in the various SNe. In the
4000-4500Å range, SN 2002bo and SN 1984A are rather similar in that
they show a strong, absorption at 4250 Å, dominated by MgII
4481 Å, plus a weak absorption feature at 4400 Å due to
SiIII 4553, 4568Å. In the other three SNe, the SiIII feature is
much stronger, comparable in depth to the 4250 Å absorption
which now contains both MgII 4481 Å as well as a significant
contribution from FeIII (4419, 4433 Å etc.), as inferred
from modelling and from the strength of the corresponding FeIII
feature near 4950Å (FeIII 5074, 5127, 5156Å). Given the
temperature sensitivity of the SiIII line, we can immediately conclude
that both SNe 1984A and 2002bo have significantly cooler spectra than
the other three SNe shown in Fig. 6. In the range
4500-5000Å, SNe 1984A and 2002bo show a strong and broad absorption
(dominated by FeII lines including multiplet 48), showing little
structure. In contrast, the other three SNe Ia show a much weaker
absorption, but with a greater multiplicity of small features. Some
of these differences may be due to higher velocities in SNe 1984A and
2002bo, leading to a greater degree of line blending. In the
5000–6000Å range, while the spectra of all five SNe Ia become more
similar to one another, we nevertheless note a somewhat larger amount of
structure in SNe 1990N, 1994D and 1998bu than in SNe 1984A and
2002bo. For example, a small dip at 5150Å is present only in the
first three SNe. Longwards of 6000Å, we find that SNe 1984A and
2002bo show SiII 6355Å absorption profiles which are both broader
and more intense than in the other three SNe Ia.
Turning our attention now to the maximum-light spectra SNe Ia (Fig. 7) we see that the differences between SNe 1984A and 2002bo on the one hand and SNe 1990N, 1994D and 1998bu on the other are similar to those seen at the earlier epochs. For example, the double structure in the CaII H&K absorption is still present in SN 1998bu and, as mentioned above, in SN 1994D (see also Hatano et al. (2000)). However, it remains absent in SN 2002bo. The 4000–5000Å region exhibits differences similar to those seen at earlier times, with a strong and relatively structureless emission feature at 4500Å dominating the SNe 1984A and 2002bo spectra, while the other three SNe Ia show much weaker but more structured features. Also, the SiII 6355Å absorption profiles continue to be broader and deeper in SNe 1984A and 2002bo.
Nugent et al. (1995) found that the ratio, (SiII), of the
depth of the SiII 5972Å and SiII 6355Å absorption troughs near
maximum light is related to the speed of decline (and therefore to the
luminosity) of the event, and to the characteristic temperature of
the spectrum. Slower, brighter decliners exhibit a smaller value of
(SiII) at maximum. In Figure 8 we have plotted
maximum-light (SiII) vs. (B) for 11 SNe.
These include our SNe Ia sample plus those presented in
Nugent et al. (1995), and SN 1999ee (we found values of (SiII)
for SNe 1990N and 1994D which are slightly different from those of
Nugent et al. (1995): 0.21 and 0.33 vs. 0.16 and 0.29 respectively). Figure
8 shows that while the Nugent et al. relation holds for (B)1.2, at values smaller than this it breaks down.
We also investigated the variation with epoch of the Nugent et al.
relation for SNe 1984A, 1990N, 1994D, 1998bu, 2002bo, 1999ee.
Fig. 9 shows that as we move to pre-maximum epochs the value
of (SiII) remains higher in the faster-declining SN 1994D
((B)=1.32) than in the slower-declining SNe 1999ee,
1990N and 1998bu. SNe 1994D and 1998bu show low amplitude variations
with epoch, without any strong trend, while SN 1990N and possibly
SN 1999ee move to lower ratios at earlier epochs. However, SN 2002bo
exhibits a strikingly different behaviour. (SiII) has a
remarkably high value of 0.54 at an epoch of d, but then
undergoes a dramatic decline, levelling out just a few days before
maximum at (SiII)=0.17. This is the lowest value measured in
the entire sample at this epoch. SN 1984A also seems to follow this
trend, although it does not fall to such a low value. The decrease of
(SiII) in SN 2002bo seems to track the increase of the
photospheric temperature as indicated by the decrease of the
colour (see Fig. 3) at these epochs.


2.4.2 The expansion velocities
Up to +5 days, SiII 6355Å provides one of the deepest absorption
features. At the earliest epochs (see Figure 5), the
profile is significantly asymmetric, owing in part to the presence of
strong NaID interstellar absorption and the smaller equivalent width
of the SiII feature at these early times. The minimum then shifts
rapidly redwards and deepens with time as the photosphere moves into
deeper, more slowly-moving material. This is illustrated in
Fig. 10, which also shows the SiII 6355Å velocity evolution
for SNe 1998bu, 1994D, 1990N, 1984A. The figure reveals clear
differences between these events. SN 2002bo exibits an exceptionally
high velocity which decreases in a smooth, gradual manner. A similar
behaviour may be present in SN 1984A, although the data are more
sparse. In contrast, SNe 1990N, 1994D and 1998bu show significantly
lower velocities, with a distinct break in the decline rate around
days. The presence of a velocity break may be related to the
fact that the velocity deduced from the SiII 6355Å absorption
traces the photospheric velocity only during the era when the material
near the photosphere is Si-rich. Later, the Si absorption region
becomes more detached from the photosphere leading to a velocity which
changes more slowly with time (Patat et al., 1996).


Lentz et al. (2000) computed emergent pre-maximum spectra for a grid of SNIa atmospheres and argued that some of the differences between SNe Ia events in the blueshift of the SiII 6355Å line at a given epoch may indicate a range of metallicities in the SNIa progenitor. In Fig. 10 we show the Lentz model velocity predictions for metallicity values of 1/3, 3 and 10 solar. While the behaviour of the lower velocity SNe Ia is plausibly encompassed by a metallicity range 1/3 to 3, a metallicity even as high as 10 solar fails to give velocities that are anywhere near those exhibited by SN 2002bo, not to mention the even faster SN 1984A. This suggests that the Si observed in these spectra is mostly the product of SN nucleosynthesis, and that the outer layers of the ejecta of SN 2002bo do not preserve much memory of the properties of the progenitor, as also indicated by the absence of the CII lines discussed below. Possible causes for this are discussed later.
We have also examined the evolution of the SII 5640Å absorption (Fig. 11a). This is an interesting line to study since, as it is quite weak, we can be reasonably certain that it is always formed close to the continuum photosphere (even allowing for possible SiIII 5740Å contamination at early times (Mazzali, 2001)). Thus, it is a valuable probe of the true photospheric velocity. Curiously, the pre-maximum velocity behaviour appears to divide our sample into two groups. In SN 2002bo, the SII velocity declines from a value of over 16,000 km/s at –13 days to about 10,000 km/s at maximum. A similar behaviour is observed in SN 1984A, where the velocity is even slightly higher, although here the data do not begin until about –7 days. In contrast, the other SNe Ia reach only 12,500 km/s at –13 days, but they also decline to 10,000 km/s at maximum. This suggests rather different conditions in the outer envelopes of the two groups. Between 0 and +10 days, SNe 1990N, 1994D and 1998bu appear to show roughly the same decline rate in the velocity of the SII 5640Å line. Coverage of SNe 1984A and 2002bo is insufficient to reach definite conclusions about their decline rate in this period. Actually, at phase +8 days the SII doublet has already disappeared in the SN 1984A spectrum.

The other very prominent absorption at early times is due to the CaII
H&K doublet. At a given epoch this has an even higher optical depth
than SiII 6355Å and so the line forms further out in the ejecta, in
higher velocity layers. Consequently, the CaII H&K minima exhibit
higher velocity blueshifts than those seen in contemporary SiII
6355Å minima (Fig. 11b). Up to maximum light, the CaII H&K
velocities of SNe 1990N, 1994D, and SN 2002bo are similar, while
SN 1998bu shows velocities which are slower by about 4000 km s-1. On
the other hand, the velocity in SN 1984A is about 5000 km s-1 higher.
By +10 days, the SN 1994D velocity has declined to values similar to
those of SN 1998bu. On the other hand, the SN 2002bo velocity
declines more slowly, so that by +10 days its interpolated value
exceeds those of SN 1994D and SN 1998bu by 3000 km s-1. By about
day +20, the SN 1984A velocity is only 1000 km s-1 faster than the
interpolated value for SN 2002bo.
2.4.3 Infrared spectra
Inspection of Figure 12 shows the earliest IR spectrum (–8.5 days) to be largely featureless. A weak, complex P-Cygni line at about 10500 Å is apparent. This feature was first noted in the early spectra of SN 1994D (Meikle et al., 1996), who suggested either HeI 10830Å or MgII 10926Å as plausible identifications. More detailed modelling by Mazzali & Lucy (1998) yielded a similarly ambiguous identification. However, Wheeler et al. (1998) found that their models indicated that the feature should be due almost entirely to MgII. Our synthetic spectra (described below) tend to support the MgII identification. A broad, P-Cygni profile (peak emission at 16700Å, rest frame) is also present, and Wheeler et al. (1998), Marion et al. (2003) attribute this to SiII 16910Å and MgII 16760/800Åwith the SiII dominant. Again, our synthetic spectra confirm this. At longer wavelengths the early IR spectrum is almost featureless except for a shallow, broad P-Cygni feature with a peak at 20800Å and attributed to SiII.
By +11 days, the spectrum has changed significantly, with a number of
prominent emission features now being present. The 10500 Å feature
has vanished (similar behaviour was seen in SN 1994D,
(Meikle et al., 1996)), while two strong, wide (FWHM km s-1)
emission features have appeared at 15490 Å and 17525Å. These are
attributed to blends of CoII, FeII and NiII (Wheeler et al. (1998),
Marion et al. (2003)). The deep, characteristic J-band deficit can also
be seen (Spyromilio et al., 1994). This persists right through to the latest
spectrum at +85 d. By one month post-maximum, three new broad
emission peaks have appeared at 21350Å, 22490Å and 23619Å (rest frame), and these are attributed to Co, Ni and Si
(Wheeler et al., 1998). They are still visible in the +56 day spectrum.
Hamuy et al. (2002) point out that the spectroscopic homogeneity
among Branch-normal SNe Ia extends to the IR-domain. This is confirmed
in Figure 13, where we compare the IR spectra of SNe 2002bo
at d, +11.1d and +29.4d with those of SNe 1994D
(Meikle et al., 1996)) and 1999ee Hamuy et al. (2002) at similar epochs.
The main difference between the three SNe Ia is that the –8.5 d
10500Å feature is absent from the SN 1999ee spectrum. Since this
feature is also clearly visible in SN 1999by (Hamuy et al., 2002) it
seems that SN 1999ee is peculiar in this respect. We conclude that,
as in the optical domain, there exists some inhomogeneity among the IR
spectra of normal SNIa.
Figure 14 shows the overall optical+IR spectral evolution of SN 2002bo. This was created by combining IR and optical spectra having similar epochs. These collages have been used to determine the IR flux contribution for reconstructing the bolometric light curve (see Sect. 2.3). For the earliest spectrum, following de-reddening we find that the the total flux in the IR (integrated between 10000 and 25000 Å) is only 5% of the total optical flux (integrated between 3500 and 10000 Å). For the second one, taken near the secondary maximum of the IR light curves, the IR contribution rises to 18%. For the later two spectra the IR contribution decreases to 6% of the optical. This is in close agreement with the finding of Suntzeff (1996, 2003) who shows that more than 80% of the total SN Ia uvoir flux appears in the 3000-10000Å window.
2.5 Comparison of observed and synthetic spectra
In order to interpret more deeply our observations, we have computed synthetic spectra for some of the available epochs. These models not only provide us with information about the physical properties of the SN ejecta, such as temperature, chemical composition, etc., but also they can be used to verify observation-based estimates of parameters such as reddening, distance and epoch. We used a Monte Carlo code originally developed by Abbott & Lucy (1985) to treat multi-line transfer in the expanding envelopes of hot stars. This code was further developed and adapted to SNe by Mazzali & Lucy (1993), Lucy (1999), and Mazzali (2000). We briefly describe here the structure of the MC code. Details can be obtained from the references given above. The code uses as input a model of the explosion (density v. velocity), the emergent luminosity , the epoch (time since explosion), the estimated velocity of the photosphere and a set of abundances. These are treated as homogeneous above the momentary photosphere.

The code divides the SN envelope into a number of shells, with the
thickness of each shell increasing as a function of radius.
Velocity is a continuous function of radius. For SN ejecta we may
assume homologous expansion, , where is the radius
and the time since the explosion. Density is rescaled
according to the epoch. The temperature in the various shells is
computed assuming radiative equilibrium. At a given epoch,
temperature and density are treated as constant in each shell. The
Sobolev approximation is adopted. Another basic assumption is
that all the radioactive decay and fast-electron energy is
deposited below a sharply-defined radius, the ”photosphere”
(Schuster-Schwarzschild approximation). This energy is distributed
equally among packets, which represent “collective photons”.
These packets are characterised by a specific frequency, and their
distribution with frequency represents the temperature at the
photosphere. The packets propagate through the envelope (i.e. the
ejecta above the photosphere) where they interact with electrons
and atoms. Interaction with electrons is treated as scattering,
while if a packet is absorbed by a line it is re-emitted in one of
the allowed downward transitions. This is selected randomly, but
weighted in proportion to the effective downward () rate of each transition. The packet is assigned the new
frequency and a random direction and the MC procedure continues
until the packet either escapes the ejecta or is absorbed back in
the photosphere. Finally, the emergent spectrum is computed using
the formal integral
(Lucy, 1999).

Here, we present and discuss synthetic spectra for two epochs. In
view of the somewhat unusual properties of SN 2002bo (e.g. the high
velocity of several lines at early epochs), we computed models for the
earliest spectrum (epoch days) to determine whether or not
the outer abundances are peculiar. We also computed models for a
spectrum observed near maximum light in order to check the consistency
of our results. The density structure and initial abundances were
taken from the W7 model (Nomoto et al., 1984). However, unlike the W7 model,
the composition is assumed to be uniform above the momentary
photosphere. This is done by taking the W7 abundance at the velocity
of the momentary photosphere and assuming that this is constant
throughout the outer ejecta. This procedure is repeated for each epoch
independently of the previous ones. An updated version of the code
implementing the full stratified abundance distribution is in
preparation. Keeping the density structure unchanged, the abundances
were then adjusted to improve the model match to the data.

We consider first the earliest spectrum (–13 days). As indicated above, we started with a W7-like abundance distribution. For the envelope at this epoch, the W7 abundance is dominated by Oxygen (mass fraction of 65%) and a rather small contribution of Carbon (7%). IME are represented by Magnesium (8%), Silicon (10%), Sulphur (2%) and Calcium (2%). Iron group elements (Titanium and Chromium 0.5% each, 2% of Iron, 2% of Nickel and 1% of Cobalt) complete the initial abundance set. Note that in order to reproduce observed features an Fe abundance is adopted that is higher than the the W7 value. This is also higher than what 56Co decay would allow, indicating that a significant quantity of Fe is left over from the progenitor. A grid of models were then computed in which radius of the ”photosphere”, emergent luminosity, abundance distribution, epoch and reddening were adjusted within a reasonable range to optimise the match to the observed –12.9 day spectrum. Each cell of the grid consists of a fixed epoch and reddening whilst the remaining parameters are consequently set to optimise the fit to the data. Although we could have included distance as one of the parameters of the grid, we chose to concentrate on a two parameter space to simplify our calculations. We therefore adopted a distance modulus , as given by the observations (Section 2.3). Spectra taken at the beginning of the rise of a SN are very useful to determine the correct epoch since luminosity changes significantly in this period. The position of the photosphere in velocity space can be determined fairly accurately by the position of the absorptions. Therefore, a change in the assumed epoch translates almost directly into a change of the photospheric radius (), which influences strongly the overall temperature structure and therefore the line depths and the ionization structure. The epoch was varied between 4 and 7 days post-explosion, and the reddening between 0.00 and 0.45. Velocity and luminosity were adjusted to fit the overall flux level and the position of the absorptions. The best match spectrum is shown in Figure 15.

The corresponding free parameter values obtained
are: photospheric radius cm (corresponding to
km s-1), log bolometric luminosity [erg s-1], epoch = days post-explosion,
and a total mass of the envelope of M⊙. The
abundance distribution is discussed below. From this we deduce
that the maximum-light spectrum corresponds to an epoch of
days post-explosion, indicating a risetime in of the
same value. With a higher reddening of , the best
(but poorer) match (see Fig. 15) was achieved with
radius cm ( km s-1), [erg s-1] at an epoch of days post-explosion,
implying a value of days for the epoch of the
maximum-light spectrum and the rise time. The abundance
distribution is discussed below. This higher-reddening match
yields a luminosity which is closer to the value of [erg s-1] inferred from Fig. 4 for this
epoch, which could be expected, since the uvoir luminosity in fig
4 was derived using the larger reddening. If a smaller reddening
was assumed, the SN luminosity would obviously be smaller, and
comparable to that obtained from the low-reddening models here.
While the overall best match was obtained with ,
plausible matches were also obtainable with smaller reddening.
However, since the photometry and NaID absorption indicate a
higher value viz. , we conservatively
adopt , and consider models with
both and 0.30.
The radiation temperature at the photosphere is found after six iterations determining the temperature structure in the envelope and counts for the ”backwarming” effect, i.e. photons are scattered back into the photosphere and heat it up. The values are K for the low-reddening model and K for the high-reddening model. Since in this temperature region there are ionisation edges of some elements like Si and S, this difference in temperature affects the ionization structure and consequently the emergent spectra are significantly different. In the low-reddening case, the Ca abundance was reduced to 1/4 of its initial value while, for the high-reddening case, it was reduced to 1/10. All abundances of the iron group elements are significantly lower than in W7 (% of the initial values), but the high-reddening model requires a higher Fe-group abundance in order to reproduce the observed strength of the FeII lines. This is due to the higher temperature in this model, which leads to a lower fraction of FeII. The overall reduction of most elements caused an increased oxygen abundance (%).

We now consider in detail the model matches to the early (–13 d) spectrum (Figure 15), and examine some of the more prominent features. Shortward of 6500 Å both models reproduce the main features of the data quite well. Starting at the bluest part of the spectrum, the need for a higher temperature in the high-reddening model is partly driven by the requirement to reproduce the total flux in this region. However this, in turn, tends to increase the ratio of doubly- to singly-ionised species. Consequently, to reproduce the deep MgII 4481 Å absorbtion at 4300 Å, a higher Mg abundance is required in the high-reddening model. A similar argument is relevant to the deep, broad absorption feature at 4800 Å, produced mostly by FeII lines. In the high-reddening model this requires an Fe abundance of 0.02 in the envelope, but in the low-reddening model this falls to 0.015. We conclude that higher abundances of Mg and Fe are required in the high-reddening model. In contrast, to reproduce the deep absorption feature at 5350 Å, attributed to SII 5640 Å, we need a somewhat higher S abundance in the low-reddening model (0.05 compared to 0.03). We ascribe this to a larger proportion of S recombining to the neutral state at this lower temperature compared with the high-reddening model. When we consider Si, a difficulty for the high-reddening model become apparent. In this model most of the Si is ionized to Si2+, making it impossible to reproduce the full depth of the 5650 Å absorption, attributed to the SiII 5972 Å line. The low-reddening model is able to reproduce the absorption features due to SiII 5972 Å, 6355 Å, by invoking a relative Si abundance of 0.12 (mass fraction) at high velocities ( km s-1). W7 predicts no Si at such high velocities from which we may infer that extensive mixing has taken place. However, accepting this, we might also expect to see evidence of oxygen mixed downward to low velocities. That this is not observed in the later spectra perhaps suggests that O was at least partially burned to Si even in the outer layers.
At longer wavelengths, both models produce a large excess of flux.
This is due to the limitation of the Schuster-Schwarzschild
approximation which is used in the code. In the red/infrared part
of the spectrum, where line opacity is low, the photosphere
actually lies at a greater depth than is estimated in the code,
and consequently the model overestimates the flux. Nevertheless,
we have carried out a comparison of model spectra with the
observations in the infrared region. Unfortunately there are no
infrared observations available at day –12.9, when the spectral
model is more applicable at such long wavelengths. The earliest
IR-spectrum is from day –8.5. Therefore, in order to examine the
8000–25,000 Å region, we scaled the flux of the –12.9d
low-reddening model by to bring it to the flux level of
the observed spectrum from day –8.5. The IR spectrum is shown in Figure
16, together with the model spectra for two values of
the carbon abundance (see below). In general there is reasonable
agreement between the models and the observations with respect to the
overall shape of the IR spectra. In the 8000–13000 Å window we
identify features due to the MgII 9217,9243 Å doublet and the
10914,10915,10952 Å triplet. Additionally there is a SiII feature
of minor importance at 9413 Å. In the 15,000–18,000 Å window we
attribute the broad absorption at 16,000 Å in the figure to a blend
of SiII 16,906 Å, 16,977 Å, 17,183 Å and MgII 16,760 Å,
16,800 Å, with the SiII feature dominating. Thus, at this early
epoch we confirm the IR identifications proposed by
Marion et al. (2003) for their spectra of other type Ia
supernovae. Marion et al. (2003) point out that the Mg II IR features
are valuable for placing limits on the mass of unburned material. We
shall address this issue in a later paper. In the 20,000-25,000 Å region line no strong features were observed in the spectrum nor
predicted by the model. There is only a shallow, broad P-Cygni
feature at 20800Å which we attribute to
SiII. Marion et al. (2003) did not cover this spectral region. A more
detailed analysis of the red/infrared part of the spectrum will be
accomplished in an upcoming paper using an improved version of the
code.
One reason that early-time spectra are of particular interest is because, via the strength of CII lines in the red part of the spectrum, they can provide interesting limits on the amount of carbon present, and how far into the outer layers the burning penetrated. The carbon abundance at extremely early times may even reveal the properties of the progenitor white dwarf. Fisher et al. (1997) suggested that the entire ‘SiII’ 6150 Å absorption feature in the –14 d spectrum of SN 1990N was actually CII 6578,83 Å at high velocity. However, Mazzali (2001) showed that this line could, at most, be responsible for only the red side of the 6150 Å feature, as indicated by its presence as a weak absorption at lower velocities sitting on top of the P-Cygni emission of the SiII line, and by the weakness of the corresponding CII 7231,36 Å line. Branch et al. (2003) identified absorption features due to CII 6578,83 Å and CII 7231,36 Å in the d spectrum of SN 1998aq. They are also clearly visible in the d spectrum of SN 1994D (Patat et al. (1996), Hernandez et al. (2000)), although by d they had almost disappeared (see Fig. 6). However, in SN 2002bo there is no trace of these features, even in the earliest spectra. In order to place limits on the abundance of high velocity C implied by this negative observation, we increased the 7% carbon relative abundance specified by W7, to 40% throughout the envelope. This produced very strong CII 6578,83 Å features which were not present in the observed spectrum. We then decreased the carbon abundance until the CII 6578,83 Å features became fully undetectable in the synthetic spectrum. This occurred for a C abundance of 3%.
As a check, we extended the modelling to 25,000 Å where CI and CII lines are found in the model’s line list. These include multiplets around 9,100 Å, 10,680 Å, 11,750 Å, 14,400 Å and 21,200 Å plus several single lines distributed throughout the 8000–25,000 Å region. Figure 16 shows the IR spectrum plus the 40% carbon and 3% carbon models. It can be seen that, even with a 40% carbon abundance, the carbon features are barely discernable. However, the observed spectrum shows no sign whatever of the predicted carbon features confirming that the carbon abundance is less than 40%. Reducing the carbon abundance to 3% causes the lines in the 8000–25,000 Å region to become too weak or too blended with other lines (mostly SiII or MgII) to be detectable. We conclude that the IR spectrum is consistent with a 3% carbon abundance, although the actual limit here is less stringent than in the optical region. We note that, aside from the low abundance, the weakness of the CI lines is due to the temperature of the SN ejecta which leads to an almost completely ionization to CII. The low carbon abundance is discussed in the next section.
We turn now to the optical spectrum taken close to maximum light (Fig. 17). By this epoch the photospheric radius has increased to cm (corresponding to km s-1) in the low reddening model, and cm (corresponding to km s-1) in the high reddening model. The photospheric luminosities are 43.03 [erg s-1] and 43.27 [erg s-1] respectively. Once again the high-reddening model attains a higher radiation temperature ( K) compared with the low-reddening model ( K). Note that the temperature of the spectrum near peak brightness is hotter than at –13 days. Such behaviour was also observed in SN 1990N (Mazzali et al. 1993), one of the few other SNe Ia with very early spectral coverage. It is probably due to the fact that the heating coming from the delayed release of radiation, still overcomes the expansion cooling of the envelope.
Both models have a problem in reproducing the 4300–4500 Å absorption, which is dominated by SiII lines. To reproduce the depth of the absorption, we need a high Si abundance (62.1% for the higher reddening model and 66.7% for the lower reddening one, respectively) indicating that the part of the ejecta with velocities near 10,000 km s-1 is dominated by IME. As with the high-reddening model at the earlier epoch, the need for such a high abundance is driven by the fact that almost all the Si is doubly-ionised in the model. We also note that both models produce a double structure in the trough, with the high-reddening case being more pronounced. Curiously, while this structure is absent from SN 2002bo, it is present in SNe 1994D and 1998bu (Fig. 7). The persistence of a weak absorption due to SiIII 4567 Å in the model suggests that could be even smaller than 0.30. The high ionisation also results in the absorption of the SiII 6355 Å line being slightly too shallow. However, most striking is the fact that the SiII 5958 Å absorption, while well reproduced in the low-reddening model is completely absent in the high reddening one.
As with the early-epoch spectrum, both models overproduce the flux longward of 6500 Å, with the high-reddening model being the most discrepant. The observed absorption at 7500 Å might be identifiable as OI 7771 Å. (Note that the narrower 7600 Å feature is the residual of the telluric absorption.) However, even with an unphysically high O abundance we cannot reproduce the depth of this feature since the high temperature ionises all the neutral oxygen. The modelled CaII absorption at 3750 Å due to the 3933,68 Å H&K doublet matches the observation very well, but the absorption at 8200 Å due to the 8500 Å IR triplet is too weak even after taking into account the offset between the spectral model and the observed continuum. Once again the match is somewhat better in the low-reddening model. In general, we find that the difficulties encountered by the high-reddening model are even larger at this epoch.
We conclude that modelling of both epochs suggests a reddening value smaller than the E derived from the Lira and NaID relations. This is indicated by the line ratios, line depths, overall shape of the spectra and the model abundances. Although distance was not included in our grid calculation, we computed some test models with high reddening and various distances for the –12.9 d spectrum. Relevant parameters are very sensitive to small changes at these early epoch (Mazzali & Schmidt, 2000). We find that reasonable results can be obtained for a higher reddening, but this requires using a significantly shorter distance (). In order to keep a temperature similar to the low reddening model we need to use the same luminosity. This leads to a bolometric luminosity at maximum light of 43.00 [erg s-1], similar to the luminosity of the low reddening model (43.03 [erg s-1]). So the model-derived luminosity is in any case lower than the value 43.19 [erg s-1] suggested by the observations (Section 2.3). The spectral model-derived explosion epoch of days is consistent with the rise-time derived from our photometry using the Riess et al. (1999) procedure, and with the average value for SNe Ia given by Riess et al. It may be that some of the difficulties encountered with the model results presented here arise from the artificial homogenisation of the element distribution in the envelope. The distribution of the elements throughout the ejecta will be addressed in a separate analysis using an improved version of the MC code, including abundance stratification.
3 Discussion
We have presented optical/near-infrared photometry and spectra of the type Ia SN 2002bo spanning epochs from –13 days before maximum -band light to +102 days after. The pre-maximum optical coverage is particularly complete. The extinction deduced from the observed colour evolution and from interstellar NaID absorption is quite high viz. E. On the other hand, model matches to the observed spectra point to a lower reddening (E). We have been unable to resolve this reddening dichotomy. However, the ESC has monitored another supernova, SN 2002dj. This event exhibits photometric and spectroscopic similarities to SN 2002bo, but suffers from much less interstellar extinction. Modelling of the spectra of SN 2002dj (Pignata et al, in preparation) may help to establish the true extinction to SN 2002bo.
In some respects, SN 2002bo behaves as a typical ”Branch normal” type Ia supernova (SN Ia) at optical and IR wavelengths. We find a -band risetime of 17.90.5 days, a (B) of , a de-reddened , and a bolometric maximum of . However, comparison with other type Ia supernovae having similar (B) values indicates that in other respects, SN 2002bo is unusual. The evolution of the SN 2002bo and colours shows some differences from that seen in SNe 1994D, 1998bu, 2001el (see Fig. 3). Moreover, while the optical spectra of SN 2002bo are very similar to those of SN 1984A (which has a similar (B) = 1.19), lower velocities and a generally more structured appearance are found in SNe 1990N, 1994D and 1998bu (see also Hatano et al. 2000), whose values of (B) are only slightly smaller (SNe 1990N and 1998bu) or slightly larger (SN 1994D). The evolution of (SiII) for SN 2002bo is strikingly different from that shown by other type Ia supernovae. The SN 2002bo spectra demonstrate the existence of S at km/s, Si at km/s and Ca at km/s. While small amounts of primordial abundances may be present, this cannot explain the strength of the high velocity IME spectral features. Moreover, modelling of the SiII 5972, 6355Å lines confirms the presence of Si at velocities higher than that predicted by W7. We conclude that the behaviour of SN 2002bo cannot be easily related to a single parameter description of the properties of SNe Ia (see also Hatano et al. (2000)).
The presence of high-velocity IME (Si, S, Ca) in SN 2002bo (and SN 1984A) may be interpreted in various ways. One possibility is that the explosion that became SN 2002bo was more energetic than that of the average SN Ia, thus setting material in motion at higher velocities. Given that the velocities in SNe 2002bo and 1984A are about 20% higher than in normal SNe Ia, the kinetic energy of the explosion would have to be about 44% larger. However, these high velocities are shown only by the IME. In the iron-group layers the Fe nebular lines have velocities comparable to those of normal SNe Ia, although lying to the higher velocity side of the distribution. Therefore, the physical difference between SN 2002bo and more normal SNe may not be so great. In support of this view, we note that most of the kinetic energy is produced by burning to Si, while the remaining burning stages to NSE make a further, but minor contribution.
Therefore one may imagine a situation where burning to IME continues further out into the outermost layers in SNe 2002bo and 1984A than in other SNe Ia. This enhanced burning may point to some form of delayed detonation (see also Lentz et al. (2001)). This scenario has some useful consequences. Since the IME are produced at high velocities, but at the same time no more 56Ni is produced than in other SNe Ia, then this would only have a small effect on , since the shape of the light curve depends mostly on the behaviour of the line opacity, which is dominated by Fe-group elements (Mazzali et al. 2001). Moreover, the amount of progenitor material (C, O) observed in the outer layers of the SN would be greatly reduced. In particular, if burning proceeded at a relatively low density, C, but not O, would be burned to IME thus explaining the unusually low abundance of carbon at the highest velocities. It may be that the –13 day photosphere happened to fall at the location where C but not O had been burned to IME. This layer has a small velocity extent, and its location depends on the overall properties of the explosion (it is located further out the more 56Ni was synthesized, see e.g. Iwamoto et al., Fig 25). It is therefore possible that the original, high C abundance might still exist in layers well above the photosphere of the –13 day spectrum, although those layers may have densities too low for C lines to be strong once the photosphere has receded to deeper layers. Furthermore, this picture may explain the cool early-time temperatures indicated both by the pre-maximum Si II line ratio and by the SiIII 4553, 4568Å feature (see Sect.2.5). If Si extends to higher levels than normal, to velocities where unburned material is usually found, then such Si would be subject to a much-reduced -ray/fast-electron flux and its temperature would be lower than in the Si layer of more typical SNe Ia. There would be a number of observable consequences of this situation: 1) at very early times, the Si lines would be stronger than in other SNe, and would extend to higher velocities, 2) also at very early times, the Si line ratio would indicate a lower temperature than in other SNe, because the Si that contributes to the lines is located further from the 56Ni, and 3) as time goes by it might be expected that the Si line ratio would evolve towards higher temperatures, as confirmed in Figure 9.
The above scenario will be more severely tested by spectral models
which include abundance stratification, and by the acquisition of even
earlier spectra. Extremely early observations may even place
constraints on the progenitor composition. In addition, the reason
for such behaviour will be explored via detailed 3D studies of the
explosion, which are currently under way.
Other possible explanations exist for the atypical behaviour of
SNe 2002bo and 1984A. For example, the IME produced at deeper layers
may be more efficiently mixed upwards in SNe 2002bo and 1984A than in
other SNe Ia. This may provide an equally plausible explanation for
all the characteristics discussed above. One way to discriminate
between the two possibilities is to look for C and O at lower
velocities - if IME have been mixed out, C and O should have been
mixed in.
A somewhat more exotic scenario is that SNe 2002bo and 1984A came from more massive progenitors, such as might be produced by a binary white-dwarf merger. In this case, however, one might expect that not only would more IME be produced at higher velocities, but also that more 56Ni would be synthesised. This scenario would lead not only to broad Fe nebular lines in the late-time spectrum, but also to a brighter SN (Arnett, 1982), something that does not seem to be the case here. The nebular lines in the late-time spectrum of SN 2002bo have widths comparable to those of other typical SNIa.
ACKNOWLEDGMENTS
We thank K. Krisciunas and N. Suntzeff for providing us with their photometry of SN 2002bo prior to publication. We also thank J.C. Wheeler for providing us an unpublished spectrum of SN 1984A taken at McDonald Observatory. This work is supported in part by the European Community’s Human Potential Programme under contract HPRN-CT-2002-00303, “The Physics of Type Ia Supernovae”. This work is partially based on observations collected at the European Southern Observatory, Chile (ESO No 169.D-0670), the Italian Telescopio Nazionale Galileo (TNG), La Palma, the Isaac Newton (INT), Jacobus Kapteyn (JKT) and William Herschel (WHT) Telescopes of the Isaac Newton Group, La Palma, and the United Kingdom Infrared Telescope (UKIRT), Hawaii. The TNG is operated on the island of La Palma by the Centro Galileo Galilei of INAF (Istituto Nazionale di Astrofisica) at the Spanish Observatorio del Roque de los Muchachos of the Instituto de Astrofisica de Canarias. The INT, JKT and WHT are operated on the island of La Palma by the Isaac Newton Group (ING) in the Spanish Observatorio del Roque de los Muchachos of the Instituto de Astrofisica de Canarias. UKIRT is operated by the Joint Astronomy Centre on behalf of the U.K. Particle Physics and Astronomy Research Council. Some of the data reported here were obtained as part of the ING and UKIRT Service Programmes. Some observations were also done within the International Time Programme “Omega and Lambda from supernovae and the Physics of SNe Ia explosions” at La Palma. For the Nordic Optical Telescope (NOT) observations we thank J. Gorosabel, T. Grav, T. Dahlen and G. Östlin who gave up some of their observational time. The NOT is operated on the island of La Palma jointly by Denmark, Finland, Iceland, Norway, and Sweden, in the Spanish Observatorio del Roque de los Muchachos of the Instituto de Astrofisica de Canarias. This work has made use of the NASA/IPAC Extragalactic Database (NED) which is operated by the Jet Propulsion Laboratory, California Institute of Technology, under contract with the National Aeronautics and Space Administration. We have also made use of the Lyon-Meudon Extragalactic Database (LEDA), supplied by the LEDA team at the Centre de Recherche Astronomique de Lyon, Observatoire de Lyon.
References
- Altavilla et al. (2003) Altavilla G., Fiorentino G., Marconi M. et al., 2003, MNRAS, submitted
- Abbott & Lucy (1985) Abbott D.C., Lucy L.B., 1985, ApJ 288, 679
- Arnett (1982) Arnett W. D., 1982, ApJ, 253, 785
- Axelrod (1980) Axelrod T.S., PhD. thesis, Univ. California at Santa Cruz
- Barbon et al. (1989) Barbon R., Rosino L., Iijima T., 1989, A&A, 220, 83
- Barbon et al. (1990) Barbon R., Benetti S., Rosino L., Cappellaro E., Turatto M., 1990, A&A, 237, 79
- Benetti (1989) Benetti S., 1989, Thesis, University of Padua
- Benetti et al. (2002) Benetti S., Altavilla G., Pastorello A., Riello M., Turatto M., Cappellaro E., Tomov T., Mikolajewski M., 2002, IAUC, 7848, 3
- Branch et al. (1988) Branch D., Drucker W., Jeffery D. J., 1988, ApJ, 330, L117
- Branch et al. (1993) Branch D., Fisher A., Nugent P., 1993, AJ, 106, 2383
- Branch et al. (2003) Branch D., Garnavich P., Matheson T., Baron E., Thomas R.C., Hatano K., Challis P., Jha S., Kirshner R.P., 2003, AJ, 126, 1489
- Cacella et al. (2002) Cacella P., Hirose Y., Nakano S., Kushida Y., Kushida R., Li W. D., 2002, IAUC, 7847
- Caldwell et al. (1998) Caldwell R. R., Dave R., Steinhardt P. J., 1998, PhRvL, 80, 1582
- Cardelli et al. (1989) Cardelli J.A., Clayton G.C. Mathis J.S., 1989, ApJ, 345, 245
- Chornock et al. (2002) Chornock R., Li W. D., Filippenko A. V., 2002, IAUC, 7851, 3
- Contardo et al. (2000) Contardo G., Leibundgut B., Vacca W.D., 2000, A&A, 359, 876
- Fisher et al. (1997) Fisher, A., Branch D., Nugent P., Baron, E., 1997, ApJ, 481, L89
- Freedman et al. (2001) Freedman W. L. et al., 2001, ApJ, 553, 47
- Garcia (1993) Garcia A. M., 1993, A&AS, 100, 47
- Gibson et al. (2000) Gibson, B.K., Stetson P.B., Freedman W. L., et al., 2000, ApJ, 529, 723
- Hamuy et al. (2002) Hamuy M., Maza J., Pinto P. A., et al., 2002, AJ, 124, 417
- Hatano et al. (2000) Hatano K., Branch D., Lentz E.J., Baron E., Filippenko A.V., Garnavich P.M., 2000, ApJ, 543, L49
- Hernandez et al. (2000) Hernandez M., Meikle W.P.S., Aparicio A., et al., 2000, MNRAS, 319, 223
- Hillebrandt & Niemeyer (2000) Hillebrandt W., Niemeyer J. C., 2000, ARA&A, 38, 191
- Hunt et al. (1998) Hunt L. K., Mannucci F., Testi L., Migliorini S., Stanga R. M., Baffa C., Lisi F., Vanzi L., 1998, AJ, 115, 2594
- Iwamoto et al. (1999) Iwamoto K., Brachwitz F., Nomoto K., Kishimoto N., Umeda H., Hix W. R., Thielemann F., 1999, ApJS, 125, 439
- Jha et al. (1999) Jha S., Garnavich P. M., Kirshner R. P., et al., 1999, ApJS, 125, 73
- Kawakita et al. (2002) Kawakita H., Kinugasa K., Ayani K., Yamaoka H., 2002, IAUC, 7848, 2
- Krisciunas et al. (2003) Krisciunas K., Suntzeff N. B., Candia P., et al., 2003, AJ, 125, 166
- Landolt (1992) Landolt A. U., 1992, AJ, 104, 340
- Leibundgut (1991a) Leibundgut B., Tammann G. A., Cadonau R., Cerrito D., 1991a, A&AS, 89, 537
- Leibundgut et al. (1991b) Leibundgut B., Kirshner R. P., Filippenko A. V., Shields J. C., Foltz C. B., Phillips M. M., Sonneborn G., 1991b, ApJ, 371, L23
- Leibundgut et al. (1993) Leibundgut B., Kirshner R. P., Phillips M. M., et al., 1993, AJ, 105, 301
- Lentz et al. (2000) Lentz E. J., Baron E., Branch D., Hauschildt P. H., Nugent P. E., 2000, ApJ, 530, 966
- Lentz et al. (2001) Lentz E. J., Baron E., Branch D., Hauschildt P.H., 2001, ApJ, 547, 402
- Li et al. (2001) Li W., Filippenko A. V., Gates E., et al., 2001, PASP, 113, 1178
- Lira (1995) Lira P., 1995, M.S. thesis, University of Chile
- Lucy (1999) Lucy L.B., 1999, A&A 345, 21 1
- Marion et al. (2003) Marion G.H., Höflich P., Vacca W.D., Wheeler J.C., 2003, ApJ, 591, 316
- Matheson et al. (2002) Matheson T., Jha S., Challis P., Kirshner R., Hradecky V., 2002, IAUC, 7849, 2
- Mazzali & Lucy (1993) Mazzali P.A., Lucy L.B., 1993, A&A 279, 447 (Paper II)
- Mazzali & Lucy (1998) Mazzali P.A., Lucy L., 1998, MNRAS, 295, 428
- Mazzali et al. (1993) Mazzali P. A., Lucy L., Danziger I. J., Gouiffes, C., Cappellaro E., Turatto M., 1993, A&A, 269, 423
- Mazzali et al. (1998) Mazzali P. A., Cappellaro E., Danziger I. J., Turatto M., Benetti S., 1998, ApJ, 499, L49
- Mazzali (2000) Mazzali P.A., 2000, A&A 363, 705
- Mazzali & Schmidt (2000) Mazzali P.A., Schmidt B.P., 2000, in: New Cosmological Data and the Values of the Fundamental Parameter, Proceedings of IAU Symposium no. 201, in press
- Mazzali (2001) Mazzali P. A., 2001, MNRAS, 321, 341
- Mazzali et al. (2001) Mazzali P. A., Nomoto, K., Cappellaro E., Nakamura, T., Umeda, H., Iwamoto, K., 2001, ApJ, 547, 988
- Meikle et al. (1996) Meikle W. P. S., Cumming R. J., Geballe T. R., et al., 1996, MNRAS, 281, 263
- Meikle (2000) Meikle W. P. S., 2000, MNRAS, 314, 782
- Nobili et al. (2003) Nobili S., Goobar A., Knop R., Nugent P., 2003, A&A, 404, 901
- Nomoto et al. (1984) Nomoto K., Thielemann F.-K., Yokoi K., 1984, ApJ 286, 644
- Nugent et al. (1995) Nugent P., Phillips M., Baron E., Branch D., Hauschildt P., 1995, ApJ, 455, L147
- Patat et al. (1996) Patat F., Benetti S., Cappellaro E., Danziger I. J., della Valle M., Mazzali P. A., Turatto M., 1996, MNRAS, 278, 111
- Perlmutter et al. (1999) Perlmutter S., Aldering G., Goldhaber G., et al., 1999, ApJ, 517, 565
- Persson et al. (1998) Persson S. E., Murphy D. C., Krzeminski W., Roth M., Rieke M. J., 1998, AJ, 116, 2475
- Phillips et al. (1999) Phillips M. M., Lira P., Suntzeff N. B., Schommer R. A., Hamuy M., Maza J., 1999, AJ, 118, 1766
- Riess et al. (1998) Riess A. G., Filippenko A. V., Challis P., et al., 1998, AJ, 116, 1009
- Riess et al. (1999) Riess A. G., Filippenko A. V., Li W., et al., 1999, AJ, 118, 2675
- Rigon et al. (2000) Rigon L., Turatto M., Benetti S., et al., 2000, MNRAS, 340, 191
- Saha et al. (2001) Saha A., Sandage A., Tammann G. A., Dolphin A. E., Christensen J., Panagia N., Macchetto F. D., 2001, ApJ, 562, 314
- Sarneczky & Bebesi (2002) Sarneczky K., Bebesi Z., 2002, IAUC, 7863, 3
- Schlegel et al. (1998) Schlegel D. J., Finkbeiner D. P., Davis M., 1998, ApJ, 500, 525
- Spyromilio et al. (1994) Spyromilio J., Pinto P. A., Eastman R. G., 1994, MNRAS, 266, L17.
- Stritzinger (2002) Stritzinger M., Hamuy M., Suntzeff N. B., et al., 2002, AJ, 124, 2100
- Suntzeff (1996) Suntzeff N. B., 1996, in IAU Colloq. 145: Supernovae ans Supernovae Remnants, eds. R. McCray, Z. Wang (Cambridge University Press), p.41
- Suntzeff et al. (1999) Suntzeff N. B., Phillips M. M., Covarrubias R., et al., 1999, AJ, 117, 1175
- Suntzeff (2003) Suntzeff N. B., 2003, in the proceedings to the ESO/MPA/MPE Workshop (an ESO Astrophysics Symposium) From Twilight to Highlight: The Physics of Supernovae, eds. B. Leibundgut and W. Hillebrandt (Springer-Verlag), p.183
- Tanvir et al. (1999) Tanvir, N. R., Ferguson, H. C., Shanks, T. 1999, MNRAS, 310, 175
- Tonry et al. (2001) Tonry J. L., Dressler A., Blakeslee J. P., Ajhar E. A., Fletcher A. B., Luppino G. A., Metzger M. R., Moore C. B., 2001, ApJ, 546, 681
- Turatto et al. (1996) Turatto M., Benetti S., Cappellaro E., Danziger I. J., della Valle M., Gouiffes C., Mazzali P. A., Patat F., 1996, MNRAS, 283, 1
- Turatto et al. (1998) Turatto M., Piemonte A., Benetti S., Cappellaro E., Mazzali P. A., Danziger I. J., Patat F., 1998, AJ, 116, 2431
- Turatto et al. (2003) Turatto M., Benetti S., Cappellaro E., 2003, in the proceedings to the ESO/MPA/MPE Workshop (an ESO Astrophysics Symposium) From Twilight to Highlight: The Physics of Supernovae, eds. B. Leibundgut and W. Hillebrandt (Springer-Verlag), p.200
- Vacca & Leibundgut (1996) Vacca W. D., Leibundgut B., 1996, ApJ, 471, L37
- Wegner & McMahan (1987) Wegner G., McMahan R.K., 1987, AJ, 93, 287
- Wheeler et al. (1998) Wheeler J. C., Hoeflich P., Harkness R. P., Spyromilio J., 1998, ApJ, 496, 908