The regeneration of stellar bars by tidal interactions. Numerical simulations of fly-by encounters.
Abstract
We study the regeneration of stellar bars triggered by a tidal interaction, using numerical simulations of either purely stellar or stellar+gas disc galaxies. We find that interactions which are sufficiently strong to regenerate the bar in the purely stellar models do not lead to a regeneration in the dissipative models, owing to the induced gas inflow in those models. In models in which the bar can be regenerated, we find a tight correlation between the strength and the pattern speed of the induced bar. This relation can be explained by a significant radial redistribution of angular momentum in the disc due to the interaction, similar to the processes and correlations found for isolated barred spirals. We furthermore show that the regenerated bars show the same dynamical properties as their isolated counterparts.
keywords:
galaxies: evolution – galaxies: interactions – galaxies: structure – galaxies: kinematics and dynamics.1 Introduction
Barred galaxies amount to more than one third of the catalogued disc galaxies in optical wavelengths (e.g., de Vaucouleurs 1963) and to about two thirds in the near-infrared [Eskridge et al. 2000]. It has been established by now, that the life of a bar can be divided into several episodes: its formation, evolution, dissolution and maybe its regeneration (e.g., see review by Friedli 1999).
Two mechanisms for the formation of bars in disc galaxies are being widely accepted at present. Bar formation can occur, as shown in many numerical simulations, spontaneously by a global instability in cold, rotationally supported stellar discs (e.g., Miller, Prendergast & Quirk 1970; Hohl 1971; Ostriker & Peebles 1973; Sellwood 1981; Athanassoula & Sellwood 1986; etc.). The second mechanism, also confirmed in numerous -body simulations, is the formation of tidally induced bars, triggered by interactions with neighbouring galaxies (e.g., Byrd et al. 1986; Noguchi 1987, 1988, 1996; Gerin, Combes & Athanassoula 1990; Barnes & Hernquist 1991; Salo 1991; Miwa & Noguchi 1998; etc.). To distinguish between the two bar forming mechanisms, Miwa & Noguchi [Miwa & Noguchi 1998] compared the properties of spontaneously formed and tidally induced bars by means of -body simulations and argued that tidally induced bars are slow rotators, while the spontaneously formed bars have usually higher pattern speeds.
Athanassoula [Athanassoula 2003] argued that the evolution of bars in isolated disc galaxies is driven by the redistribution of angular momentum. Since this is crucial for the work presented here, we will briefly summarise the main results. Disc galaxies strive to transfer angular momentum outwards [Lynden-Bell & Kalnajs 1972]. Disc material in the inner disc, being at resonance with the bar, emits angular momentum to resonant material in the outer disc, or in the spheroidal components like the halo and the bulge [Athanassoula 2002]. The corotation radius of the bar roughly divides the regions of disc emitters from that of disc absorbers. The size and the pattern speed of the bar responds to the angular momentum exchange in a way as to keep an equilibrium between the emitters and absorbers. These recent results argue strongly that the strength and the pattern speed of the bar are determined by the amount of angular momentum exchanged. The bar’s slowdown rate found in numerical simulations depends on the relative halo mass and on the velocity dispersion of both the disc and the halo. Furthermore, Athanassoula [Athanassoula 2002] has shown that bar growth in the disc can be stimulated even in massive halos due to the destabilising influence of resonant stars in the halo.
Another factor influencing the evolution of bars is the interstellar medium in the disc. Owing to the gravitational torques of the bar, gas can be driven towards the centre of the galaxy and this is likely to be accompanied by central starbursts and formation/fueling of an active galactic nucleus (Shlosman, Frank & Begelman 1989). Fully self-consistent numerical simulations including gas have shown that substantial gas inflow can weaken significantly, or even destroy, the bar (Friedli & Benz 1993; Berentzen et al. 1998). The central mass concentrations and the times-scales found in these simulations, however, might be too high and too short, respectively, to be in agreement with the relatively high fraction of barred galaxies observed. Furthermore, this fraction seems to be independent of galaxy morphology, i.e. the same in early- and late-type disc galaxies, while early-types are known to have considerably less gas.
A regeneration of the stellar bar, i.e. a secondary episode of bar-formation during the lifetime of the disc, has been suggested as a possible mechanism to explain the observed number of barred galaxies. One scenario for this (Sellwood & Moore 1999; Bournaud & Combes 2002) could be the accretion of gas-rich companion galaxies or freshly infalling gas, which, by adding colder material to the disc, may cool it sufficiently and allow the generation of a new bar. Another scenario suggested, and upon which we will focus in this paper, could be the regeneration of a previously dissolved or weakened bar by a tidal encounter with a neighbouring galaxy. In this work we study this regeneration process by means of fully self-consistent, 3D numerical simulations. The host galaxy, in which the first, i.e. spontaneously formed, bar has significantly weakened before the interaction, is tidally perturbed by a companion galaxy. Various orbits and masses have been considered for the companion, in order to cover a wide parameter space. We provide a comparison between pure stellar and two-component stars+gas models and describe the regeneration process and the dynamical properties of the tidally induced bars.
In §2 we describe the numerical methods and the initial conditions of the galaxy models. The evolution and the dynamical properties of the isolated models with and without gas are described in §3 and §4, respectively. In §5 and §6 we present the results of the interacting models with and without gas, respectively. The results are then discussed in §7 and finally we give a summary in §8.
2 Numerical methods and initial conditions
2.1 Methods
To evolve both the collisionless component, representing the stars and the dark matter, and the dissipative component, representing the gas, we use an -body algorithm, combined with a smoothed particle hydrodynamics (hereafter SPH) algorithm (e.g., review by Monaghan 1992). For this purpose we use the version of the hybrid -body/SPH code of Heller (1991; see also Heller & Shlosman 1994). The fully self-consistent 3D algorithm employs such features as a spatially varying smoothing length, a hierarchy of time-bins to approximate individual time-steps, a viscosity “switch” to reduce the effects of viscous shear, and the special-purpose hardware GRAPE-3AF to compute the gravitational forces and neighbour interaction lists (Sugimoto et al. 1990; Steinmetz 1996).
2.2 Initial conditions
| Component | Type | Md | rcut | z0 | ||
| Disc – I0 | ||||||
| stars | KT | 13 500 | 0.54 | 1.0 | 5.0 | 0.20 |
| gas | KT | 10 000 | 0.16 | 1.0 | 5.0 | 0.05 |
| Disc – I1 | ||||||
| stars | 17 500 | 0.7 | ||||
| Component | Type | Mh | rcut | |||
| Halo | ||||||
| stars | Pl | 32 500 | 1.30 | 5.0 | 10.0 | |
| Component | Type | Mc | ||||
| Companion | ||||||
| C1 | pt | 1 | 2.0 | |||
| C2 | pt | 1 | 4.0 | |||
| C3 | pt | 1 | 6.0 | |||
| C4 | pt | 1 | 8.0 | |||
| C5 | pt | 1 | 0.66 | |||
| C6 | pt | 1 | 1.0 |
Our isolated model I0 is initially composed of a stellar and a gaseous disc, embedded in a spherical halo. The radial surface density of both the discs follows a truncated Kuzmin-Toomre (hereafter KT) profile (Kuzmin 1956; Toomre 1963) with a radial scalelength . Their vertical density profile follows the distribution of an isothermal sheet [Spitzer 1942]. The halo is set up initially as a Plummer (hereafter Pl) sphere [Plummer 1911] with a radial scalelength , and is then allowed to relax in the gradually introduced potential of the frozen disc. For a detailed description of the initial model I0 see also Berentzen et al. [Berentzen et al. 2003]. The initial model parameters are summarised in Tab. 1. The columns from left to right give the component, the type of density profile, the particle number, the total mass, the radial scalelengths and , the cut-off radius , and the vertical scaleheight of each component. Our isolated model I1 differs from model I0 in that about one third of the gas particles have been replaced with stellar particles, i.e. with keeping their positions and assigning new masses, keeping the total disc mass the same as in model I0. The remaining gas particles have been completely removed from the disc. We then assign velocities to the new stellar particles according to the mean velocity distribution of the old underlying stellar disc. Both host galaxies, I0 and I1, are evolved in isolation first. The disc of I0 is constructed so as to be globally unstable to non-axisymmetric perturbations and form a large-scale bar. Owing to induced gas-inflow, the stellar bar in model I0 weakens significantly during its evolution, but is present in both models before the companion galaxy is introduced.
The companion galaxy in the interaction simulations is represented by a smoothed point mass (hereafter pt) for simplicity, applying a Plummer softening for the force calculation. Since the GRAPE-3 hardware can only handle a fixed softening length, we apply the same softening for all particles, including the companion. The mass ratio , where and are the total mass of the host and of the companion galaxy, respectively, has been varied between to . In addition a few simulations have been run with less massive companions. For the simulations presented in this paper we confine ourselves to planar fly-by encounters, i.e. the orbits of the host and the companion galaxy are unbound and lie in the equatorial plane of the host. The initial conditions have been chosen such as to provide a strong perturbation to the disc. The orbit of the companion galaxy is prograde with respect to the rotation in the host disc and has been chosen to be either parabolic or hyperbolic, with different pericentric separations . The pericentric position has been chosen such that at time of pericentre (hereafter ) the major axis of the relatively weak bar, which has formed/evolved in the hosts disc before the encounter, points towards the companion. The times of pericentric separation have been chosen to be and for all simulations with host galaxy I0 and I1, respectively. The initial orbital parameters at have been calculated from the solution of the corresponding two-body problem, either for a given orbital eccentricity , or for a pericentric angular frequency of the companion
| (1) |
where is the velocity of the companion at pericentre. To obtain the initial centre of mass positions and velocities of the host and of the companion galaxy, we integrate their orbits backward in time, starting from the pericentric time , until the distance between host and companion is roughly 10 times the cut-off radius of the initial halo. During this backwards orbit integration the particles of the host are frozen with respect to each other. Owing to the limited spatial range of the GRAPE-3 hardware, the interaction models have been calculated in the inertial frame of the host galaxy and the force of the companion has partly been calculated by direct summation on the front-end, i.e. without using the GRAPE hardware.
2.3 Units
The adopted units for mass, distance, and time are M⊙, kpc and yr, respectively, for which the gravitational constant G is unity. The dynamical time is yr, where is half the total mass of the host and is its half-mass radius, which is, after relaxation of the halo, approximately 8.5 kpc or in terms of the disc scalelength, . The initial stellar disc rotation period in these units then corresponds to yr. A fixed gravitational softening length of kpc is used for all particles. An isothermal equation of state is used for the gas with a sound speed of km s-1. The corresponding thermal gas temperature is 104 K.
3 Isolated model with gas – model I0
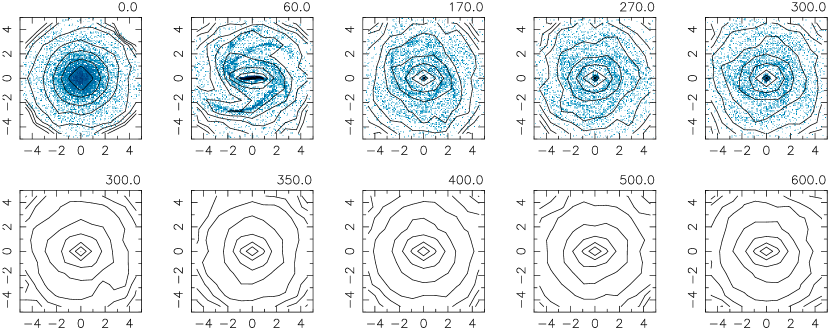
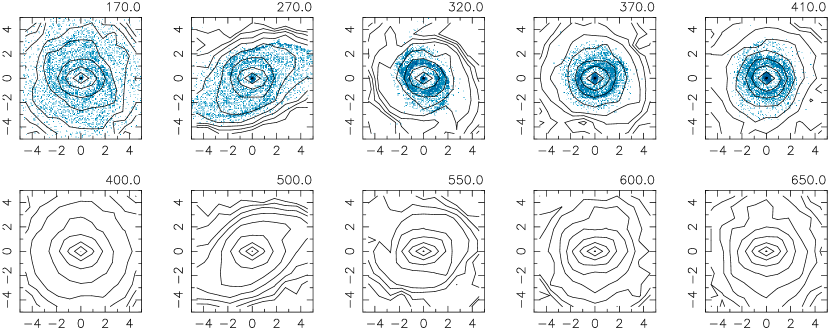
As described in the previous section, the isolated galaxy model I0 is composed of a stellar (collisionless) and a gaseous (dissipative) disc component, embedded in a live halo. The morphological evolution of the disc is shown in Fig. 1 (upper panels). The stellar disc has been chosen to be initially bar unstable and forms a large-scale bar within roughly 2 . The stellar bar reaches its maximum strength at about (see Fig. 2). The bar strength, here defined by the normalized Fourier component of the stellar disc mass distribution, has been measured inside a cylindrical radius of and about one scaleheight of the disc plane. Owing to the torque of the bar, most of the gas in the bar region is driven towards the centre of the galaxy, accumulating in a nuclear and circumnuclear disc. At the end of the run the mass of the gaseous nuclear disc represents some 18 per cent of the total mass within a spherical radius of kpc. As a result of the growing central mass concentration the stellar bar weakens significantly, and the disc settles down in a quasi-stable state at about . Some gas also accumulates near the end of the weak stellar bar, forming an oval ring close to the position of the inner ultra-harmonic resonance (hereafter UHR) at kpc. The pattern speed of the bar (hereafter ) first increases due to the short burst of gas inflow and thereafter reaches a constant rate of about , or 29.3 km s-1 kpc-1. The evolution of model I0 is followed in total up to , i.e. about 10 disc rotations. A more detailed description of the evolution of this model and its dynamical properties is given in Berentzen et al. [Berentzen et al. 2003].
To identify the presence and the location of the main planar resonances in the disc, we apply both the linear (epicyclic) approximation and non-linear methods. We therefore calculate the gravitational potential in the plane of the disc on a Cartesian grid and symmetrise it with a four-fold symmetry with respect to the main axes of the bar. From the potential we then derive the azimuthally averaged circular and epicyclic frequency and , respectively. The standard linear resonance condition is given by
| (2) |
with integers and . For a strict definition of the inner Lindblad resonances (hereafter ILRs; with and ) three extensions to the linear definition have been proposed (see Athanassoula [Athanassoula 2003] for a discussion), which are not fully compatible to each other and sometimes in contradiction. Throughout this work, unless otherwise noted, we apply the orbital structure definition for the ILRs, i.e. by saying that an ILR exists if and only if the and orbit families exist. The ILRs have been confirmed in this case by calculating the surfaces of section (hereafter SOS). The SOS have been constructed by integrating orbits of a given Jacobian energy (hereafter EJ; see also Sec. 4) in the equatorial plane of the disc and marking the points in the plane each time the orbits cross the line with (e.g., Binney & Tremaine 1987). At the end of the run () the corotation radius (hereafter CR; i.e., the radius at which ) in this model is at about kpc (), and the ILRs are located at about 0.47 kpc (inner ILR; ) and 2.1 kpc (outer ILR; ), respectively.


4 Isolated model without gas – model I1
We study the regeneration of the bar by interactions of two different types of host galaxies – with and without gas in the disc – which, nevertheless, have similar dynamical properties. We therefore construct our purely stellar model I1 by replacing the gas particles in model I0 with stellar particles, as described in Sec. 2.2. This has been accomplished for the last snapshot of model I0 at , i.e. at the end of the run, when the amplitude of the initial bar has very considerably decreased and the disc is in a quasi-stable state. After replacing the gaseous particles with stellar ones we follow the evolution of the new model I1 for another . The morphological evolution of the stellar disc is shown in Fig. 1 (lower panels), and in Fig. 2 we show the evolution of the bar strength and of the pattern speed. The bar strength first decreases abruptly, owing to the newly added stellar particles, which follow initially the distribution of the gas. The phase angle of the Fourier component of the latter is shifted with respect to that of the old underlying disc and therefore tends to decrease the normalized amplitude of the combined discs. The velocities, which are assigned to the new stellar disc component, follow the velocity distribution of the old underlying stellar disc. Therefore the stellar disc of model I1 is initially slightly out of virial equilibrium, since the dispersion of the stellar particles is higher than that of the gas particles. After some , however, the disc settles to a new equilibrium and the bar strength increases again, reaching its previous value and remaining constant after the short relaxation phase. Owing to the decreasing central mass concentration of the new stellar component, the pattern speed of the bar slightly decreases first, but remains roughly constant after the relaxation phase at about , or 21.5 km s-1 kpc-1, till the end of the run.


To gain some insight in the orbital structure of the disc of model I1, we locate the main planar periodic orbits in a frozen potential that rotates with the bar. General information on orbits in barred potentials can be found, e.g., in Contopoulos & Grosbøl [Contopoulos & Grosbøl 1989]. The gravitational potential has been calculated the same way as described in the previous section, but is time-averaged over roughly one bar rotation. For simplicity, we restrict ourselves to planar orbits which are bi-symmetric with respect to the bar and close after one orbit around the centre in the frame of reference corotating with the bar. The results are then displayed in terms of a characteristic diagram, where for each orbit we plot its Jacobi integral with respect to the -intercept value with the plane. The Jacobi integral is a conserved quantity along any given orbit in the rotating frame, and can be thought of as an effective energy (e.g., Binney & Tremaine 1987). In the characteristic diagram the orbits form curves of families. In Fig. 3 we show the characteristic diagram of the main orbit families, using the notation of Contopoulos & Papayannopoulos [Contopoulos & Papayannopoulos 1980], in model I1 at the end of the run (). The dashed curve is the zero-velocity curve (hereafter ZVC), which delineates the accessible region in the plane based on energy considerations. The family labelled consists of orbits that are elongated along the bar and predominately gives the bar its structure. Orbits of the -family are elongated perpendicular to the bar. Their presence is indicative of an ILR (or more than one) in the non-linear regime. The orbits are retrograde and slightly elongated perpendicular to the bar. The corotation radius in model I1 is at , or approximately kpc. The -orbits range in energy from to , with semi-major axes ranging from 0.86 to 2.1 kpc.
5 Interacting models with gas
| para- | ||||
|---|---|---|---|---|
| 0.3 | 0.6 | 0.9 | bolic | |
| 15.0 | a | b | c | p |
| 10.0 | d | e | f | p1 |
| 5.0 | g | h | i | p2 |
In this section we describe the simulations in which the gas-rich host galaxy I0 is perturbed by encounters with companions of different mass. The time of pericentric separation has been chosen to be for all runs with the host galaxy I0. In the first set of simulations the companions are initially set up to follow prograde, parabolic orbits with a pericentric separation of , which is just outside the halo of the host galaxy. When referring to a specific model, we will hereafter use a notation like, for instance, ‘I0 C4 p’, where ‘I0’ is the name of the host galaxy, ‘C4’ is the name of the companion (see Tab. 1), and ‘p’ (parabolic) denotes the type of orbit, the latter following the notation given in Tab. 2. In Tab. 3 we summarise the basic parameters and properties of both the isolated and the interaction models. The first and the second column give the name of the host and of the companion galaxy, respectively, and the third column gives the orbit of the companion (see Tab. 2). In the fourth column we give the time when the companion is included in the simulation, resulting from the initial backward orbit integration (see Sec. 2.2). The fifth to seventh column give the pericentric separation and frequency, and the eccentricity of the orbit, respectively. In the eighth and ninth column we give the strength and pattern speed of the bar, respectively, after the interaction. The tenth and eleventh columns give the ratio of bar strength and pattern speed to the corresponding values of the isolated model. In the penultimate column we give the interaction strength parameter as defined in Sec. 6.1 and in the last column the corotation radius at the end of each run, determined from the linear analysis.
In Fig. 4 (upper panels) we show an example of the morphological evolution of the disc during an encounter, in this case for model I0 C4 p. The bar strength as a function of time for the models with different massive companions is shown in Fig. 5. We find that the encounters in this set of simulations are not sufficiently strong to regenerate the stellar bar in the disc, even for a mass ratio of , i.e. even with companion C4. In order to increase the strength of the tidal perturbation on the host galaxy, we run two additional simulations with companion C4, in which we now choose pericentric separations of and . The orbits of the companion are again chosen to be prograde and parabolic. The bar strength for these models is shown in Fig. 6. The peaks immediately following result from the time when the transient tidal arms contribute to the power in the inner disc region, in which the bar amplitude is measured, but disappear as soon as the tidal arm features have dissolved. Even with these close encounters, it is not possible to regenerate the stellar bar in the disc of the gas-rich host galaxy.


In order to facilitate comparison with the purely stellar simulations described in the next section, we present here a more detailed analysis of the interaction simulations with the gas-rich host galaxy I0. As can be seen in Fig. 4 already, the interaction apparently leads to a significant redistribution of both the stellar and the gaseous material in the disc. This becomes more evident in Fig. 7, in which we show the logarithmic radial surface density of the disc and the halo for model I0 C4 p at times before and after the interaction. While the stellar density remains basically constant within a radius of approximately , i.e. roughly inside corotation in the corresponding isolated model, there is some net inflow of gas from the outer disc. The inflowing gas first piles up at a radius of about , which is close to the position of the gaseous ring, and then flows gradually towards the central disc region, accumulating in the nuclear disc. At the end of the run, the gas mass within 0.5 length units has increased by about 0.5 per cent of the total host mass, or some 6 per cent of the total gas mass, while the gas mass within 2 length units increased by roughly 1 per cent of the total mass, or about 12 per cent of the total gas mass. Some fraction of both the stellar and the gaseous material in the outer disc moves further out, contributing to the transient tidal arms and/or getting stripped off by the companion. The halo material in the inner region does not show any net radial redistribution, but we find some expansion in the outer parts, where halo material is also stripped off by the companion.
| Host | Comp | orbit | tstart | A | A/AI0,I1 | CR | ||||||
|---|---|---|---|---|---|---|---|---|---|---|---|---|
| I0 | – | – | 0.0 | 0.14 | 0.30 | 1.0 | 1.0 | 2.05 | ||||
| I1 | – | – | 100.0 | 0.16 | 0.22 | 1.0 | 1.0 | 2.76 | ||||
| I0 | C1 | p | 170.0 | 15.0 | 0.049 | 1.00 | 0.10 | 0.30 | 0.73 | 1.33 | 1.927 | 1.80 |
| I0 | C2 | p | 170.0 | 15.0 | 0.060 | 1.00 | 0.13 | 0.30 | 0.91 | 1.01 | 3.159 | 2.13 |
| I0 | C3 | p | 170.0 | 15.0 | 0.069 | 1.00 | 0.08 | 0.27 | 0.61 | 0.92 | 4.116 | 2.31 |
| I0 | C4 | p | 170.0 | 15.0 | 0.077 | 1.00 | 0.11 | 0.26 | 0.77 | 0.87 | 4.922 | 2.47 |
| p2 | 170.0 | 10.0 | 0.141 | 1.00 | 0.16 | 0.18 | 1.19 | 0.63 | 2.99 | |||
| p3 | 170.0 | 5.0 | 0.400 | 1.00 | 0.10 | 0.22 | 0.70 | 0.74 | ||||
| I0 | C4 | d | 250.0 | 10.0 | 0.300 | 8.00 | 0.06 | 0.28 | 0.44 | 0.93 | 1.906 | 2.20 |
| I1 | C5 | g | 450.0 | 5.0 | 0.300 | 3.22 | 0.18 | 0.20 | 1.14 | 0.90 | 0.717 | 2.94 |
| I1 | C6 | j | 470.0 | 7.5 | 0.300 | 11.66 | 0.17 | 0.21 | 1.08 | 0.92 | 0.419 | 2.94 |
| I1 | C6 | g | 450.0 | 5.0 | 0.300 | 2.75 | 0.21 | 0.19 | 1.31 | 0.82 | 1.105 | 2.78 |
| I1 | C1 | p | 400.0 | 15.0 | 0.049 | 1.00 | 0.16 | 0.22 | 1.00 | 0.98 | 1.927 | 2.87 |
| I1 | C1 | d | 480.0 | 10.0 | 0.300 | 21.50 | 0.17 | 0.21 | 1.11 | 0.93 | 0.458 | 2.95 |
| I1 | C1 | e | 490.0 | 10.0 | 0.600 | 89.00 | 0.16 | 0.21 | 1.04 | 0.95 | 0.261 | 2.90 |
| I1 | C1 | g | 440.0 | 5.0 | 0.300 | 1.81 | 0.27 | 0.12 | 1.74 | 0.56 | 2.417 | 4.13 |
| I1 | C1 | h | 480.0 | 5.0 | 0.600 | 10.25 | 0.22 | 0.18 | 1.38 | 0.82 | 1.124 | 3.25 |
| I1 | C1 | i | 480.0 | 5.0 | 0.900 | 24.31 | 0.19 | 0.19 | 1.19 | 0.87 | 0.833 | 3.20 |
| I1 | C1 | j | 470.0 | 7.5 | 0.300 | 8.48 | 0.21 | 0.19 | 1.33 | 0.84 | 0.852 | 3.19 |
| I1 | C2 | p | 400.0 | 15.0 | 0.060 | 1.00 | 0.17 | 0.21 | 1.08 | 0.94 | 3.159 | 2.95 |
| I1 | C2 | d | 480.0 | 10.0 | 0.300 | 14.00 | 0.18 | 0.20 | 1.15 | 0.92 | 0.928 | 2.99 |
| I1 | C2 | e | 490.0 | 10.0 | 0.600 | 59.00 | 0.17 | 0.21 | 1.09 | 0.95 | 0.523 | 2.90 |
| I1 | C2 | h | 480.0 | 5.0 | 0.600 | 6.50 | 0.21 | 0.18 | 1.33 | 0.81 | 2.303 | 3.27 |
| I1 | C2 | i | 480.0 | 5.0 | 0.900 | 15.88 | 0.20 | 0.19 | 1.25 | 0.87 | 1.679 | 3.10 |
| I1 | C3 | p | 400.0 | 15.0 | 0.069 | 1.00 | 0.21 | 0.18 | 1.36 | 0.81 | 4.116 | 3.30 |
| I1 | C3 | a | 480.0 | 15.0 | 0.300 | 36.97 | 0.17 | 0.21 | 1.05 | 0.94 | 0.500 | 2.86 |
| I1 | C3 | d | 480.0 | 10.0 | 0.300 | 10.25 | 0.21 | 0.18 | 1.36 | 0.82 | 1.410 | 3.29 |
| I1 | C3 | e | 490.0 | 10.0 | 0.600 | 44.00 | 0.19 | 0.20 | 1.18 | 0.89 | 0.787 | 3.07 |
| I1 | C3 | f | 490.0 | 10.0 | 0.900 | 100.25 | 0.17 | 0.20 | 1.09 | 0.94 | 0.594 | 2.91 |
| I1 | C3 | h | 480.0 | 5.0 | 0.600 | 4.63 | 0.26 | 0.13 | 1.64 | 0.61 | 3.545 | 3.71 |
| I1 | C3 | i | 480.0 | 5.0 | 0.900 | 11.66 | 0.24 | 0.17 | 1.51 | 0.74 | 2.541 | 3.35 |
| I1 | C4 | p | 400.0 | 15.0 | 0.077 | 1.00 | 0.23 | 0.17 | 1.45 | 0.77 | 4.922 | 3.43 |
| I1 | C4 | a | 480.0 | 15.0 | 0.300 | 29.38 | 0.17 | 0.21 | 1.09 | 0.94 | 0.803 | 2.93 |
| I1 | C4 | b | 490.0 | 15.0 | 0.600 | 120.50 | 0.16 | 0.21 | 1.05 | 0.95 | 0.460 | 2.88 |
| I1 | C4 | c | 490.0 | 15.0 | 0.900 | 272.38 | 0.16 | 0.22 | 1.03 | 0.97 | 0.349 | 2.82 |
| I1 | C4 | d | 480.0 | 10.0 | 0.300 | 8.00 | 0.24 | 0.17 | 1.52 | 0.74 | 1.906 | 3.51 |
| I1 | C4 | e | 490.0 | 10.0 | 0.600 | 35.00 | 0.17 | 0.20 | 1.11 | 0.90 | 1.052 | 3.05 |
| I1 | C4 | f | 490.0 | 10.0 | 0.900 | 80.00 | 0.17 | 0.21 | 1.10 | 0.93 | 0.793 | 2.94 |
| I1 | C4 | h | 470.0 | 5.0 | 0.600 | 3.50 | 0.22 | 0.13 | 1.41 | 0.57 | 4.869 | 3.66 |
| I1 | C4 | i | 480.0 | 5.0 | 0.900 | 9.13 | 0.24 | 0.16 | 1.50 | 0.70 | 3.419 | 3.41 |


We measure also the specific cumulative angular momentum (hereafter ) as a function of radius for both the stellar and the gaseous disc, given by
| (3) |
where , and are the planar radius, the mass and the angular momentum, respectively, of the -th disc particle. As an example we show in Fig. 8 the results of simulations with companion C4 and different pericentric separations. As can be seen in this plot, the interaction removes angular momentum from the stellar disc at all radii shown. We do not find any indication that the corotation radius of the bar or of the companion separates regions which gain from regions which lose angular momentum. More angular momentum is removed from the stellar disc for the closer pericentric separation. The gaseous disc shows a different behaviour. The gas in the inner disc gains angular momentum compared to the isolated model, within roughly and for pericentric separations of and , respectively, and loses angular momentum outside those radii.
In Fig. 9 we show the specific cumulative angular momentum as a function of radius in the combined disc (stars+gas). We find that the disc in the interaction models I0 C4 p and I0 C4 p2 does not lose, or even gains, angular momentum within a radius of and , respectively, as compared to the isolated model I0.
6 Interacting models without gas


In this section we describe the set of simulations with the purely stellar model I1 as the host galaxy. We start with simulations having similar orbits for the interaction as the ones described in the previous section, i.e. prograde and parabolic encounters using different companions (see Tab. 3). As shown in Fig. 10, in which we plot the bar strength as a function of time, simulations with mass ratios of and are, contrary to the dissipative models, sufficiently strong to regenerate the stellar bar in the disc, and the strength of the induced bar increases with the mass of the companion. In Fig. 11 we show as an example the characteristic diagram of the host galaxy of the interaction model I1 C4 p at time , i.e. the end of the run, in which the stellar bar has been successfully regenerated by the interaction. The orbit analysis has been performed following the description given in Sec. 4. The corotation radius in this model is at , or about kpc. The orbits range in energy from to , with semi-major axes ranging from to kpc.
Motivated by these results, we now explore a much wider – though still far from complete – parameter range, in order to determine the initial conditions necessary (or sufficient) to regenerate the stellar bar in the disc. We therefore run a set of simulations, in which we vary the orbit of the companion, the pericentric separation and the mass , respectively. The simulations and their basic initial parameters are summarised in Tab. 3. From the solution of the corresponding two-body problem the eccentricity of the companions orbit has been determined by its angular frequency at pericentre, and we restrict ourselves in this work to unbound orbits only. We choose such that a prescribed number of inner Lindblad resonances is present in the disc, i.e. that certain orbits in the disc are in resonance with the companion, when passing 111We point out that the angular frequency of the companion, and therefore also the location of the corresponding resonances in the disc, changes with time. Since the stellar bar in the unperturbed host galaxy is very weak, we apply the linear approximation, as described in Sec. 3, in order to determine the resonances in the disc. The resonance diagram for the isolated model I1 is shown in Fig. 12, and the frequencies chosen for the companion are:
| 1. | (two ILRs) | |
| 2. | (one ILR) | |
| 3. | (no ILR) . |
The mass of the companion for these simulations has been varied, as before, from to , and we have a few additional runs with even lower mass ratios, namely (C6) and (C5). A complete list of all simulations and of their main parameters is given in Tab. 3. Some of the companion orbits are illustrated in Fig. 13 for different eccentricities and pericentric separations.


In Fig. 14 we show the bar strength as a function of time for this set of interaction models. It is striking that – in contrast to the models with gas – the interaction is sufficiently strong to regenerate the bar in about half our models. As can also be seen from the plot, there is a general trend, that the strength of the induced bar increases with
-
•
increasing mass of the companion,
-
•
decreasing pericentric separation ,
-
•
decreasing pericentric frequency .
This is what one might generally expect, since the gravitational force of the companion is proportional to its mass, the tidal force decreases with , and the time integrated force of the companion on the host galaxy becomes stronger for slower passages.
Furthermore, after the bar has formed in the disc, we find that the amplitude of the bar stays constant with time. We have checked the life-time of the regenerated bar by running model I1 C4 d, which shows a significant increase in bar strength after the interaction, for roughly yr in total. Using a linear-fitting we find a decay-rate of the bar of roughly yr. With this the bar will drop to half its amplitude after approximately yr. After one Hubble time (with yr) the bar amplitude would have dropped only by 12 per cent. A fraction of this decrease could be introduced by the relatively low number of particles used in the simulations, so that in fact there could be (almost) no sign of a decay for bars formed in interactions. These results strongly argue for the fact that bars formed by the interaction are long-living and by no means transient phenomena.
6.1 Dynamical properties of the bars
To quantify the correlations described in the previous section, we define a parameter , which allows us to evaluate the interaction strength:
| (4) |
where and are the mean radial forces, exerted from the host I1 and the companion galaxy, respectively, averaged over the equatorial plane of the host galaxy. In practice we calculate them on a radial equally-spaced polar grid with maximum radius and then take a density weighted average. The integral in eq. (4) is carried out from to , with corresponding to , in order to guarantee an adequate convergence of in all models. For these force calculations both galaxies are approximated by point masses for simplicity. The results for are given in the penultimate column of Tab. 3. We also calculate the normalized bar strength , where and are the bar strength in the interaction model and in the isolated model, respectively. By plotting the normalized bar strength versus the interaction strength parameter (Fig. 15), we find a roughly linear correlation between the two quantities for each companion C, with . One of the models (I1 C4 h) is systematically off-set in all plots of this kind (i.e., Figures 15, 17 and 19), but always lies within the confidence limit. The models with parabolic encounters are all off-set from the relationships found, but seem to be correlated themselves linearly.
Plotting the bar strength of the different models in a diagram showing the logarithmic orbital eccentricity versus the angular frequency (see Fig. 16), we find that models with orbits of roughly are not sufficiently strong to regenerate the bar in the purely stellar models. A larger sample of simulations has to be run, however, to confirm the existence of such a limiting eccentricity. If such a limit really exists, it would give a necessary, but not sufficient condition for tidally induced bar formation for our purely stellar model.


Angular momentum exchange in isolated galaxies leads to correlations between the bar pattern speed and strength, as well as between the bar strength and the angular momentum gained by the spheroid, which, in many cases, is a measure of the angular momentum exchanged [Athanassoula 2003]. We will now test whether such correlations can be found in our regenerated bars. We indeed find a tight correlation between the strength and the pattern speed of the regenerated bars (Fig. 17). The stronger the bar gets after the interaction, the lower becomes its pattern speed, in good agreement with Athanassoula [Athanassoula 2003]. We further find that the pattern speed in the interaction models is always lower than in the corresponding isolated case.
The passage of the companion again is accompanied by a redistribution of disc angular momentum. The angular momentum exchange between the different disc regions (as defined in the previous section) is similar to that in Fig. 8. In Fig. 18 we show the radial distribution of the specific cumulative angular momentum for a set of simulations with companion C4 in comparison with the isolated model I1. For the runs with lower mass companions, we find similar results. It is noticeable that the regeneration of the stellar bar has been feasible only in those models which show a significant change in . Actually we find a tight correlation between the loss of angular momentum in the disc measured inside the initial disc cut-off radius and the induced bar strength, as shown in Fig. 19. The more angular momentum is removed from the disc, the stronger the regenerated bar becomes, in good agreement with what was found for isolated bars by Athanassoula [Athanassoula 2003]. We find the same correlation about equally strong when we plot the angular momentum change within the corotation radius. This important connection between the angular momentum exchange and the (re)generation process of the bar is described further in the discussion section.


7 Discussion
The regeneration of stellar bars triggered by galaxy interactions has been suggested as an additional scenario for the formation of bars and for explaining the observed frequency of bars along the Hubble sequence (Sellwood & Moore 1999 ; Friedli 1999; Athanassoula 2000). So far only the formation of tidally induced bars in initially non-barred disc galaxies and the required conditions, under which such an event may occur, have widely been studied by means of numerical simulations (Byrd et al. 1986; Noguchi 1988; Salo 1991; Miwa & Noguchi 1998; etc.). These results, however, need not necessarily apply to interactions with a formerly barred galaxy. Indeed, a former stellar bar likely might have changed the dynamics of the disc, i.e. increased the velocity dispersion in the stellar disc and changed both the density and angular momentum distribution (compare Fig. 20). Therefore, the regeneration of stellar bars is subject to different conditions than the formation of a bar in an bar-unstable isolated disc or in a tidal interaction.
In this work we present numerical simulations starting with a host galaxy which has initially been bar unstable and in which the bar has been significantly weakened due to gas inflow before the interaction.

7.1 Quantifying the interaction strength
To quantify the strength of the interaction, we have introduced a parameter for the interaction strength (Sec. 6.1), which basically takes the following quantities into account: 1) the mass of the companion, 2) the pericentric separation between the galaxies, and 3) the velocity of the companion at pericentre, defining a kind of interaction time-scale. With our definition (see Sec. 6.1), we find that the interaction strength correlates well, i.e. roughly linearly, with the strength of the regenerated bars, which have been created in our purely stellar models.

A different parameter for the interaction strength has been introduced by Dahari [Dahari 1984] as an estimate of the direct tidal impulse:
| (5) |
where and are the mass of the companion galaxy and the pericentric separation, respectively. is the mass of the host galaxy within the disc truncation radius . Salo [Salo 1991] has used the Dahari index as a quantitative measure for tidally induced bar formation in his 2D simulations and found a minimum value of , depending on the specific host galaxy, above which a bar is formed by the interaction. The specific limiting value of Salo found depends strongly the central mass concentration of the host galaxy and cannot be easily transferred to our model. Furthermore, applying the Dahari index to our simulations we find neither a correlation between the strength of the interaction and the regeneration of the bar, nor a limiting value of QD (see Fig. 21). The main drawback of the Dahari index is that it does not take into account the interaction orbit, i.e. the interaction time-scale. The Dahari index therefore does not seem to be sufficient to constrain the parameters necessary for the formation or regeneration of bars by galaxy interactions in general.
A more advanced parameter has been introduced by Elmegreen et al. [Elmegreen et al. 1991]. This is based on the Dahari index, but includes also the ratio between an interaction time-scale and some dynamical time of the disc:
| (6) |
where and is the time it takes the companion to move by one radian relative to the hosts centre at pericentre time. These authors also report a limiting value for the formation of the bar by tidal interactions. Applying this parameter to our simulations we find a correlation between the interaction strength and the strength of the regenerated bar (see Fig. 22). This, however, is less pronounced than the corresponding one for our parameter , which takes more fully the interaction into account. The existence of a limiting parameter, as found by Salo [Salo 1991] and Elmegreen et al. [Elmegreen et al. 1991], however, might be attributed to the method for measuring the bar strength. For our purely stellar simulations we find a correlation between and the induced bar strength rather than a limiting value of . Still, the exact correlation between and the bar strength – as described in Sec. 6.1 – is likely to be model dependent.

7.2 Radial redistribution of angular momentum
Athanassoula [Athanassoula 2003] argued that the redistribution of angular momentum is the driving agent for the evolution of an isolated barred galaxy. Both her analytical work and her numerical simulations show that galaxies that have exchanged more angular momentum should have a stronger bar, with a faster decreasing pattern speed. In our purely stellar models, we also find that, whenever bar regeneration occurs, it is always accompanied by a considerable loss of angular momentum from the disc (see Fig. 18). Indeed, as in the case of isolated galaxies [Athanassoula 2003], there is a tight correlation between the strength of the bar and the angular momentum lost by the inner disc. This argues that angular momentum exchange is tightly linked to the bar formation process, independent of whether that is spontaneous, or driven.
The actual exchange process, however, is not always the same. In isolated discs angular momentum is emitted by particles in resonance with the bar in the inner part of the disc (within corotation), and, to a lesser extent and if there is a considerable bar growth, by non-resonant particles in that region. This is absorbed by particles in the outer disc and halo. In this case there is only one pattern speed, that of the bar, since the spirals, which could in principle have a different pattern speed (Tagger et al. 1987; Sygnet et al 1988), have died away in the early parts of the simulations. Thus resonances are well defined. This is certainly not the case here. Besides the bar pattern speed, there is the driving frequency of the interaction which changes with time. Furthermore, the forcing from the companion is of comparable strength to that of the bar, and the companion itself participates actively in the angular momentum exchange. Thus, in contrast to the isolated cases, we do not find the bar corotation radius to separate disc angular momentum emitters from disc absorbers.

The bar regeneration process can be be understood in terms of basically the same angular momentum considerations as described by Athanassoula [Athanassoula 2003] for isolated disc galaxies. The bar in an isolated disc can get stronger and lose angular momentum basically by four different effects, which should be linked to each other. First, particles which were on quasi-circular orbits outside the bar get trapped into elongated orbits in its outer part and thus the bar becomes longer. Secondly, the orbits trapped in the bar could get thinner and make the bar thinner, too. Third, more mass could be get trapped on periodic orbits in the bar. And finally, the bar can of course lose angular momentum by slowing down. These effects should also be present in our case as well, where the loss of disc angular momentum is predominantly driven by the tidal perturbation of the companion. We will discuss here how much the different effects contribute to the regeneration of the stellar bars in our simulations. Since analytical calculations cannot make any statements about this, we will base the discussion on the dynamical properties and orbital structure of our specific models.
In Fig. 23 (right-hand column, upper panel) we show a direct comparison of the characteristic diagrams of the purely stellar models I1 and I1 C4 p at the end of each run, respectively. The characteristic diagram of the isolated and the perturbed case look very similar in terms of the layout of the main periodic orbits. The main difference, however, is that both the and the orbits extend to higher energies after the interaction. This is especially obvious for the part of the characteristic around , where the value of the intercept increases strongly with . This clearly moved towards higher energies. In Fig. 24 (right-hand column) we show some examples of the periodic orbits with different Jacobian energies of both the and the family. We find that the orbits become longer and, to some smaller extent though, also thinner after the interaction. This becomes clearer in Fig. 23 (middle panel), in which we plot the axial ratio of the orbits, where and denote the major and minor axis, respectively, as a function of . The main effect, however, is the lengthening of both the and the orbits towards higher energies and, taking into account the corresponding characteristic diagram, also in radial extent. For the orbits we also notice some lengthening towards lower energies, as well. Owing to these effects the bar gets both more centrally concentrated and more extended to large radii.
The thinning of the periodic orbits, which is less pronounced in our models than the lengthening, can be understood by the analytic calculations by Lynden-Bell (1979; hereafter LB79) in the context of gradual bar growth in isolated disc galaxies. As described in LB79, the mean circular frequency of most disc stars in the central and/or inner disc region is much higher than the pattern speed of the weak periodic perturbation, which is considered to be bar-like in this case. In the frame of reference corotating with the perturbation, the fast motion of the stars on near-circular orbits is not considerably affected by the weak perturbation and therefore the fast action variable (see LB79) is approximately constant. As shown by Lynden-Bell, angular momentum is removed from the orbits, whose elongation leads the perturbing bar-like potential. Near-resonant orbits in the inner disc region, which reside in the abnormal region (see Fig. 2 in LB79), i.e. the region where of the orbit decreases as its angular momentum decreases with constant , will align with the perturbation and become more eccentric, supporting the growth of the bar structure. As pointed out by Lynden-Bell, this way the bar shape also becomes more eccentric, but the length of the bar will not change significantly. The main difference to the scenario described in LB79 is that in our case, the perturbation is not periodic, since it is due to both the companion and the bar, and the angular frequency of the former is a function of time.
We finally check which orbits are important for making the bar. In the lower panel of Fig. 23 we therefore plot the number of particles as a function of , normalized by the total disc particle number within corotation of the isolated model I1. This way we get information about how the principal orbits at different energies are populated in our model. As can be seen from this plot, the total number of stellar particles within the corotation radius increased by less than 10 per cent. We conclude that the mass of the bar does not increase significantly. The main effect we find is that particles with energies close to the vertical -branch move towards higher energies or higher radial extent, taking into account the characteristic diagram.
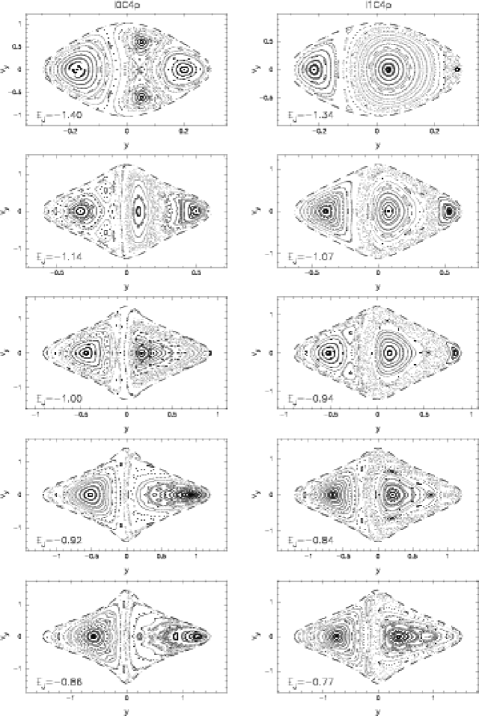
By tracking individual particle orbits in the corresponding potential and plotting their average y-intercept versus the Jacobian energy in the characteristic diagram, we find that the orbits in the purely stellar models are only populated by a very small fraction of particles. This result is consistent with Fig. 25, in which we show the surfaces of section of model I1 C4 p at the end of the run for different . As can be clearly seen, the family dominates phase space over a wide range in energy and the orbits are almost not present.

7.3 Influence of the gas
Interactions which are strong enough to induce a bar in our purely stellar models are not sufficiently strong to induce a bar in the -body/SPH models. In fact it has not been possible to induce a bar in any of our dissipative models, and we will here discuss the possible reasons for this. The stellar disc component in these simulations loses angular momentum, as was found also in the purely -body models (see Fig. 8 and 18). The gas in the inner parts, however, gains angular momentum, so that the inner parts of the disc may gain a small amount of angular momentum (see Fig. 9), or if they lose, it is considerably less than the corresponding quantity for the purely stellar case. Furthermore, as was shown in Fig. 7 the interaction is accompanied by a significant inflow of gas towards the central disc. These two effects, coupled, prevent the regeneration of the bar. In this section we discuss how the increase of the central mass concentration affects the orbital structure of the disc and thus helps prevent the regeneration of the bar in these models.
In Fig. 23 (left-hand column) we compare models with gas, before and after the interaction. In particular, for models I0 and I0 C4 p, we compare the characteristic diagrams (upper panel), the axial ratio of the and orbits (middle panel) and the particle number per energy range (bottom panel). In contrast to the models without gas (right column) the characteristic diagram of the models with gas extends more to lower energies, as would be expected from Fig. 7 and Sec. 4, that show clearly that the density distribution is centrally more concentrated in models with gas. Furthermore, the extent of the orbits is considerably larger, and the orbits have a sizeable instability strip between roughly and .
Information on the axial ratio of the and orbits and on their extent is given in the middle panels of Fig. 23 and in Fig. 24. We see clearly that the differences between the cases before and after the interaction are much smaller than for the purely stellar case. The orbits are a bit thinner after the interaction and the orbits have slightly larger radial extent, but the differences are small. From Fig. 23 and 24 we see that the orbits are less elongated than the corresponding orbits in the models without gas. This is particularly true at the highest and lowest energies. The extent of the elongated orbits is also considerably shorter. Also the orbits in the central region, i.e. at lower energies, are much rounder in the case with gas.
The number of stellar particles within corotation in models with gas (Fig. 23; bottom panel) have increased by roughly 12 per cent compared to the corresponding isolated model. Particles move from the intermediate energy region to the high energy one, and also, though to a lesser amount, to the low energy central region, similar to what is found in the models without gas.
Comparing the SOSs of models with and without gas (I0 C4 p and I1 C4 p, respectively) after the interaction (Fig. 25), we note that the area corresponding to orbits is much smaller in models with gas. On the other hand the area corresponding to chaotic motion and the area corresponding to orbits is considerably larger. The chaos in the cases with gas is due to the instabilities of the orbits, discussed above. The larger area covered by the orbits is in agreement with the fact that the characteristic is much more extended. To pursue this further we followed in the frozen potential the orbits of particles with initial conditions from the simulation, as we had already done for the simulations without gas. We find a notable difference. Namely there is now an indication that, contrary to the purely stellar case, a non-negligible fraction of the orbits is trapped around orbits. This difference can be understood as a result of the induced gas-inflow (see Fig. 7), in accordance with the results found in numerical simulations of isolated gas-rich barred galaxies (e.g., Friedli & Benz 1993; Berentzen et al. 1998). Owing to the growing central mass concentration the orbits cover a larger phase-space volume at the expense of the orbits.
Thus the fact that bars cannot be regenerated in simulations with gas can be understood with the help of the many differences between the two models, described above. There is considerably less angular momentum loss from the inner disc material, if this is not a gain. The interaction brings considerably less change of the shape and extent of the orbits, but renders them unstable over a considerable energy interval, thus introducing a considerable amount of chaos. Finally, due to the increased central concentration, the importance of the population is considerably increased. The coupling of these three anti-bar effects prevents the regeneration of a bar component.
7.4 Properties of regenerated bars
As a next step we discuss the properties of the regenerated bars compared to the ones formed by the bar instability in isolated discs. Contrary to Miwa & Noguchi [Miwa & Noguchi 1998], we find no clear evidence for qualitative differences between the two types of bars, while we do find clear evidence for similarities. The orbital differences between the two types of bars, discussed in the two previous subsections are quantitative, rather than qualitative, since they pertain only to the extent of the families and the shape of the corresponding orbits. The role of the resonances seems the same.
Athanassoula [Athanassoula 2003] found a correlation between the bar strength and the pattern speed of bars in isolated disc galaxies. In order to compare the properties of the bars formed in our models and the ones in isolated discs, we first calibrate our model units appropriately, as proposed in Athanassoula & Misiriotis [Athanassoula Misiriotis 2002], and then compared them to the ones in Athanassoula [Athanassoula 2003]. The result is shown in Fig. 26, which shows that the area covered by the driven bars is not separated by that covered by the isolated bars. This argues strongly for the similarity between the dynamical properties of the two types of bars, and the difficulty to distinguish between them.
Elmegreen & Elmegreen [Elmegreen & Elmegreen 1985] found two different types of major axis surface density profiles, the exponential and the flat ones, and Noguchi [Noguchi 1996] argued that this distinction could be due to the fact that the first type is found in spontaneous bars and the second in driven ones. We believe that the difference is due to the bar strength, rather than its origin, since Athanassoula & Misiriotis [Athanassoula Misiriotis 2002] showed that both types of profiles could be found in isolated galaxies: the flat profiles occurring in the stronger bars and the exponential ones in less strong ones.
Apart from these differences, we find agreement with the results of Miwa & Noguchi [Miwa & Noguchi 1998]. Thus, in our purely stellar simulations we find a roughly linear correlation between the pattern speed of the regenerated bar and its strength, or, accordingly, the interaction parameter (see Fig. 17 and 15, respectively). In other words, stronger bars – regenerated by the interaction – have lower pattern speeds. This result is in agreement with the simulations of Miwa & Noguchi [Miwa & Noguchi 1998], who find a similar correlation – less strict though – between the pattern speed of the induced bars and the companions mass. In both cases, i.e. the formation [Miwa & Noguchi 1998] and regeneration of stellar bars (see Fig. 17) by tidal interactions, the bars always have lower pattern speeds than the bars formed spontaneously in the corresponding isolated models.
In agreement with Noguchi [Noguchi 1987] and Gerin et al. [Gerin et al. 1990] we find that tidal bars are not transient, but long-lived, as are spontaneous bars. Thus bars which are observed at high redshifts [Sheth et al. 2003] may have formed by galaxy interactions and thus played an important role in the evolution of disc galaxies [Sheth et al. 2003].

7.5 Numerical considerations
The simulations presented in this work have been performed with a rather low particle number of the host galaxy, because of the relatively large sample of simulations. On the one hand the induced numerical noise in general supports the bar formation process, while on the other it will heat the disc, and thus make the bar regeneration more difficult. We trust, however, that a higher number of particles would make only quantitative, and not qualitative differences. Thus the physical results should remain unchanged.
The companion galaxy in our simulations has always been approximated by a softened point mass. For simulations in which the companion passes outside the halo of the host galaxy, this approximation is well suited. For simulations in which the companion crosses the halo, however, dynamical friction can be sufficiently strong to change the orbit of the companion and finally lead to a merger between the two galaxies.
8 Summary
In this paper we used numerical simulations to investigate the regeneration of a stellar bar by tidal encounters. The host galaxy has been chosen to be initially bar unstable and forms a large-scale bar during its early evolution. Before the interaction with the companion galaxy the bar significantly weakened, owing to the bar-driven gas-inflow towards the central disc region. For the simulations presented in this work we used two different types of host galaxies, i.e. one gas-rich disc model and one without gas. The encounters in our simulations have been chosen to be prograde with respect to the rotation in the host disc and co-planar with the discs equatorial plane. The mass and the orbit of the companion have been varied in order to cover a large parameter space.
We found that interactions, which are sufficiently strong to regenerate the bar in the purely stellar models, do not lead to a regeneration in the dissipative models. The regenerated bars in our simulations are long-living phenomena and by no means only transient, i.e. that (regenerated) bars formed by interactions may indeed contribute to the number of barred spirals at high redshifts and in the local Universe.
We have shown that the strength of the regenerated bars increases with the interaction strength. Owing to the tidal perturbation, angular momentum is removed from the disc. In fact, the whole disc within its initial cut-off radius loses angular momentum, in contrast to what is found for isolated discs, where the corotation radius of the bar separates disc regions losing and gaining angular momentum. The amount of angular momentum removed from the disc shows a clear correlation with the interaction strength. We argued that the main effect of this angular momentum loss is a significant extension of the region where bar-supporting orbits exist, resulting in a lengthening of the bar. As a further, though somewhat less important, effect, we found also a thinning of both the bar-supporting orbits and the bar itself.
The regenerated bars have lower pattern speeds than the bars in the corresponding isolated models. Furthermore, we found strong correlation between the strength and the pattern speed of the bar. This correlation is in very good agreement with the correlation found for bars in isolated discs. This is one of the pieces of evidence that the regenerated bars are qualitatively similar to those formed in isolated discs and thus cannot easily (if at all) be distinguished from them by their dynamical properties.
In contrast to the purely stellar simulations presented in this work, it has not been possible to regenerate the bar in our models including gas. We argued that this is due to the fact that less angular momentum is lost from the inner disc and to the fact that, owing to the interaction, additional gas is driven towards the centre of the disc. We concluded that the regeneration of stellar bars by galaxy interactions seems to be a reasonable mechanism for galaxies containing not too much gas, provided the external forcing is sufficiently strong.
9 ACKNOWLEDGMENTS
We would like to thank Albert Bosma for interesting discussions, J.C. Lambert and C. Theis for their computer assistance, and the referee, Ron Buta, for his comments.
I.B. acknowledges support from DFG grant Fr 325/48-2, /48-3 and Volkswagen Foundation grant I/76 520. He thanks the DFG for funding the grape facilities at the Sternwarte Göttingen. C.H. acknowledges support from grants HST-AR-09546.02-A, NSF-AST-0206251, GSU-FRG-2002, and DFG Fr 325/39-1, /39-2. E.A. would like to thank the IGRAP, the INSU/CNRS and the University of Aix-Marseille I for funds to develop the grape facilities used for part of the calculations in this paper. The final draft of this paper was written while E.A. was in I.N.A.O.E. She thanks the I.N.A.O.E. staff for their kind hospitality and ECOS-Nord/ANUIES for a travel grant that made this trip possible.
References
- [Athanassoula 2000] Athanassoula E., 2000, review in the XIVth IAP meeting ”Galaxy Dynamics, from the Early Universe to the Present”
- [Athanassoula 2002] Athanassoula E., 2002, ApJ, 569, L86
- [Athanassoula 2003] Athanassoula E., 2003, MNRAS, 341, 1179
- [Athanassoula Misiriotis 2002] Athanassoula E., Misiriotis A., 2002, MNRAS, 330, 35
- [Athanassoula & Sellwood 1986] Athanassoula E., Sellwood J.A., 1986, MNRAS, 221, 195
- [Barnes & Hernquist 1991] Barnes J.E., Hernquist L.E., 1991, ApJ, 370, 65
- [Berentzen et al. 2003] Berentzen I., Athanassoula E., Heller C.H., Fricke K.J., 2003, MNRAS, 341, 343
- [Berentzen et al. 1998] Berentzen I., Heller C.H., Shlosman I., Fricke K.J., 1998, MNRAS, 300, 49
- [Binney & Tremaine 1987] Binney J., Tremaine S., 1987, Galactic Dynamics, Princeton Univ. Press, Princeton NJ
- [Bournaud & Combes 2002] Bournaud F., Combes F., 2002, A&A, 392, 83
- [Byrd et al. 1986] Byrd G.G., Valtonen M.J., Valtaoja L., Sundelius B., 1986, A&A, 166, 75
- [Contopoulos & Grosbøl 1989] Contopoulos G., Grosbøl P., 1989, A&ARv, 1, 261
- [Contopoulos & Papayannopoulos 1980] Contopoulos G., Papayannopoulos Th., 1980, A&A, 92, 33
- [Dahari 1984] Dahari O., 1984, AJ, 89, 966
- [de Vaucouleurs 1963] de Vaucouleurs G., 1963, ApJS, 8, 31
- [Elmegreen & Elmegreen 1985] Elmegreen B.G., Elmegreen D.M., 1985, ApJ, 288, 438
- [Elmegreen et al. 1991] Elmegreen D. M., Sundin M., Sundelius B., Elmegreen B., 1991, A&A, 244, 52
- [Eskridge et al. 2000] Eskridge P.B., Frogel J.A., Pogge R.W., et al., 2000, AJ, 119, 536
- [Friedli 1999] Friedli D., 1999, in: The evolution of galaxies on cosmological timescales, eds. J.E. Beckman J.E., Mahoney T.J., ASP Conf. Series 187, 88
- [Friedli & Benz 1993] Friedli D., Benz W., 1993, A&A, 268, 65
- [Gerin et al. 1990] Gerin M., Combes F., Athanassoula E., 1990, A&A, 230, 37
- [Heller 1991] Heller C.H., 1991, Ph.D. thesis, Yale University
- [Heller & Shlosman 1994] Heller C.H., Shlosman I., 1994, ApJ, 424, 84
- [Hohl 1971] Hohl F., 1971, ApJ, 168, 343
- [Kuzmin 1956] Kuzmin G., 1956, Astron. Zh, 33, 27
- [Lynden-Bell 1979] Lynden-Bell D., 1979, MNRAS, 187, 101L
- [Lynden-Bell & Kalnajs 1972] Lynden-Bell D., Kalnajs A.J., 1972, MNRAS, 157, 1L
- [Miller et al. 1970] Miller R.H., Prendergast K.H., Quirk W.J., 1970, ApJ, 161, 903
- [Miwa & Noguchi 1998] Miwa T., Noguchi M., 1998, ApJ, 499, 149
- [Monaghan 1992] Monaghan J.J., 1992, ARA&A, 30, 543
- [Noguchi 1987] Noguchi M., 1987, MNRAS, 228, 635
- [Noguchi 1988] Noguchi M., 1988, A&A, 203, 259
- [Noguchi 1996] Noguchi M., 1996, ApJ, 469, 605
- [Ostriker & Peebles 1973] Ostriker J.P., Peebles P.J.E., 1973, ApJ, 186, 467
- [Plummer 1911] Plummer H.C., 1911, MNRAS, 71, 460
- [Salo 1991] Salo H., 1991, A&A, 243, 118
- [Sellwood 1981] Sellwood J. A., 1981, A&A, 99, 362
- [Sellwood & Moore 1999] Sellwood J. A., Moore E.M., 1999, ApJ, 510, 125
- [Sheth et al. 2003] Sheth K., Regan M.W., Scoville N., Sparke L., 2003, ApJL, in press
- [Shlosman et al. 1989] Shlosman I., Frank J., Begelman M.C., 1989, Nat, 338, 45
- [Spitzer 1942] Spitzer L., 1942, ApJ, 95, 329
- [Steinmetz 1996] Steinmetz M., 1996, MNRAS, 278, 1005
- [Sugimoto et al. 1990] Sugimoto D., Chikada Y., Makino J., Ito T., Ebisuzaki T., Umemura M., 1990, Nat, 345, 33
- [Sygnet et al. 1988] Sygnet J.F., Tagger M., Athanassoula E., Pellat R., 1988, MNRAS, 232, 733
- [Tagger et al. 1987] Tagger M., Sygnet J.F., Athanassoula E., Pellat R., 1987, ApJ, 318, 43L
- [Toomre 1963] Toomre A., 1963, ApJ, 138, 385